Max Armour
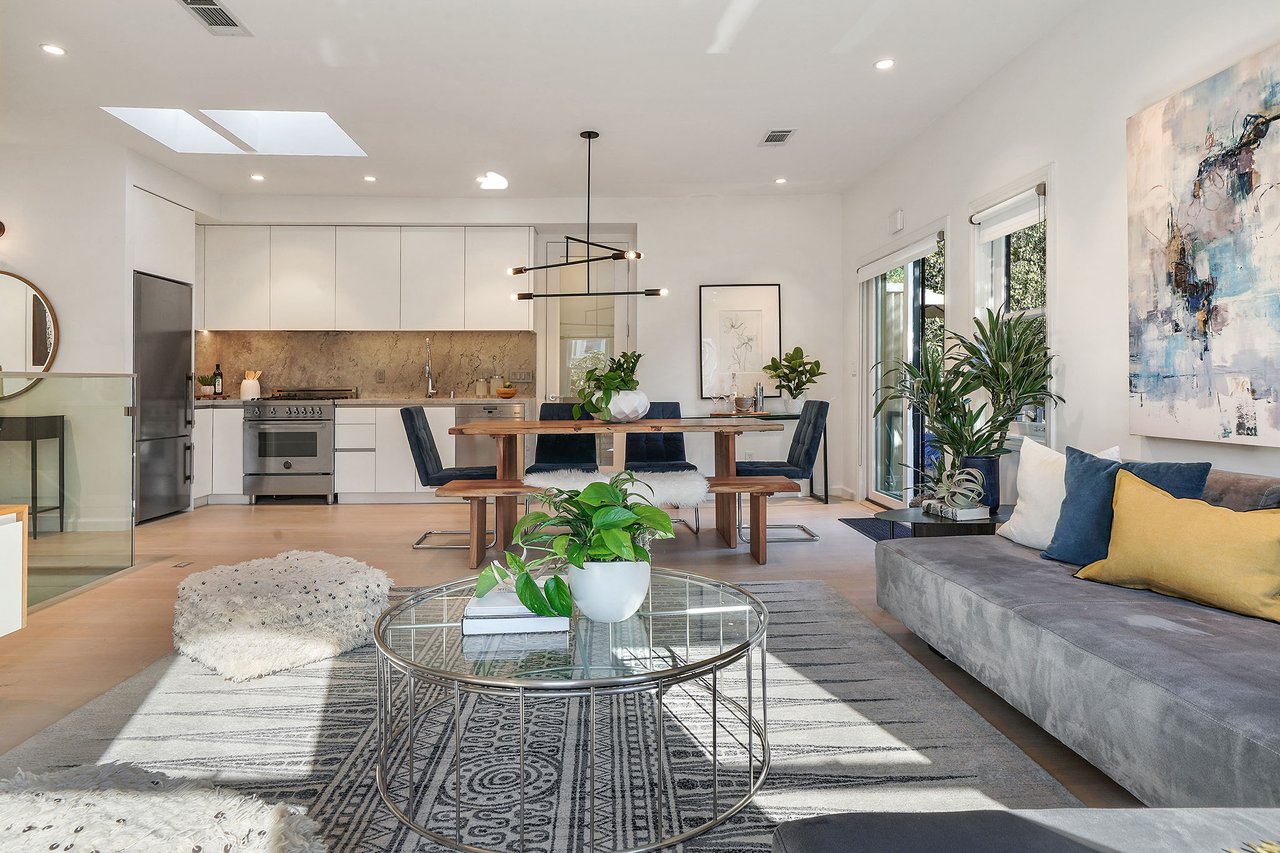
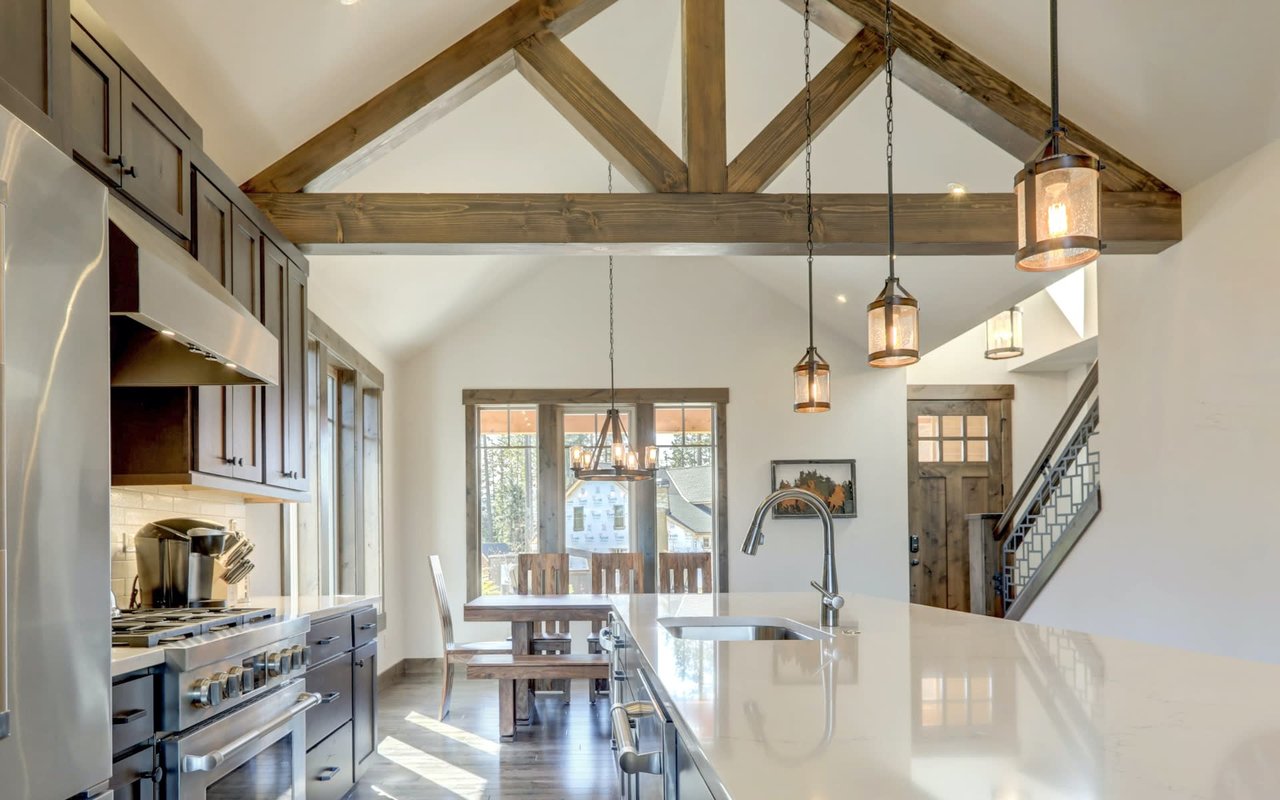
Open-plan kitchen with a white island, stainless steel range, and exposed timber ceiling beams.

September 2025

San Francisco House & Condo Markets by Realtor District & Neighborhood

SAN FRANCISCO SEPTEMBER MARKET REPORT


  • Mortgage Interest Rates: As of September 2025, the weekly average 30-year conforming-loan interest rate reported by Freddie Mac was 6.5%, its lowest reading since October 2024. Additionally, the daily average rate reported by Mortgage News Daily dropped to 6.28% on September 8, 2025.

  • Median Sales Prices:

    • Houses: The 3-month rolling median house sales price in August 2025 increased by 3% year-over-year but declined from the spring peak.
    • Condos: The 3-month rolling median condo sales price rose by just over 1% year-over-year, reflecting slower appreciation compared to houses.
  • Stock Market Impact: The S&P 500 and Nasdaq indices have seen significant growth since January 2024, with large increases positively influencing affluent real estate markets like San Francisco.

  • Luxury Home Sales: After a summer slowdown, luxury home sales (houses priced $5M+ and condos/co-ops priced $3M+) are expected to rebound in the fall, with seasonal fluctuations being a key trend.

  • Market Dynamics:

    • New Listings: Listing activity typically peaks in September, fueling the fall selling season.
    • Days on Market: In August 2025, houses sold in an average of 34 days, while condos took 73 days.
    • Overbidding: 47% of sales closed over the list price, with houses at 70% and condos at 25%.


San Francisco housing market report for neighborhoods and realtor districts, with the Golden Gate Bridge above.
 
San Francisco neighborhood home-price chart with green bars showing median prices and selected high sales.
 
Bar chart of median San Francisco house prices across selected neighborhoods, from $917,300 in Bayview to $1,830,000 in Lakeside.
 
Chart of median house values per square foot across selected San Francisco neighborhoods, from $607 in Bayview to $1,903 in Presidio Heights.
 
Chart comparing median house sizes across selected San Francisco neighborhoods, with Presidio Heights largest and Ingleside smallest.
 
Bar chart ranking San Francisco neighborhoods by 12-month house sales, led by Parkside and Sunset.
 
Bar chart comparing days on market across San Francisco house-market districts, from 19 to 53 days.
 
San Francisco districts’ share of listings selling over asking ranges from 34% in Pacific Heights to 85% in Sunset-Parkside.
 
San Francisco house-market chart by district, showing overbid percentages from 19% to 1.5% under list price.
 
Chart of San Francisco luxury home sales by district and price segment, with Pacific Heights and nearby areas leading.
 
Map of San Francisco Realtor districts and neighborhoods, color-coded and labeled with districts 1 through 10.
 
San Francisco condo market report cover with Golden Gate Bridge panorama, neighborhood-and-district title, and Compass branding.
 
Chart comparing median San Francisco condo prices across neighborhoods, from $2,277,500 in Presidio Heights to $592,000 in Hunter's Point.
 
Chart comparing median San Francisco condo values per square foot across selected neighborhoods; Marina leads at $1,278.
 
Bar chart of median condo sizes across selected San Francisco neighborhoods, ranging from 754 to 1,743 square feet.
 
Chart of average condo days on market across San Francisco districts, ranging from 33 to 107 days.
 
San Francisco condo chart showing the share of listings sold over list price by realtor district, ranging from 12% to 60%.
 
Chart of San Francisco condo overbid and underbid percentages by realtor district, with green and red bars.
 
Bar chart ranking San Francisco neighborhoods by condo sales, led by South Beach with 237 and Pacific Heights with 160.
 
Chart of San Francisco luxury home sales by district and price segment; Pacific Heights, Cow Hollow, and Marina lead.


Chart comparing Bay Area median home values by county and bedroom and bath count, with San Francisco highlighted.
 
Chart comparing median home prices, square footage, and price per square foot across Bay Area counties by bedroom count.
 
Chart comparing Bay Area condo and townhouse median values by county, with San Francisco highlighted.
 
Real estate report notes explain statistical estimates, median sales price, square-foot calculations, and Compass’s disclaimer.
 
San Francisco neighborhood home sales and values table, with single-family and condo statistics for three districts.
Table comparing single-family and condo sales, median sizes, prices, and price per square foot in San Francisco neighborhoods.
San Francisco neighborhood market table comparing single-family home and condo sales, sizes, and median prices.
San Francisco real estate market table comparing single-family homes and condo sales by neighborhood.
San Francisco neighborhood single-family home and condo sales, median prices, and price-per-square-foot statistics.

Follow Us On Instagram