
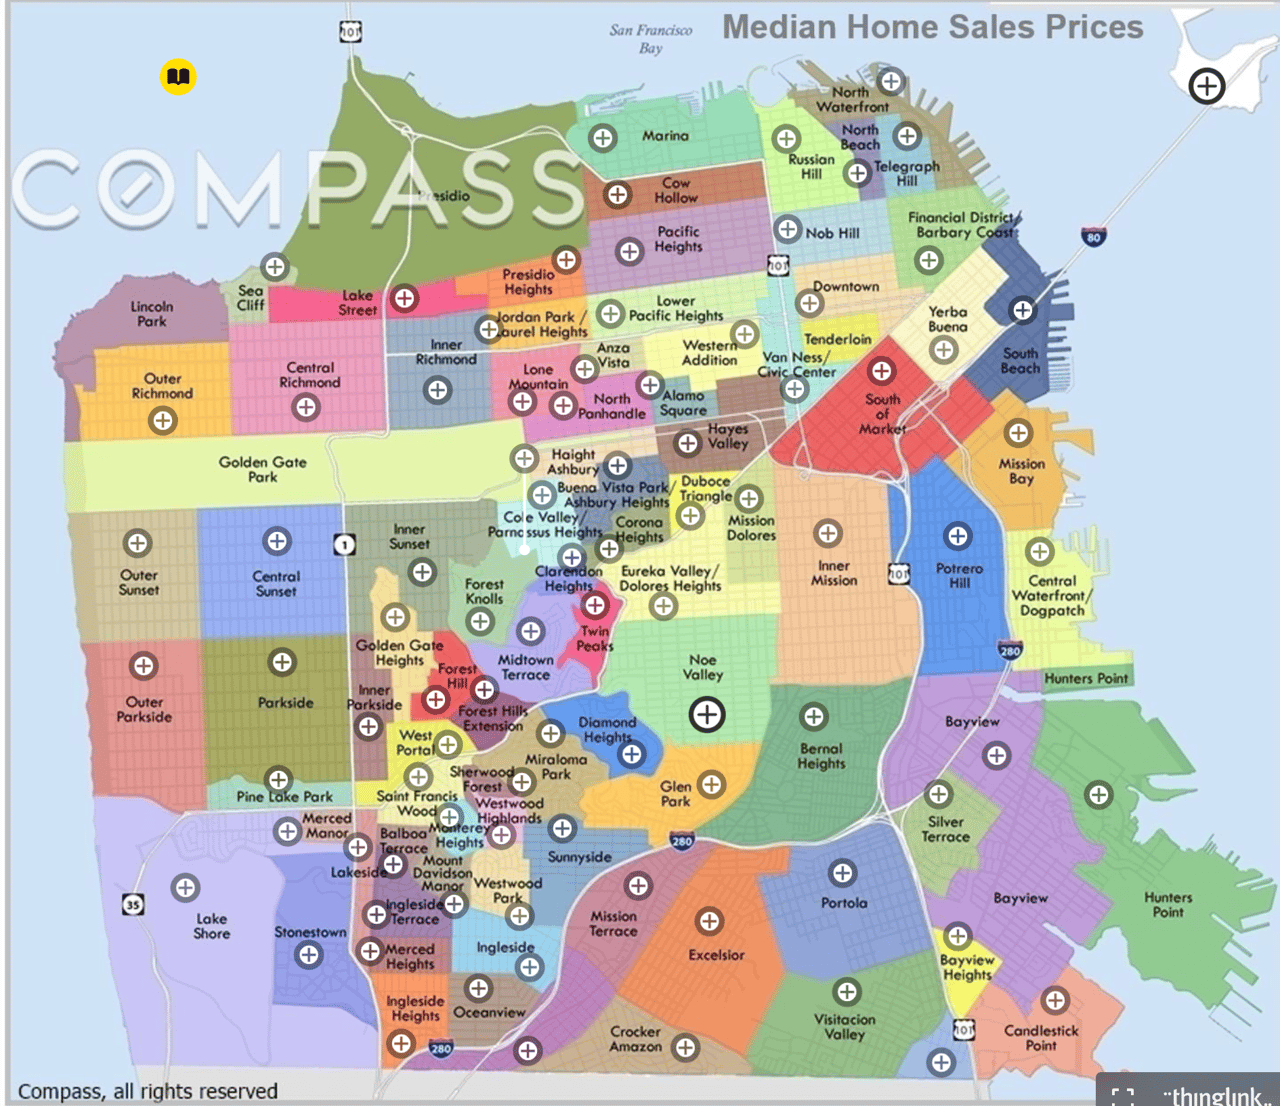
SAN FRANCISCO NEIGHBORHOOD MEDIAN HOME SALES PRICE MAP
This map reflects median home sales prices and dollar per square foot values in San Francisco neighborhoods for sales reported to NORCAL MLS® ALLIANCE in the 12 months through late April 2024. New sales are constantly being reported which may change these calculations.
-> Click on icons to pull up neighborhood median home sales prices. Click on the X to close the window for the specific neighborhood.
MARIN COUNTY MEDIAN HOME SALES PRICE MAP - COMPASS
This map reflects house sales reported to NorCal MLS Alliance in the 12 months through late April 2024 in Marin County by city, town or region.
-> Click on icons to pull up neighborhood median home sales prices. Click on the X to close the window for the specific neighborhood.
Links to recent market reports as flip books, prepared by our analyst at COMPASS:
1. San Francisco Market report May 2024
2. Marin County Market report May 2024
Thanks for reading!
Ready to achieve your real estate goals?
Reach out to chat!
A market overview of North side sales in San Francisco from 7/1/23-12/31/23