


Max Armour
Staged dining room opens to a terrace with hillside, water, and distant city views.

Marin County November Report

November 2022. Home prices in the cities and towns of affluent Marin County, market conditions and trends, luxury home sales, supply a...
Marin County November 2022 real estate market report
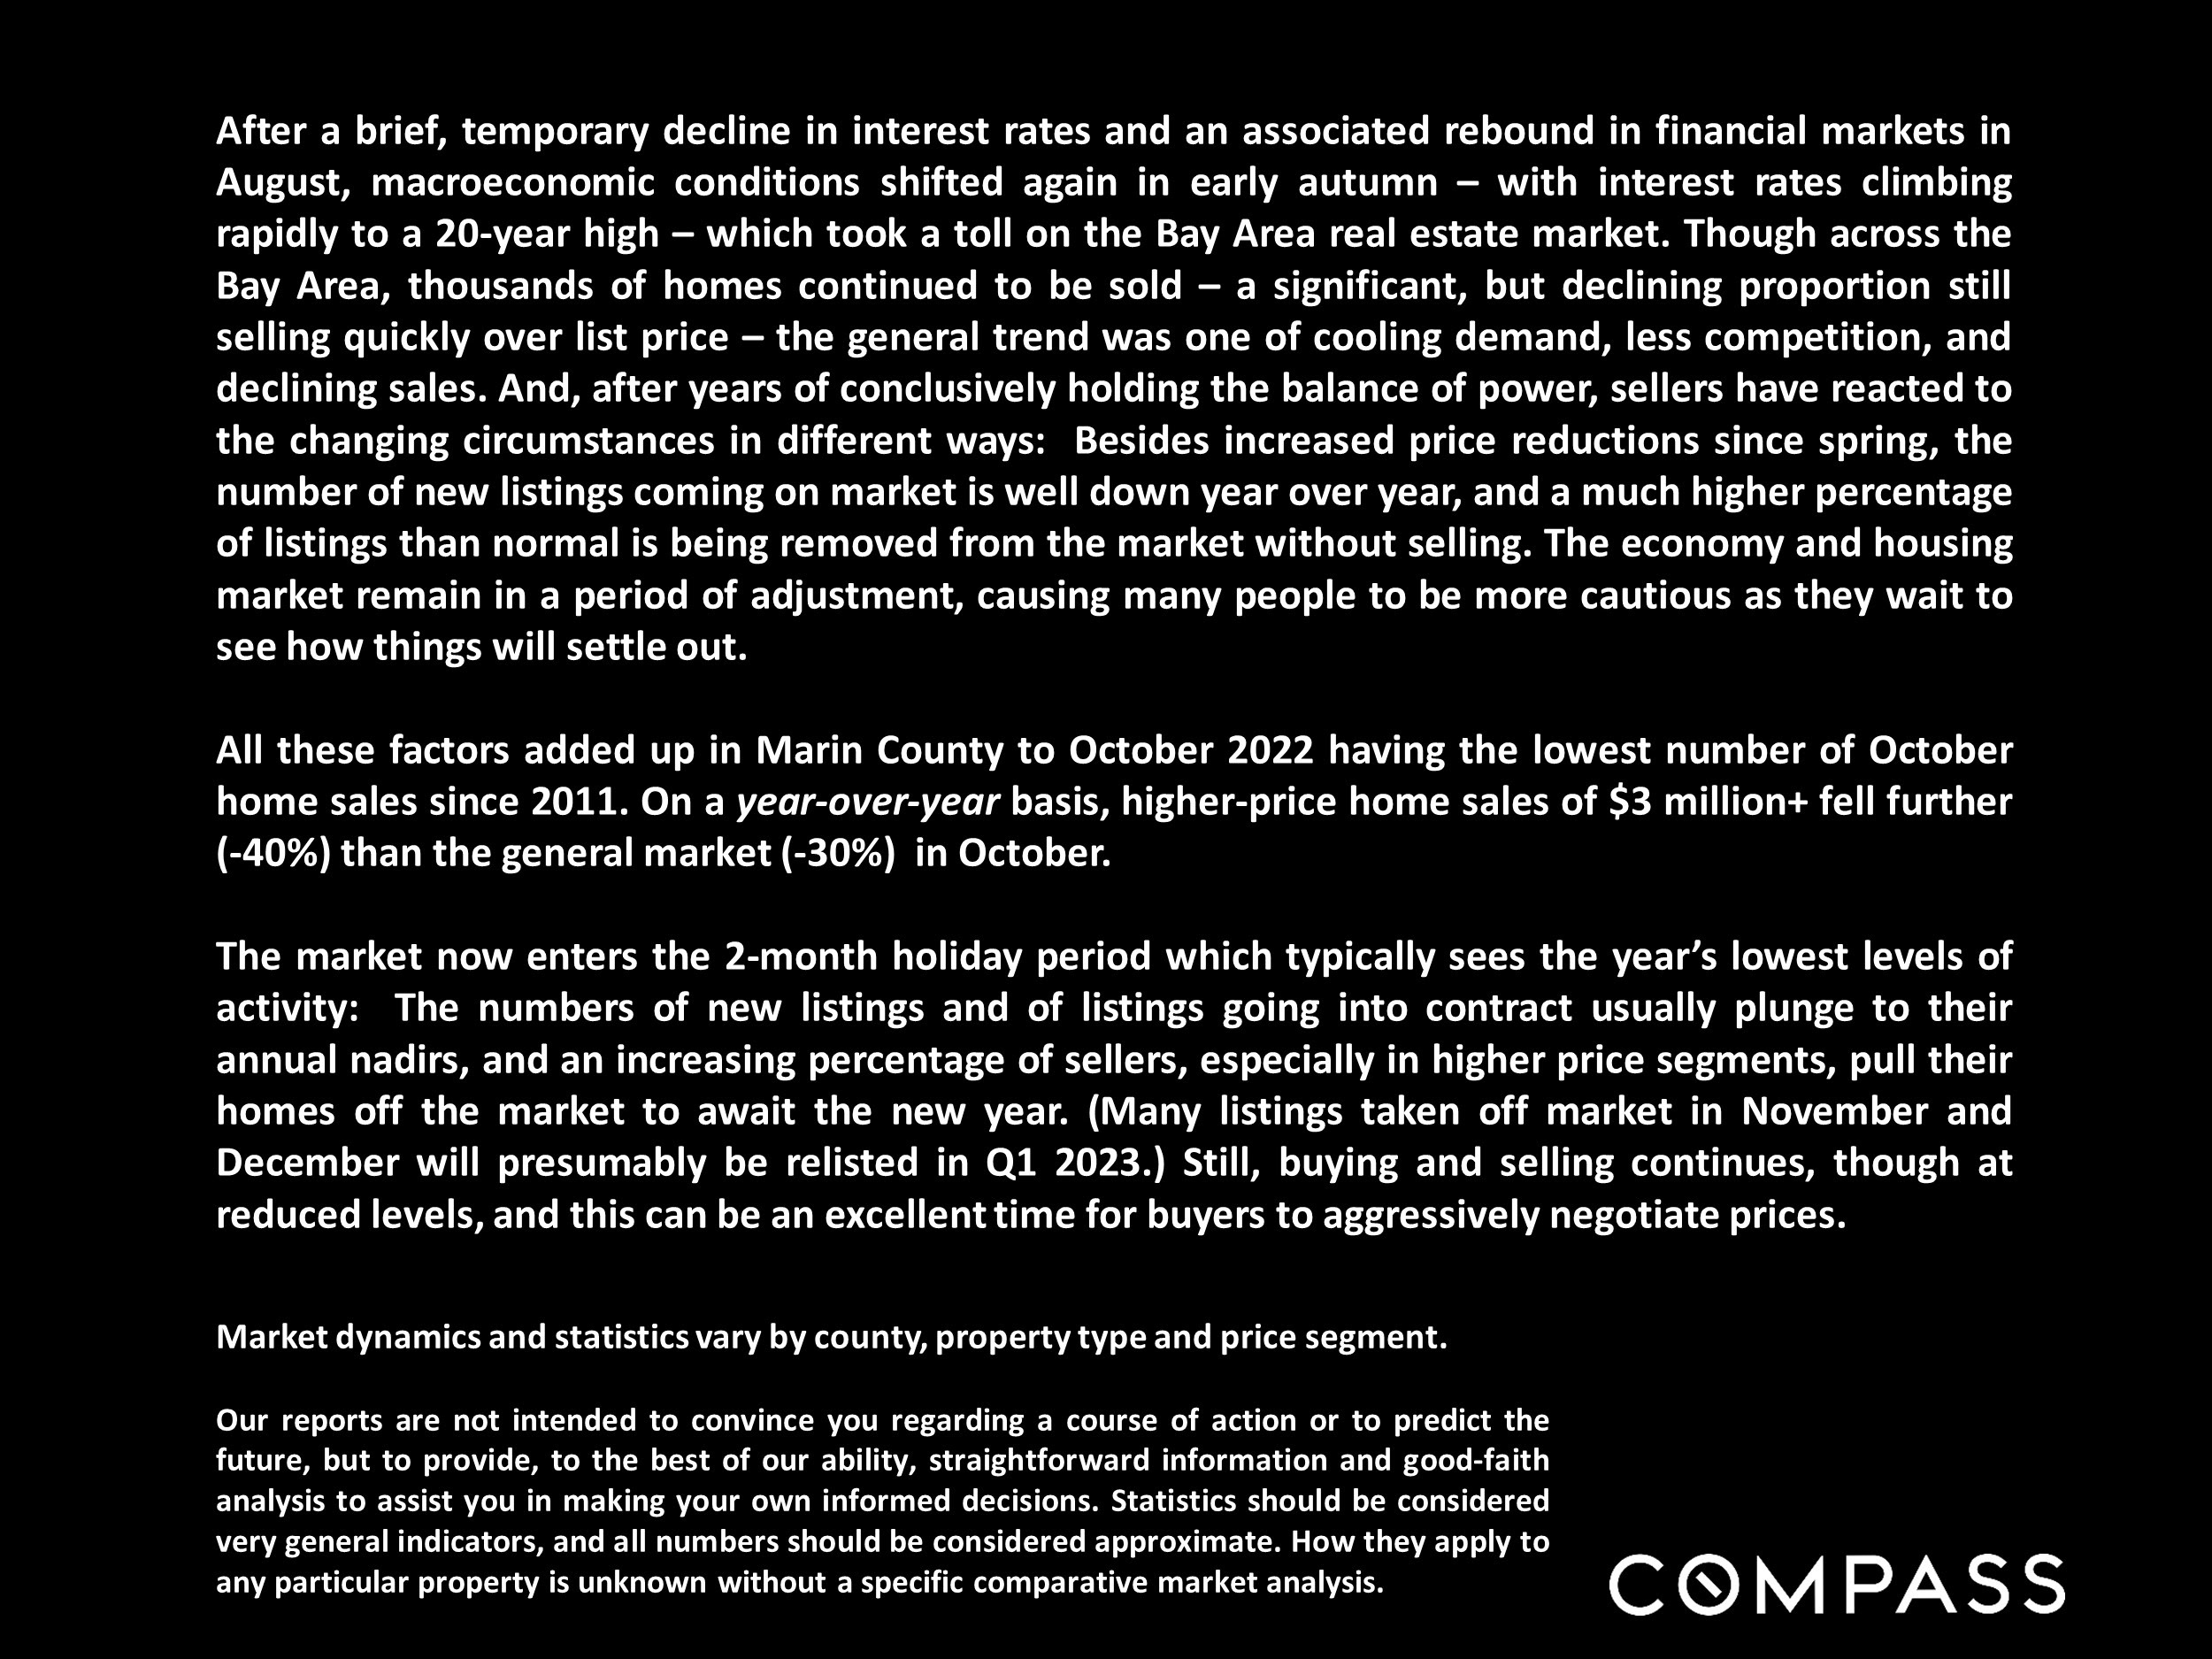
Marin County housing market report on October 2022 sales and trends, with Compass branding.
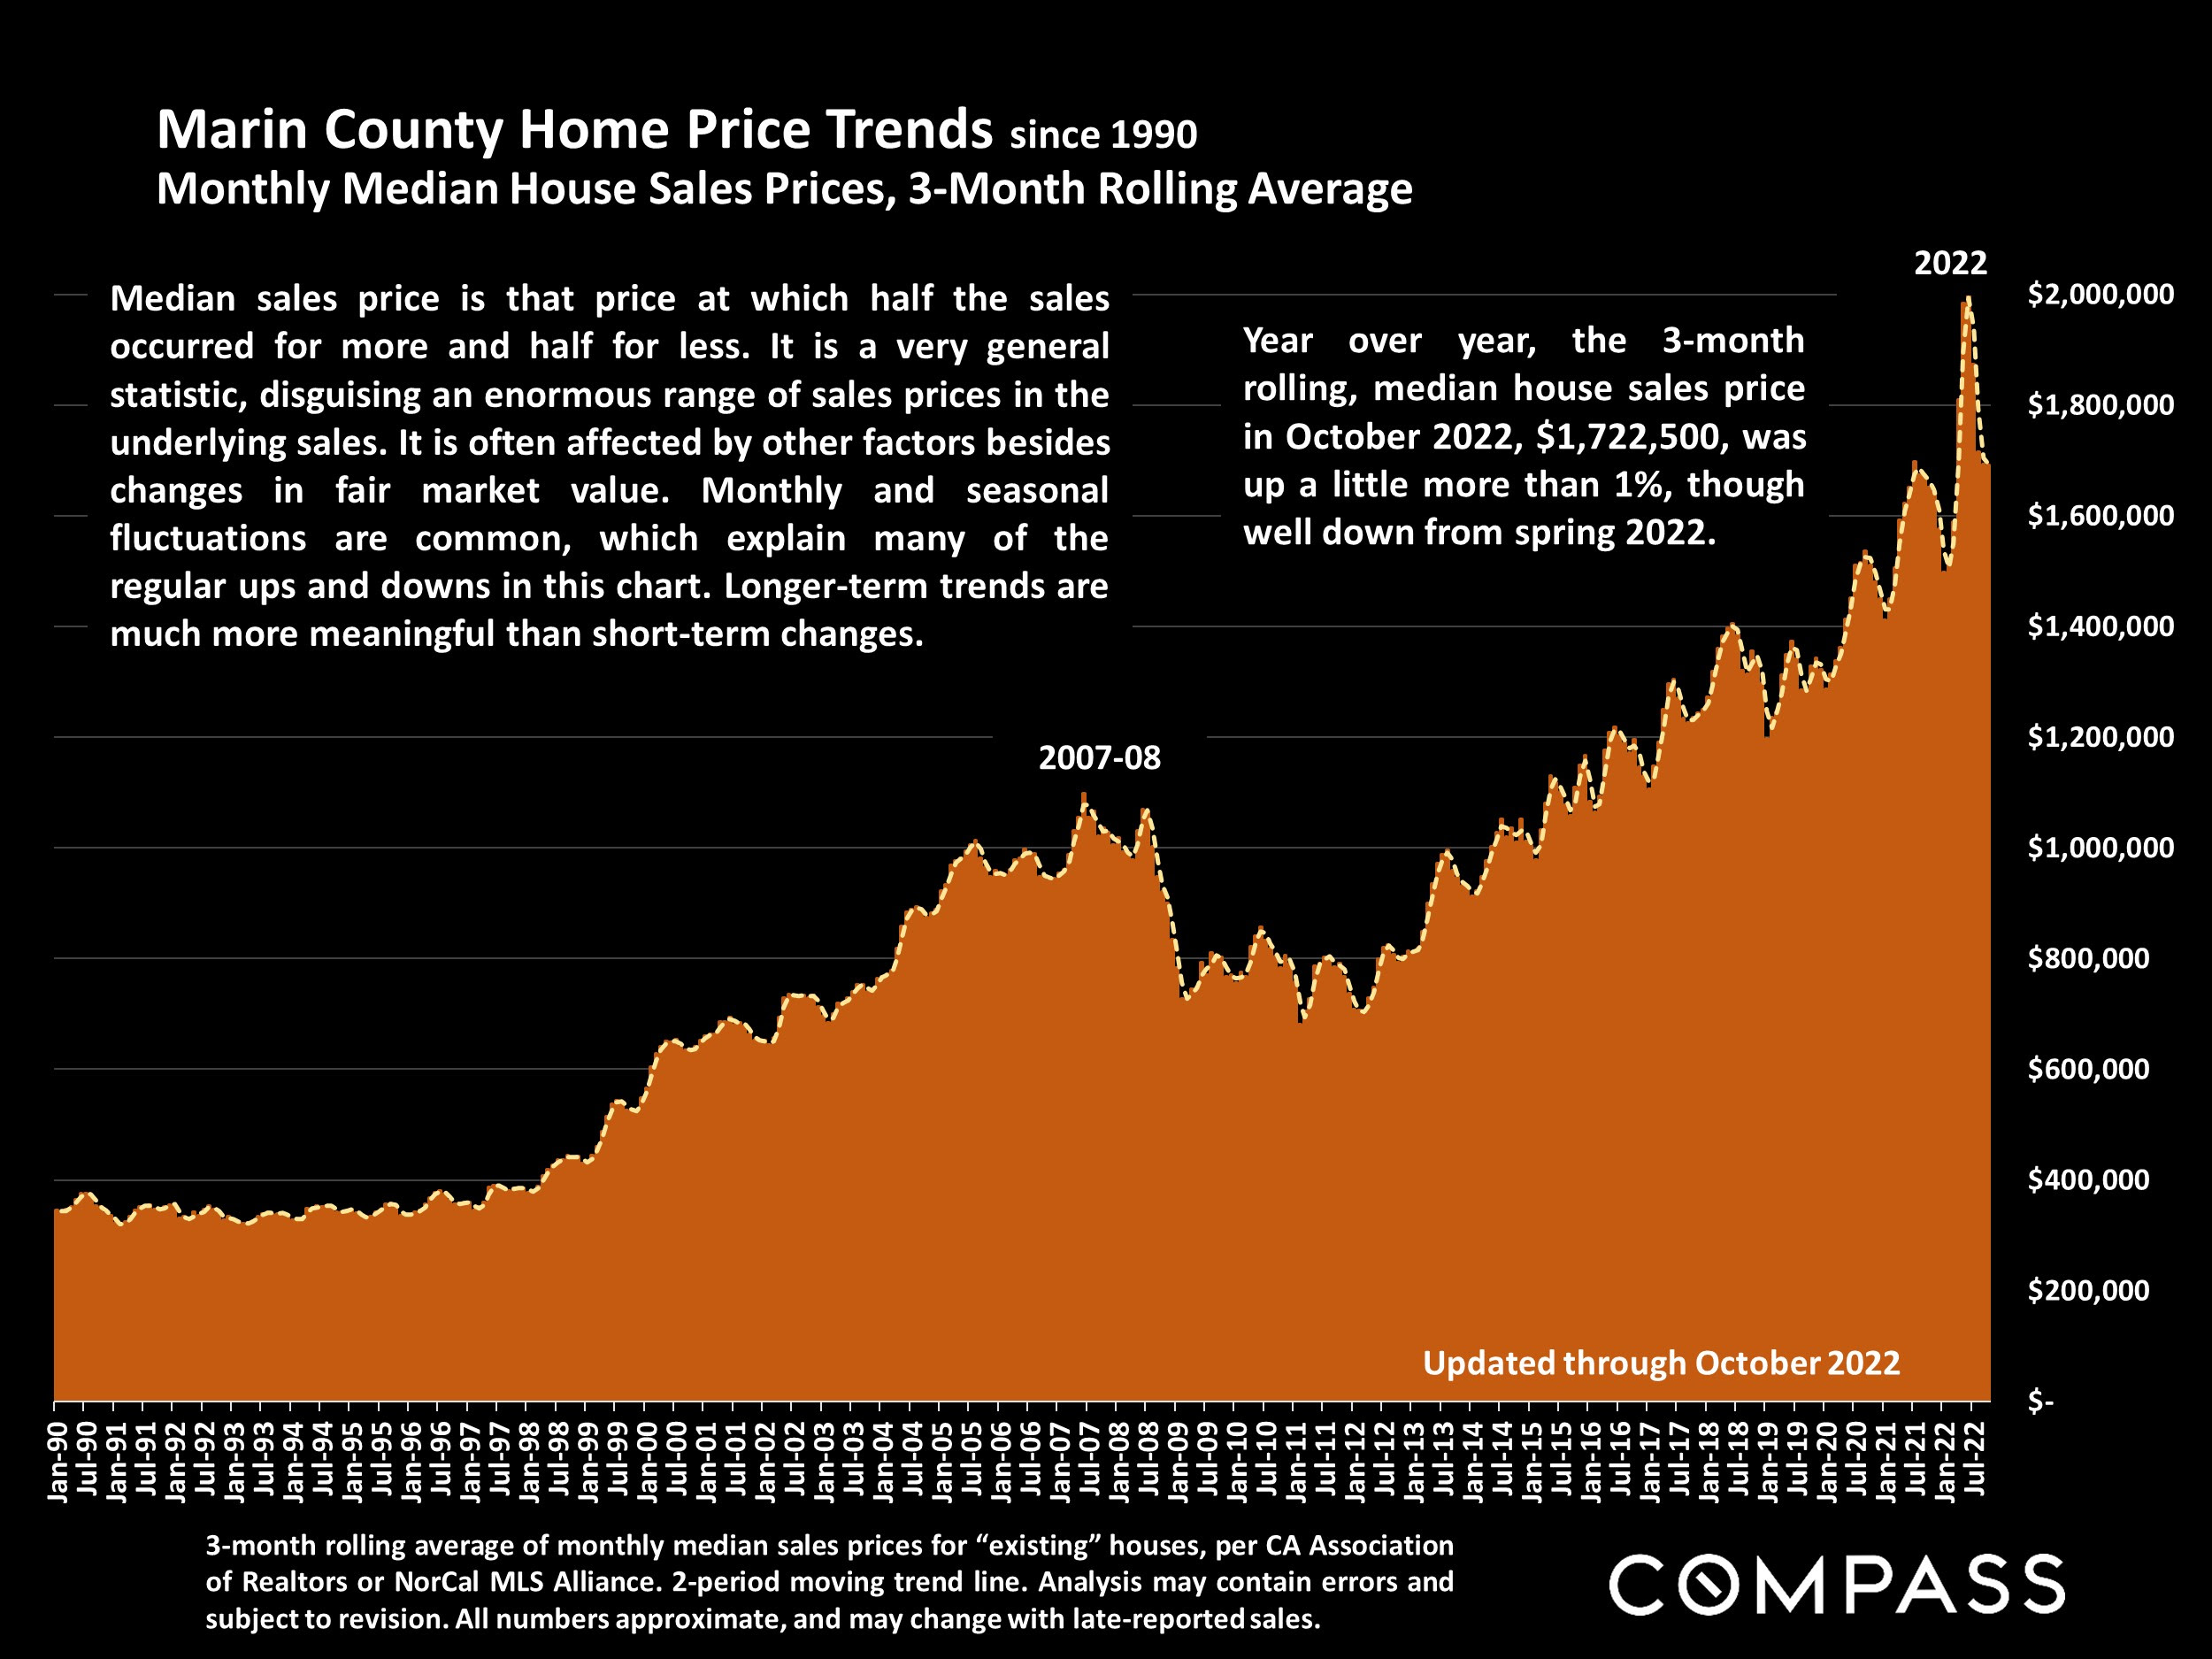
Marin County median home prices, 1990–October 2022, reaching $1.72 million.
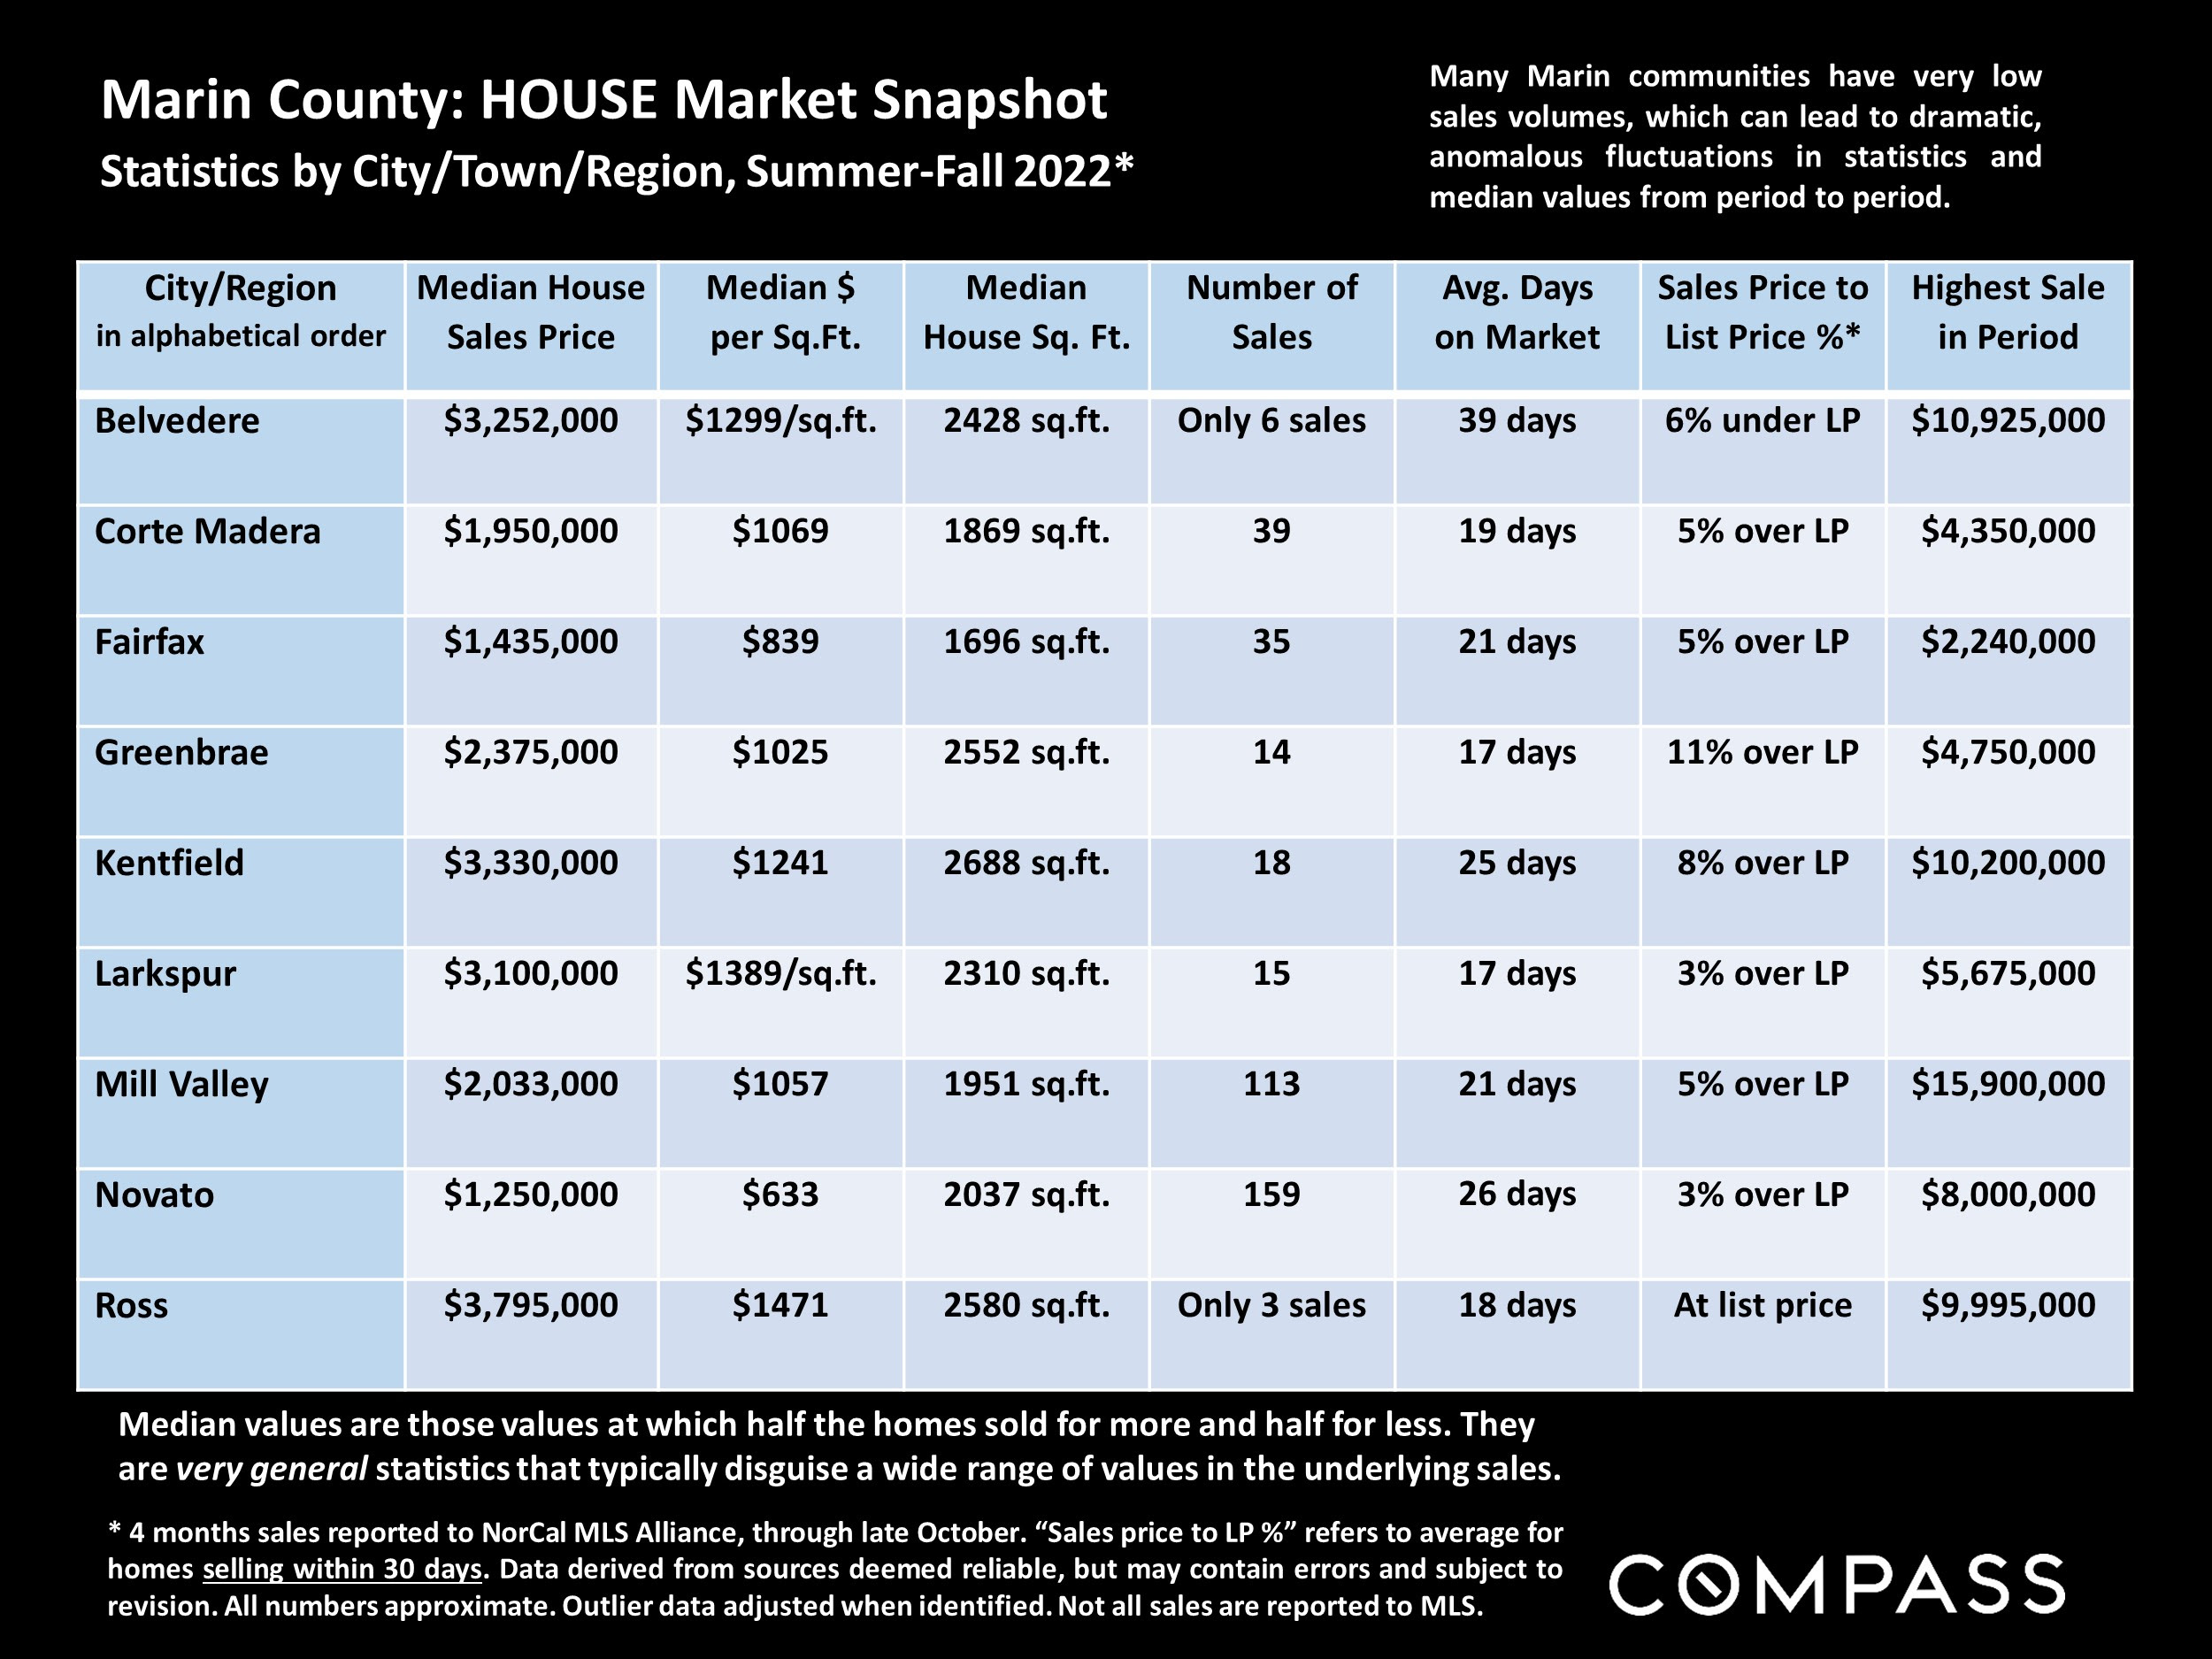
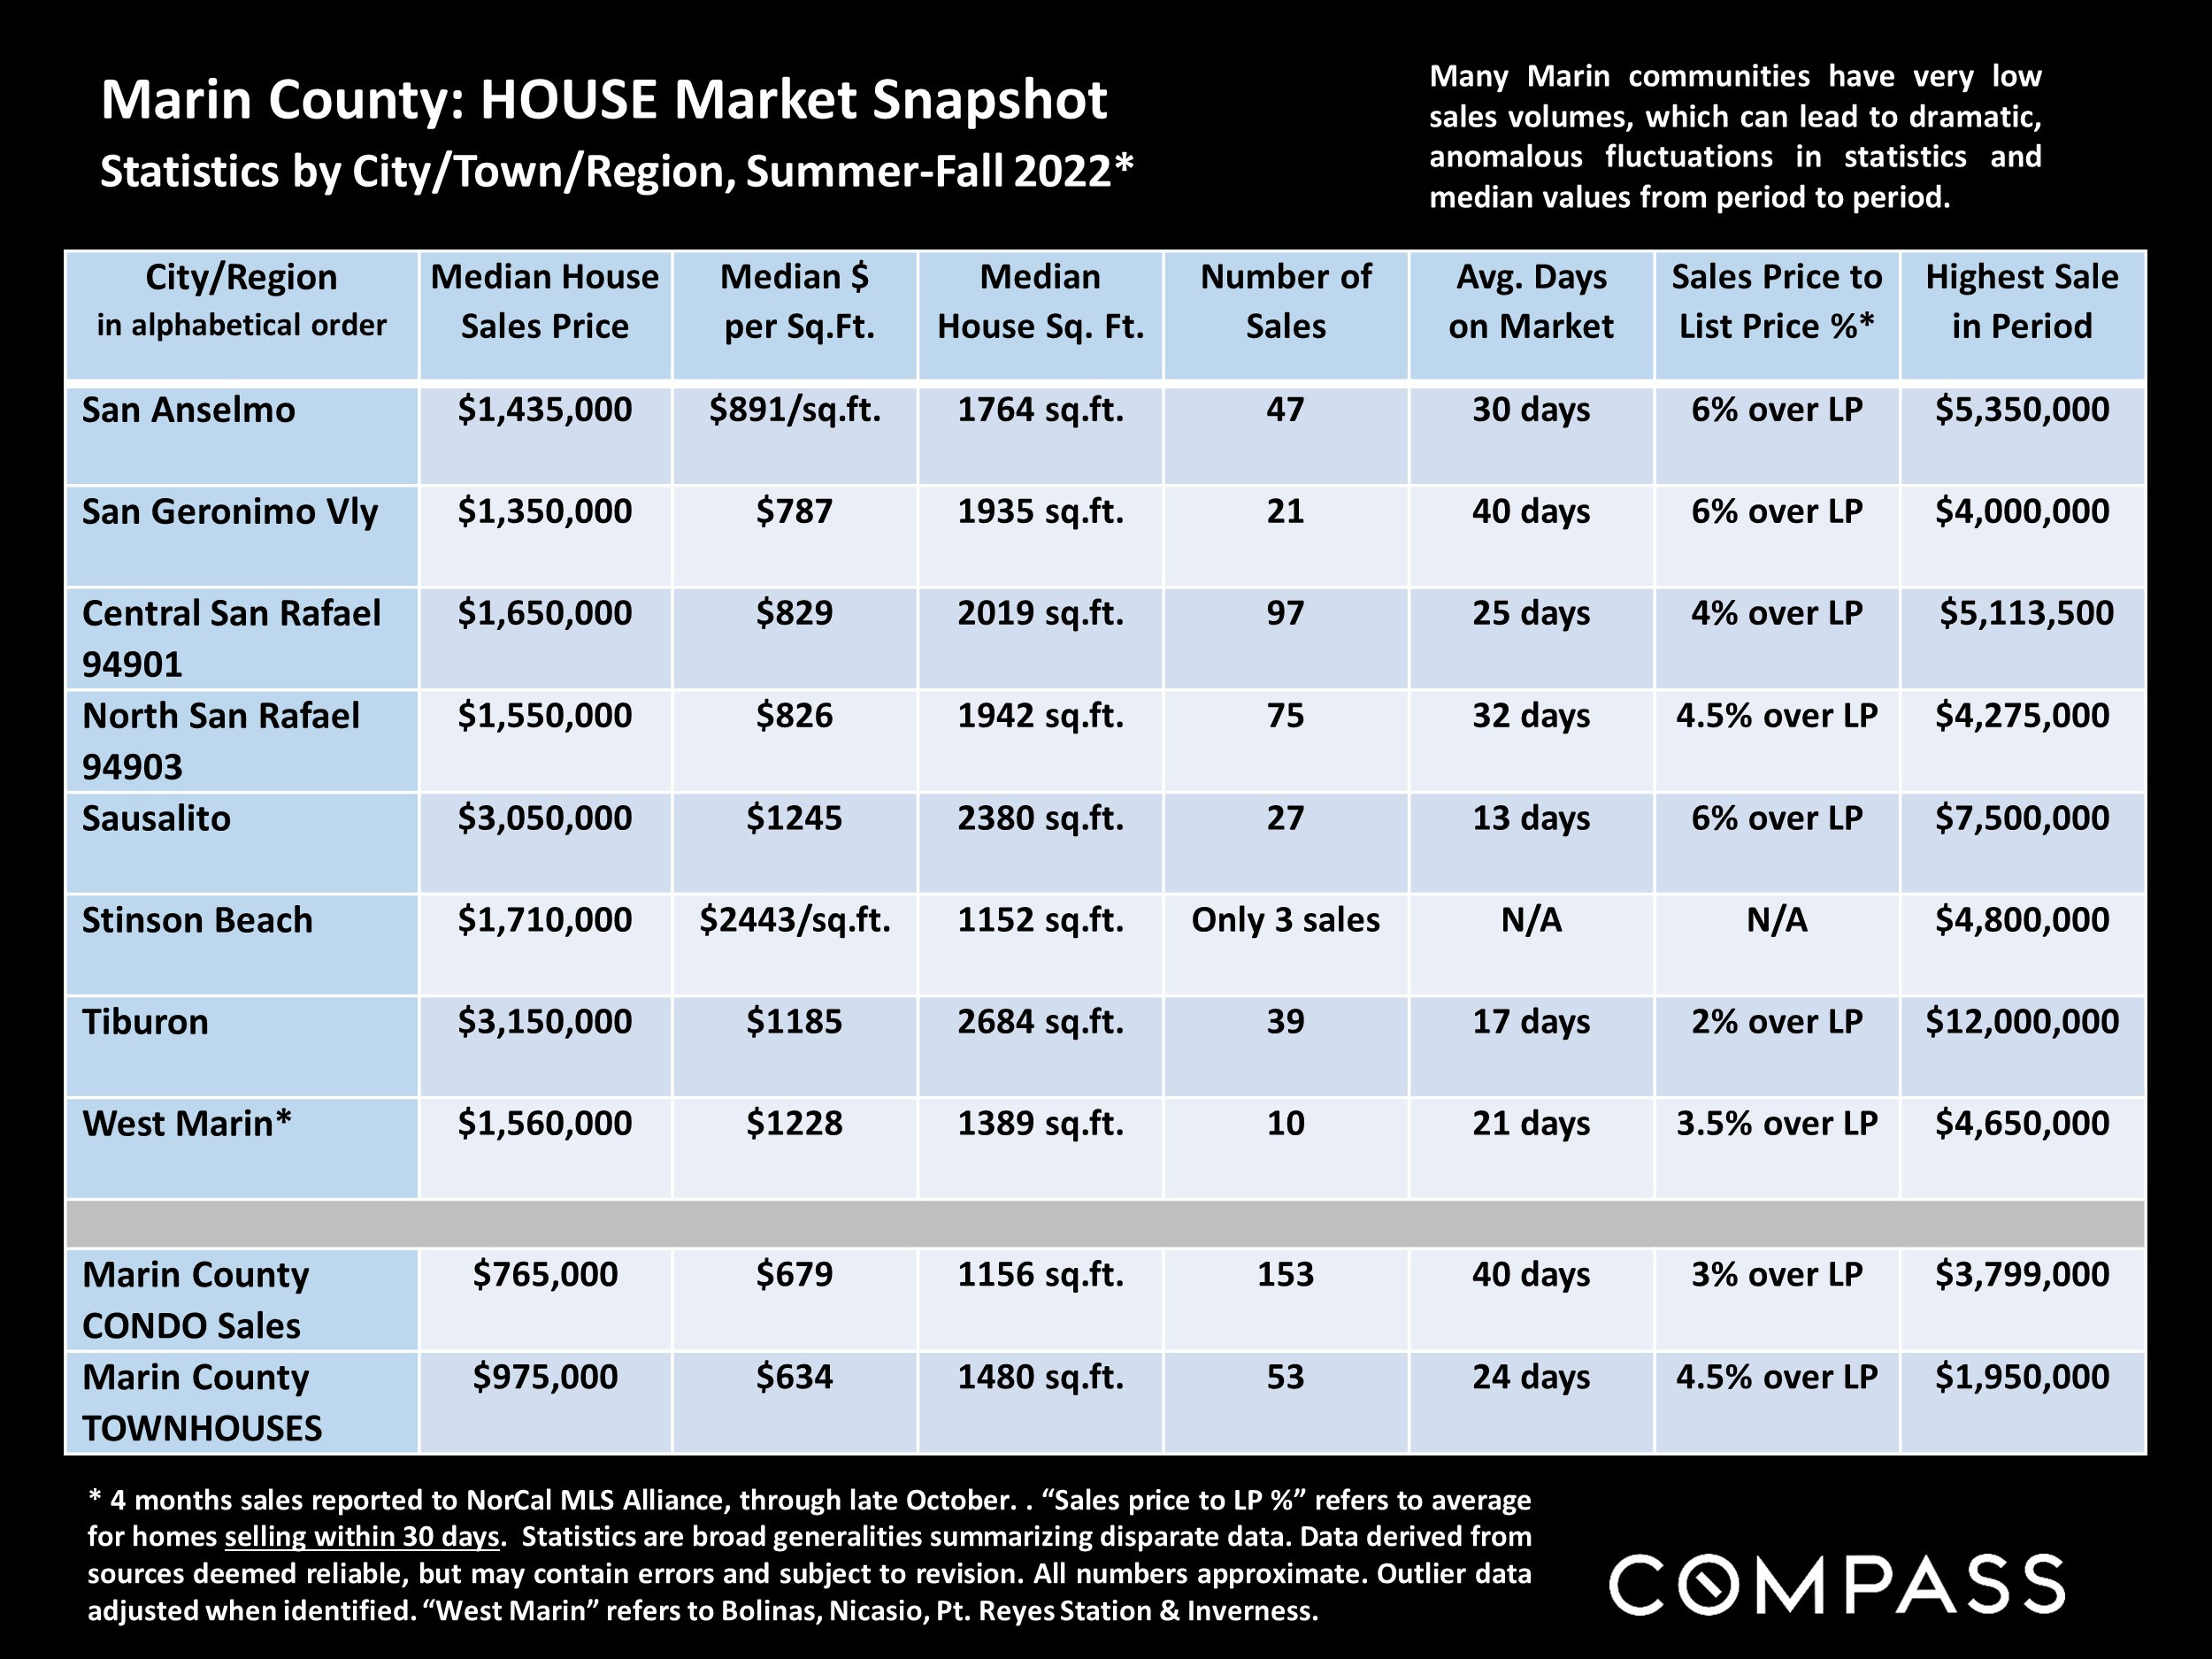
Marin County housing market snapshot table comparing Summer–Fall 2022 sales statistics across nine communities.
Marin County housing market snapshot table with summer–fall 2022 sales and pricing statistics by area.
 
Bright dining room opening to a terrace with hillside and water views
4 Bed | 5 Bath | 5,715 SF | Offered at $5,675,000
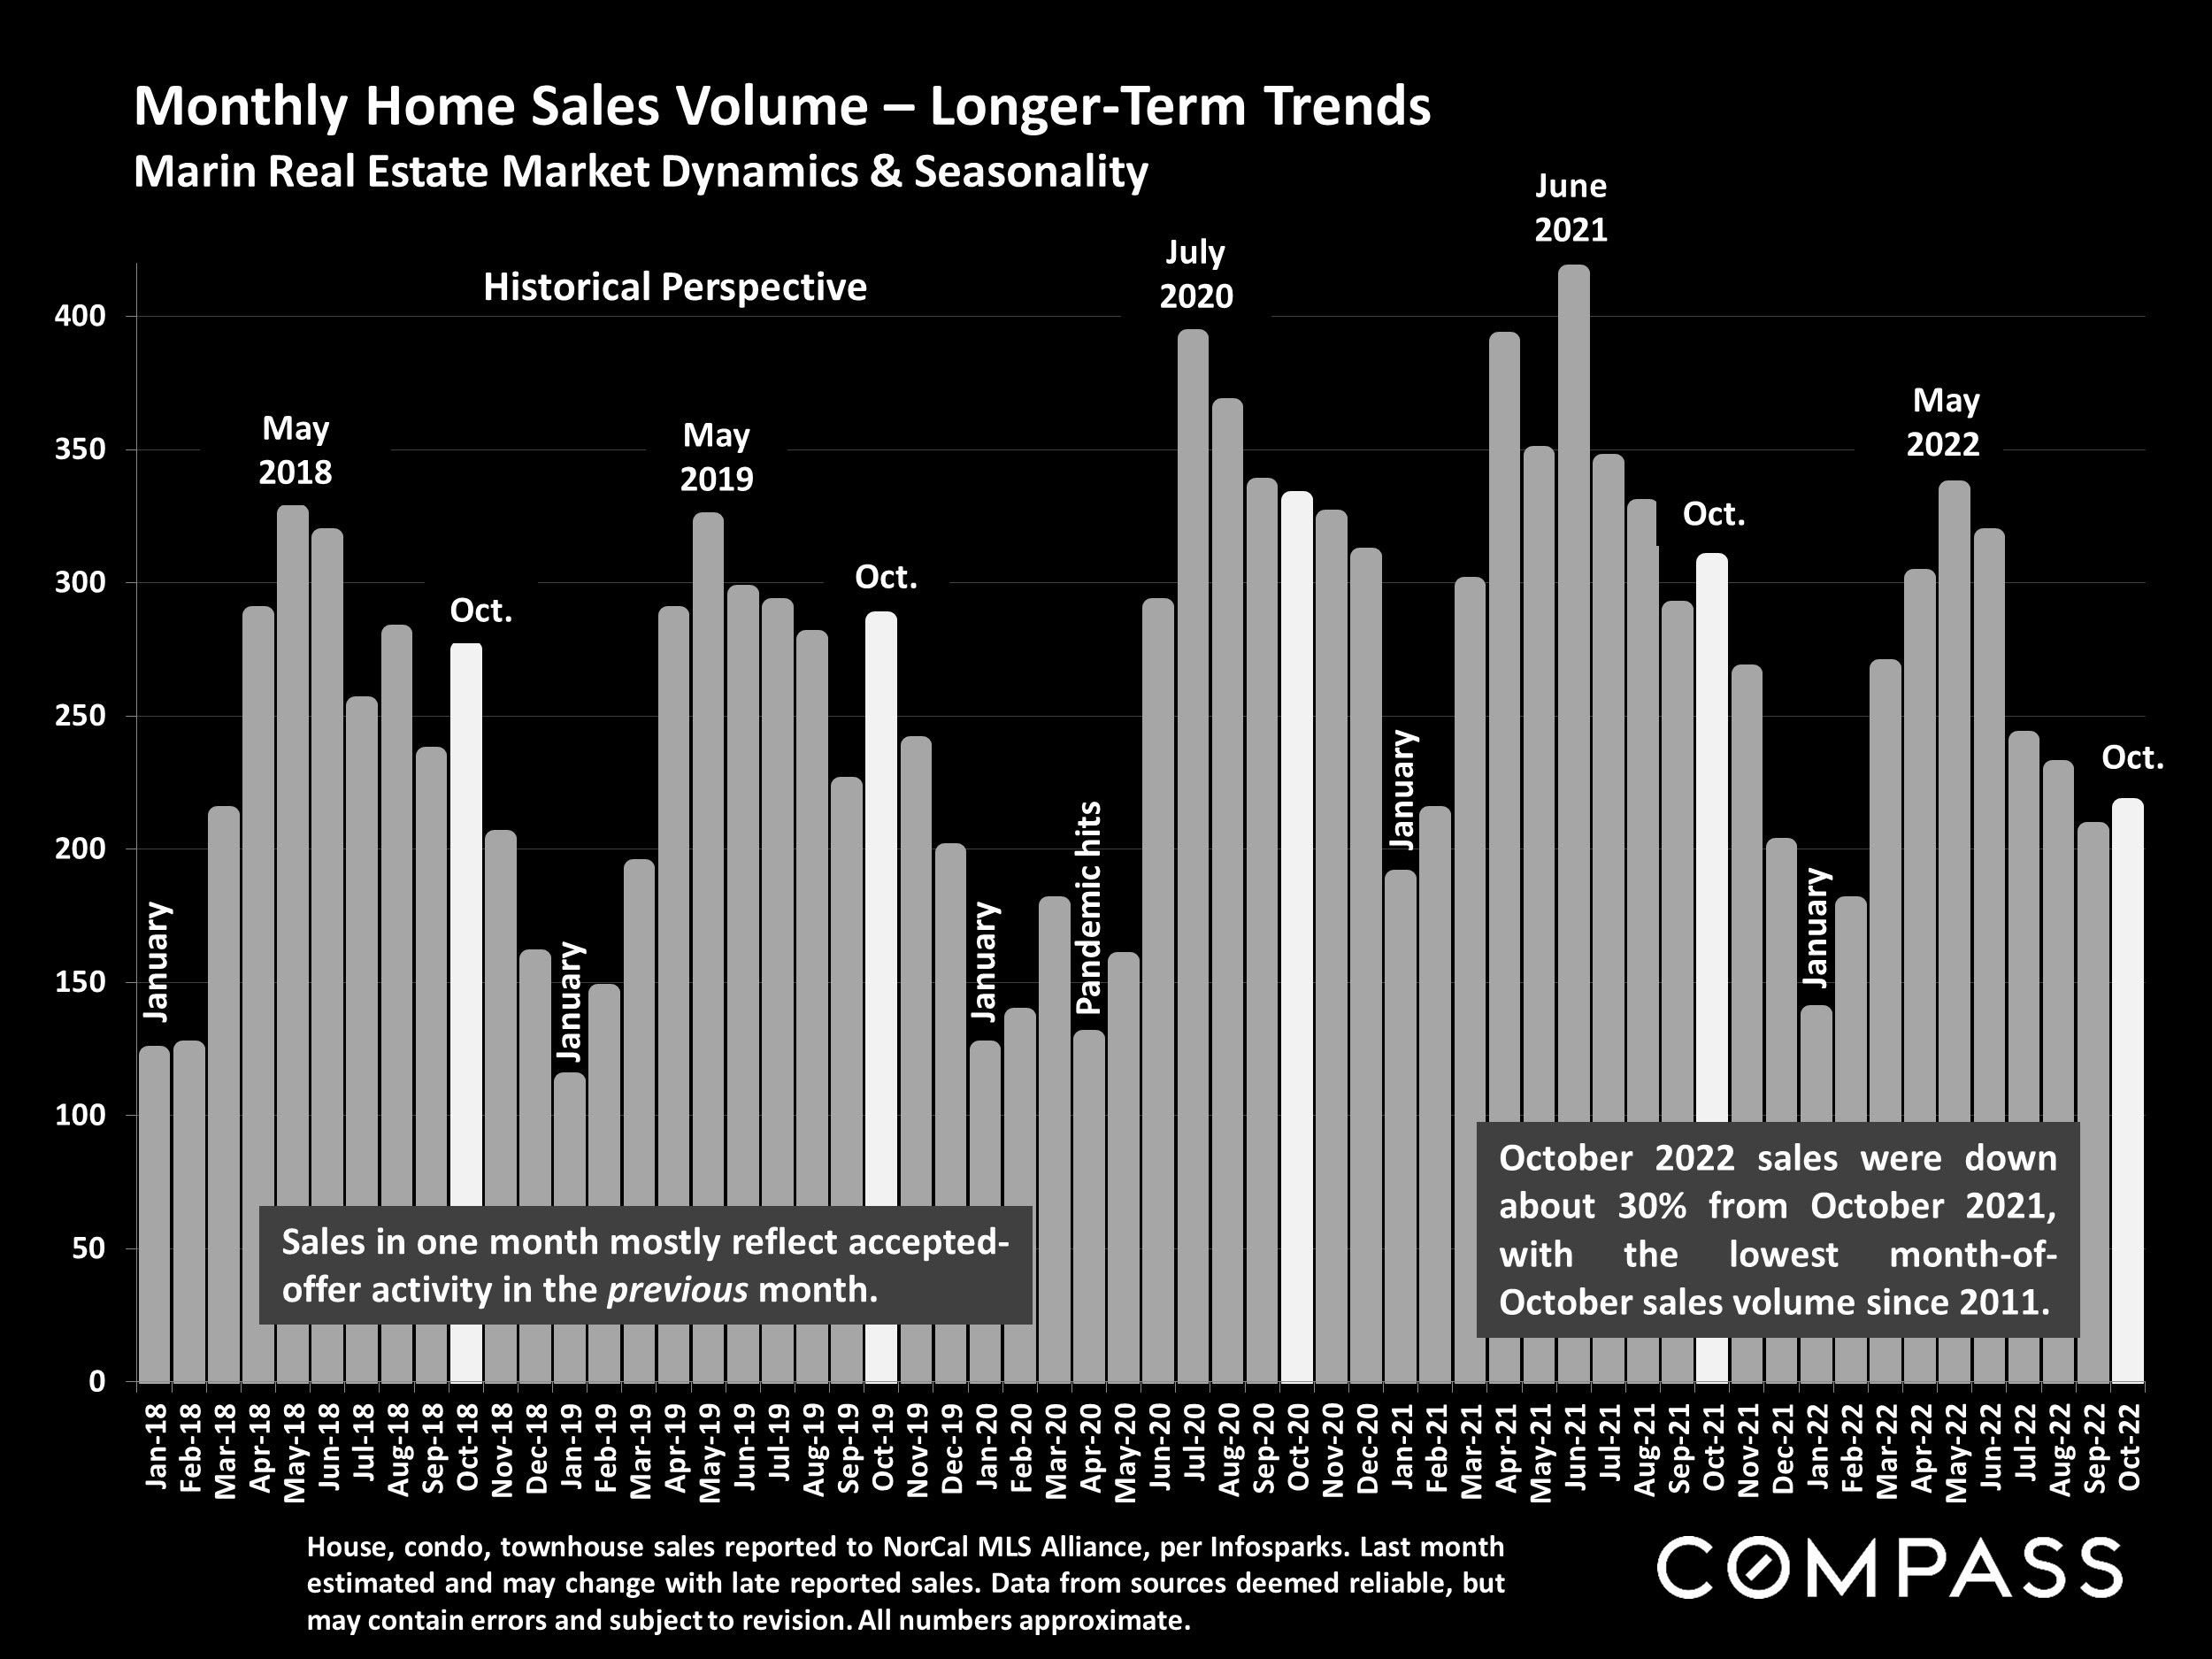
Bar chart of monthly Marin County home sales, January 2018–October 2022, showing October 2022 down 30% year over year.
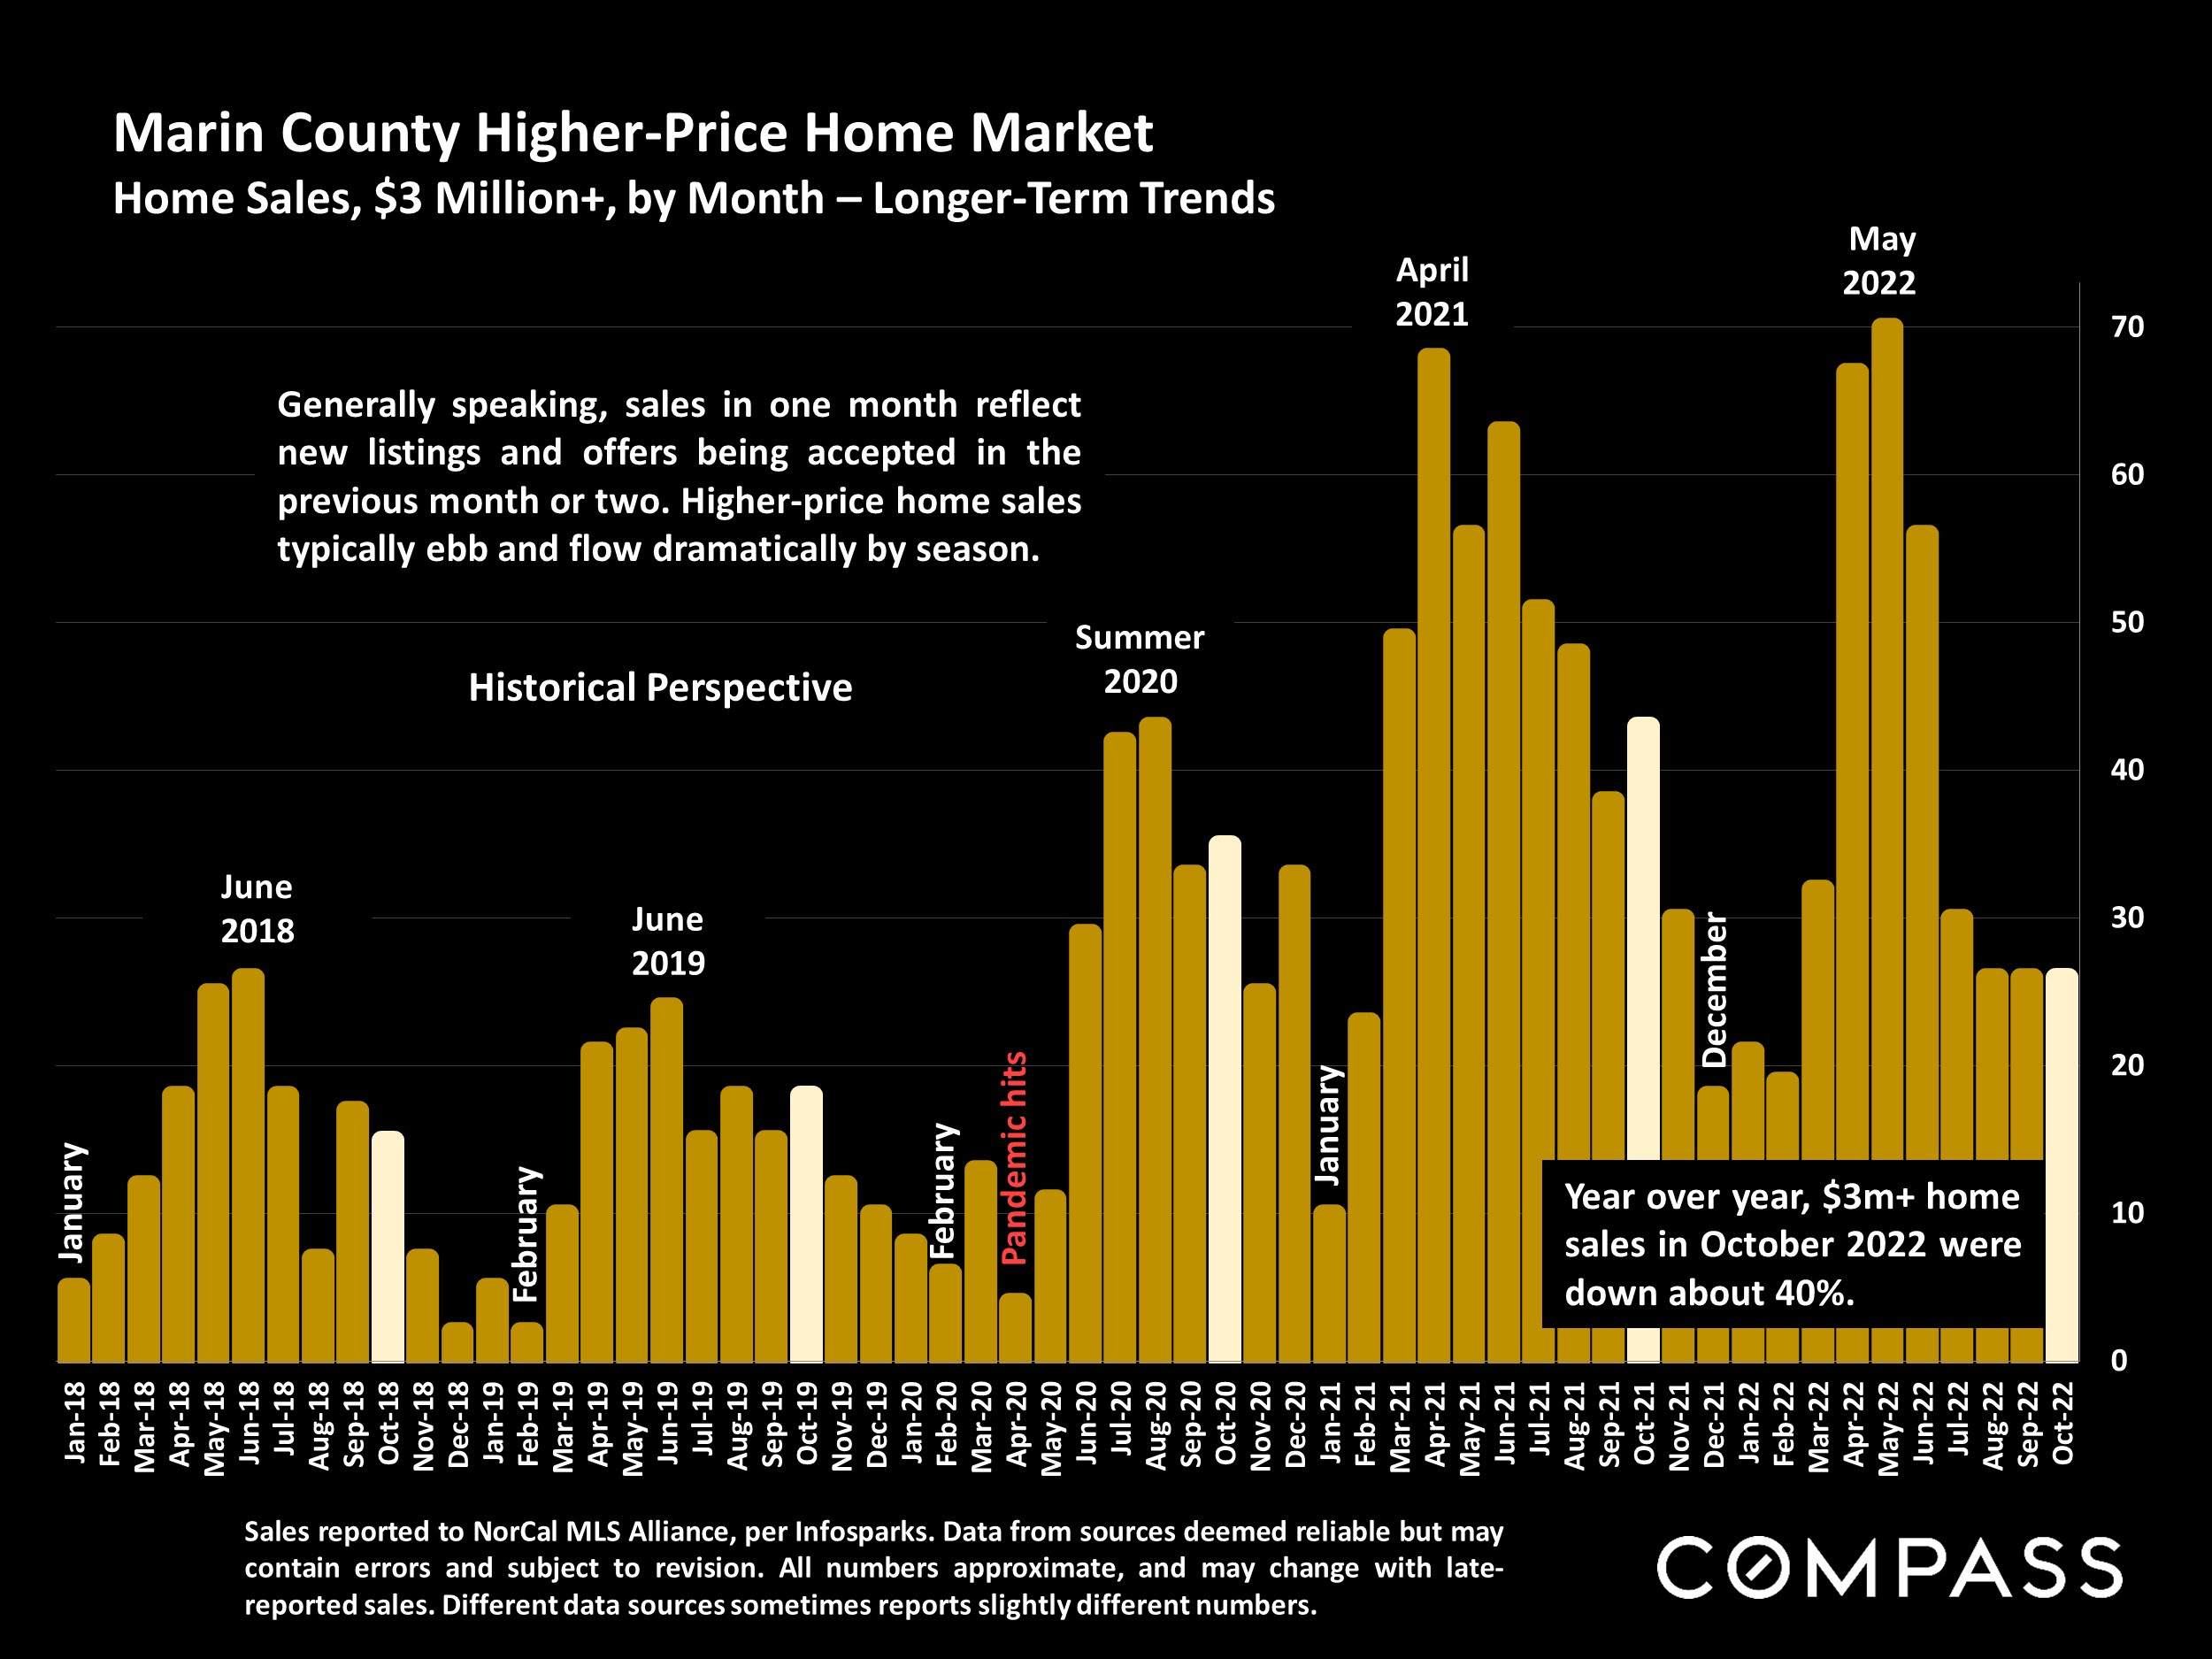
Bar chart of monthly Marin County home sales over $3 million, January 2018 to October 2022.
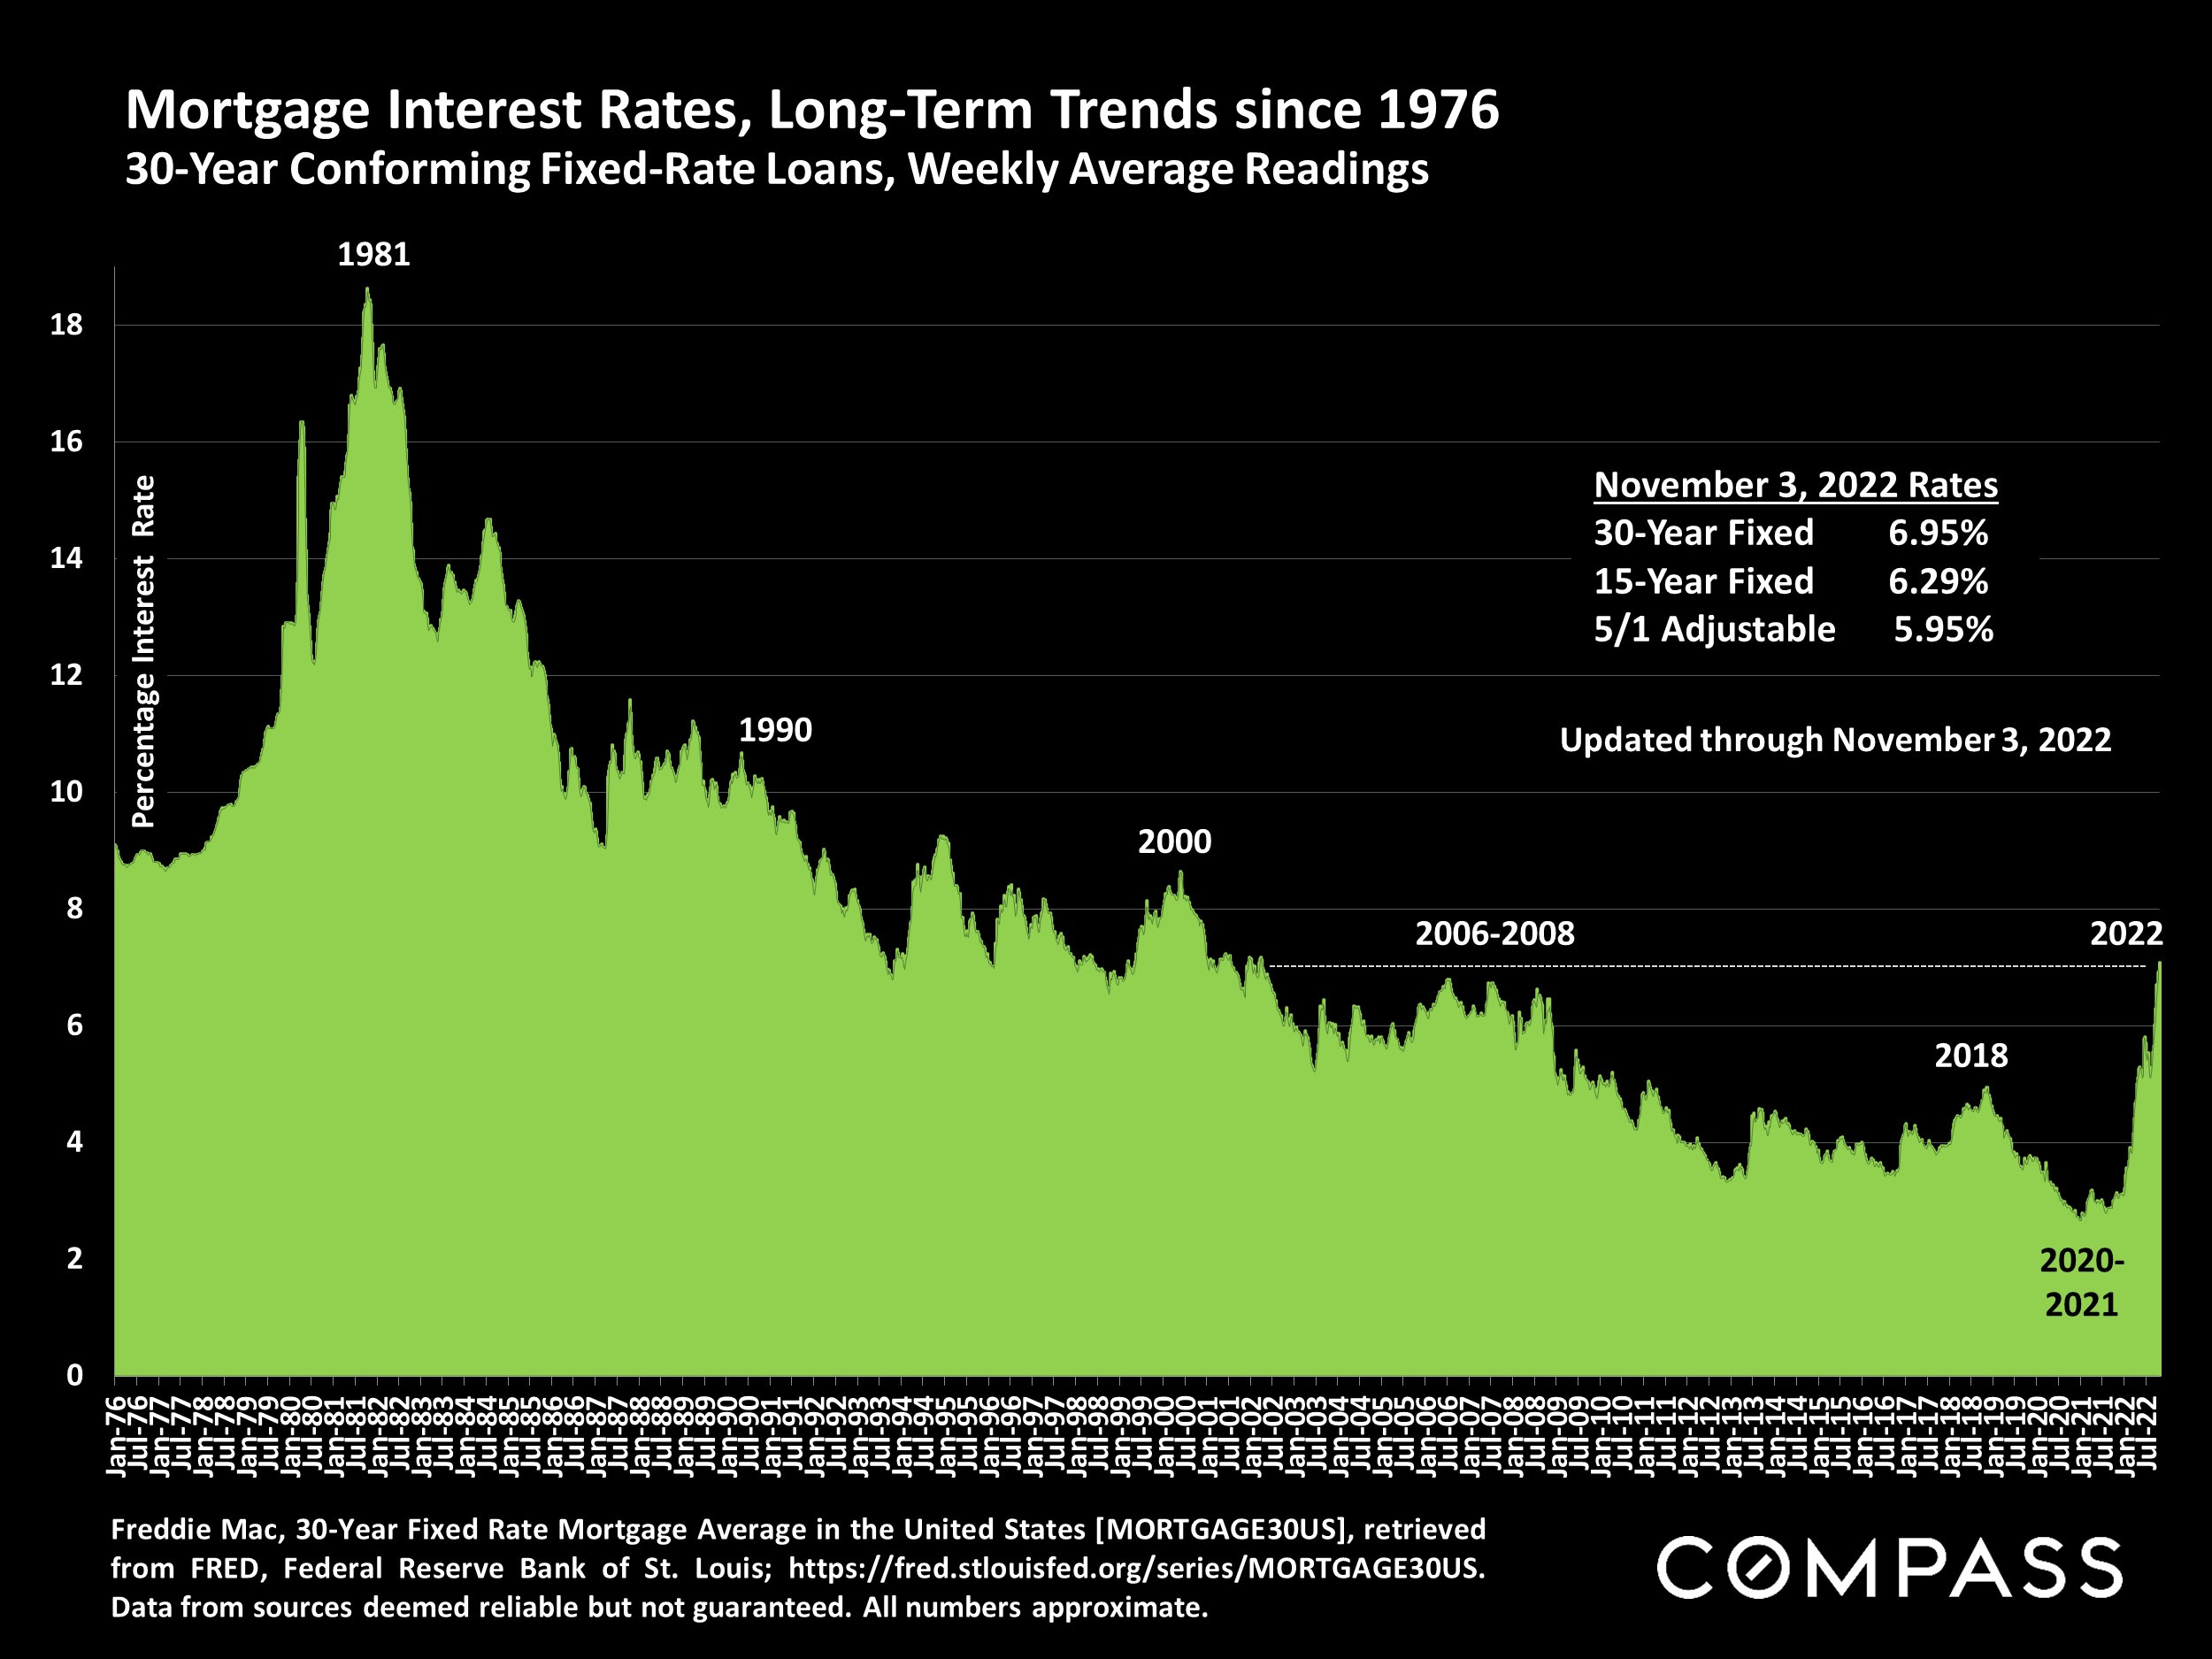
Chart of U.S. mortgage rates from 1976 to 2022, peaking above 18% in 1981 before rising sharply in 2022.
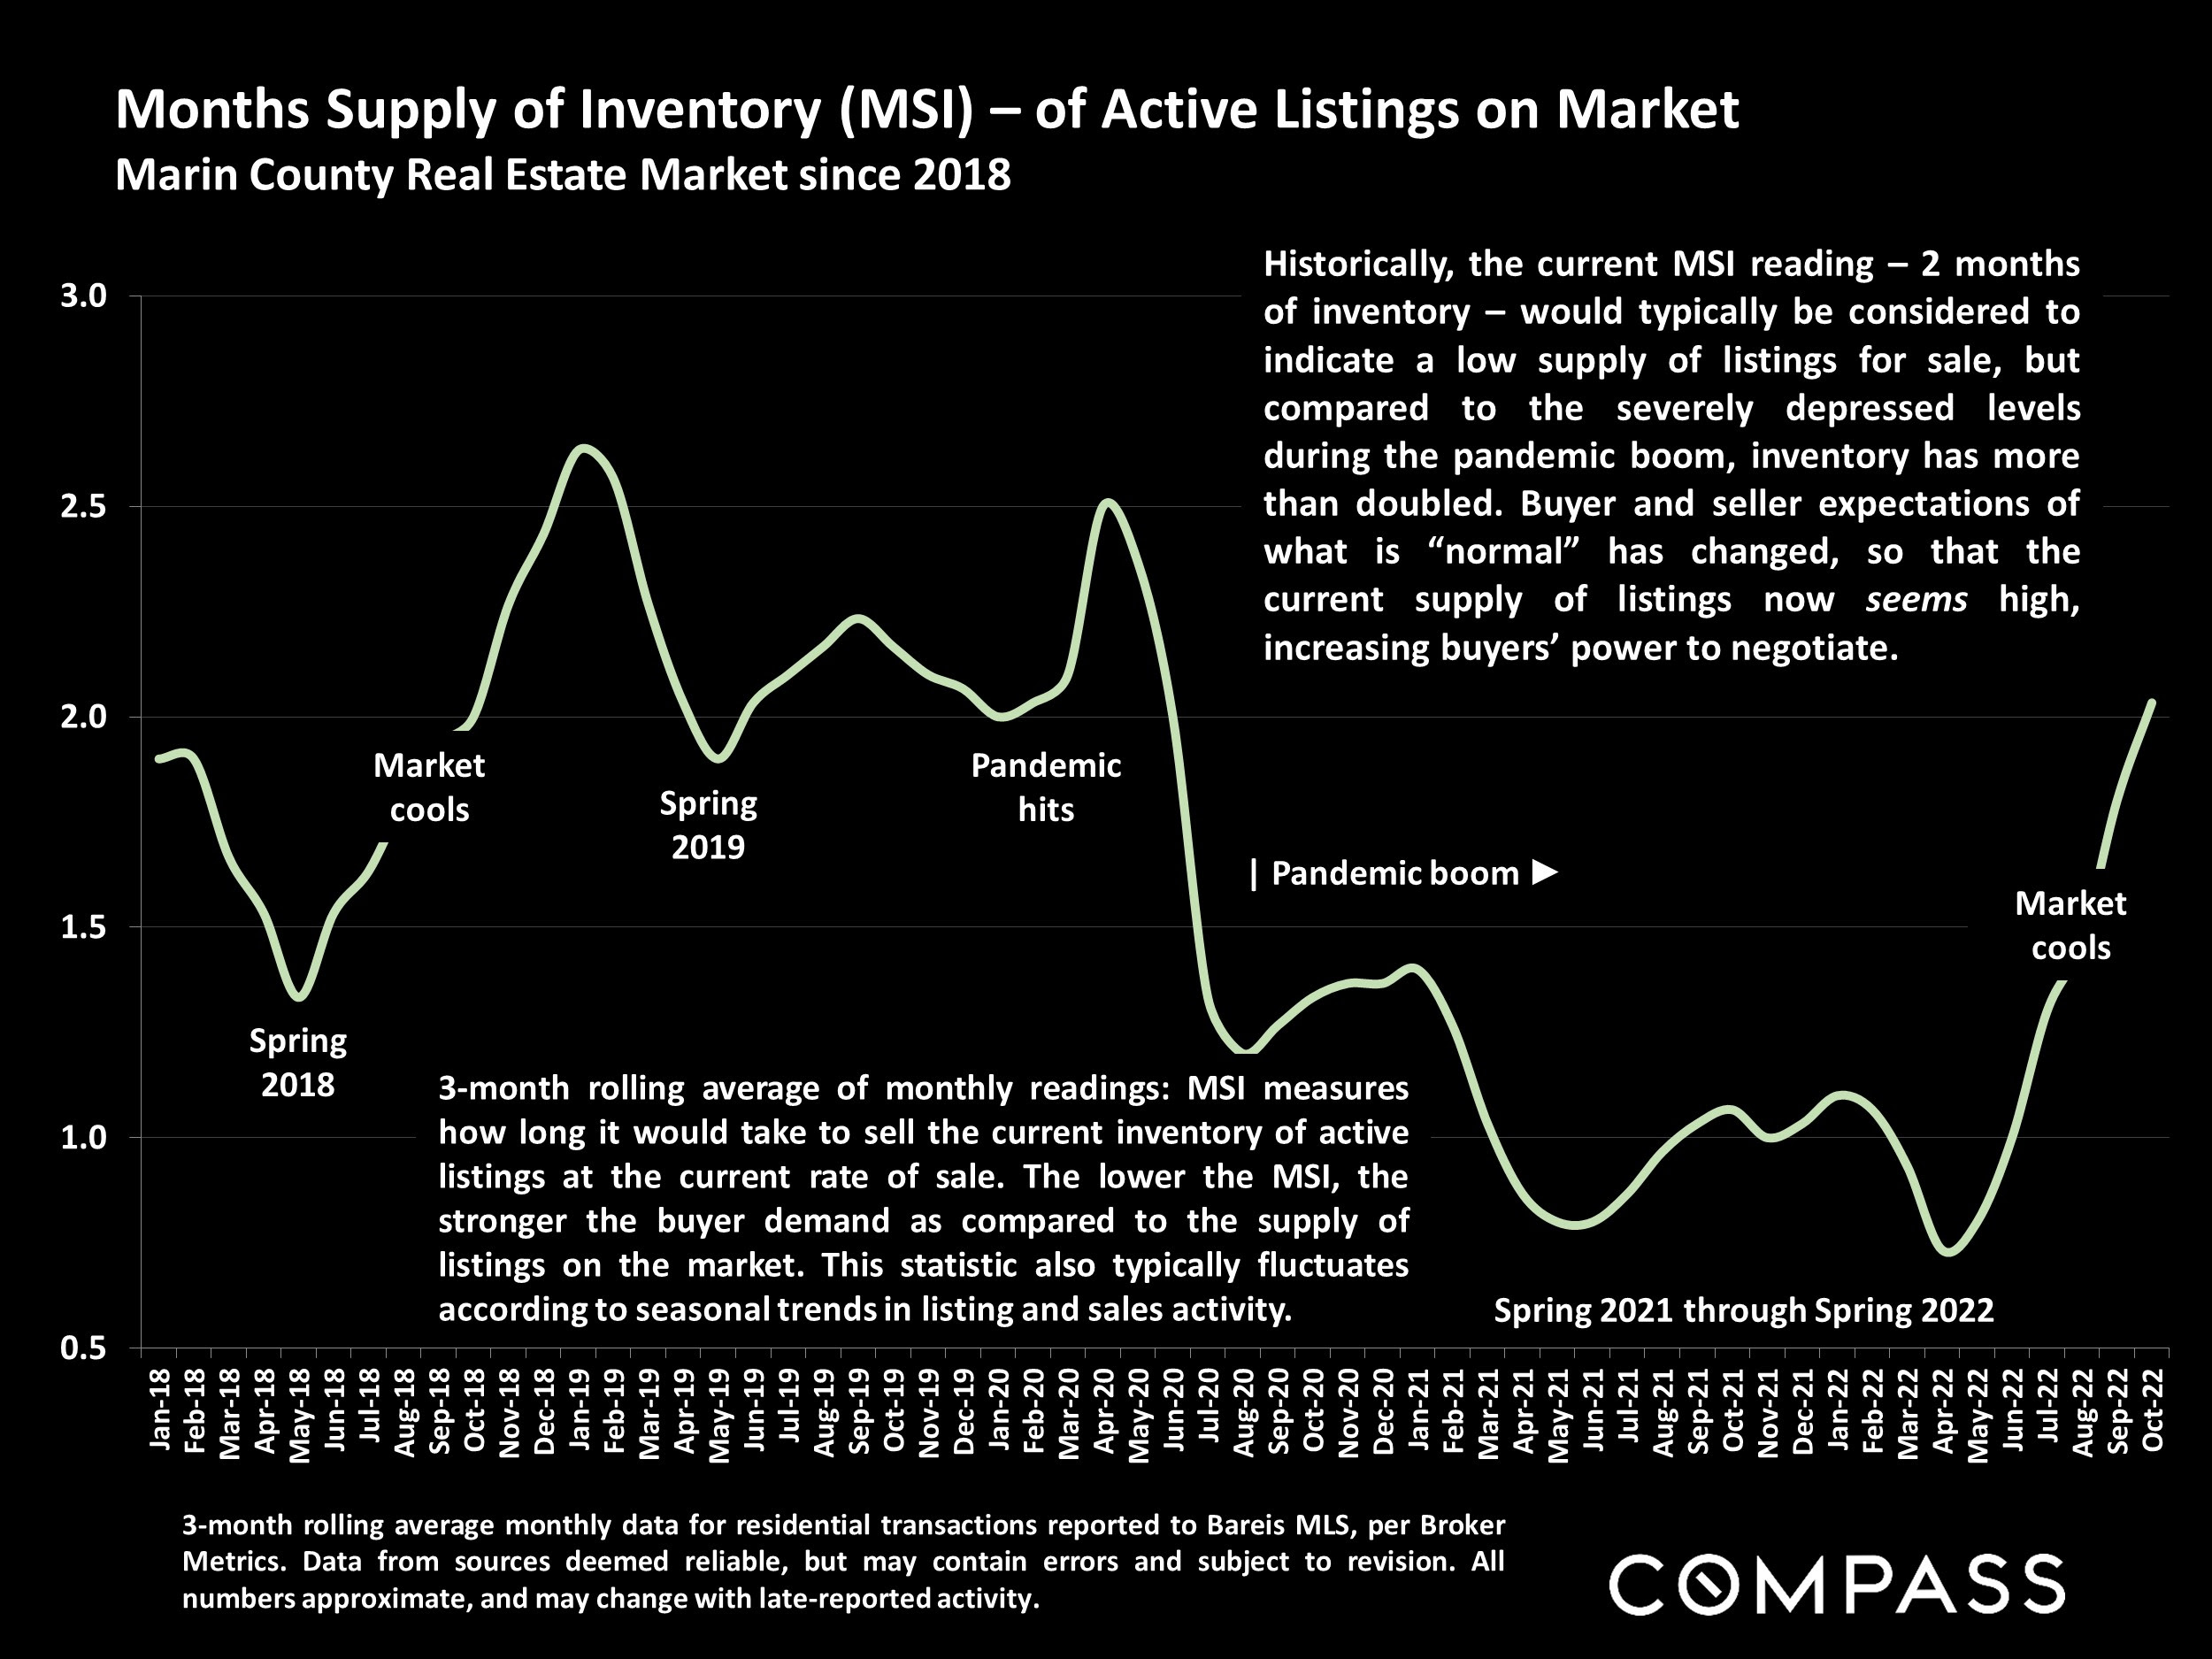
Chart of Marin County months of inventory from 2018 to 2022, showing a sharp pandemic-era drop and recent rise.
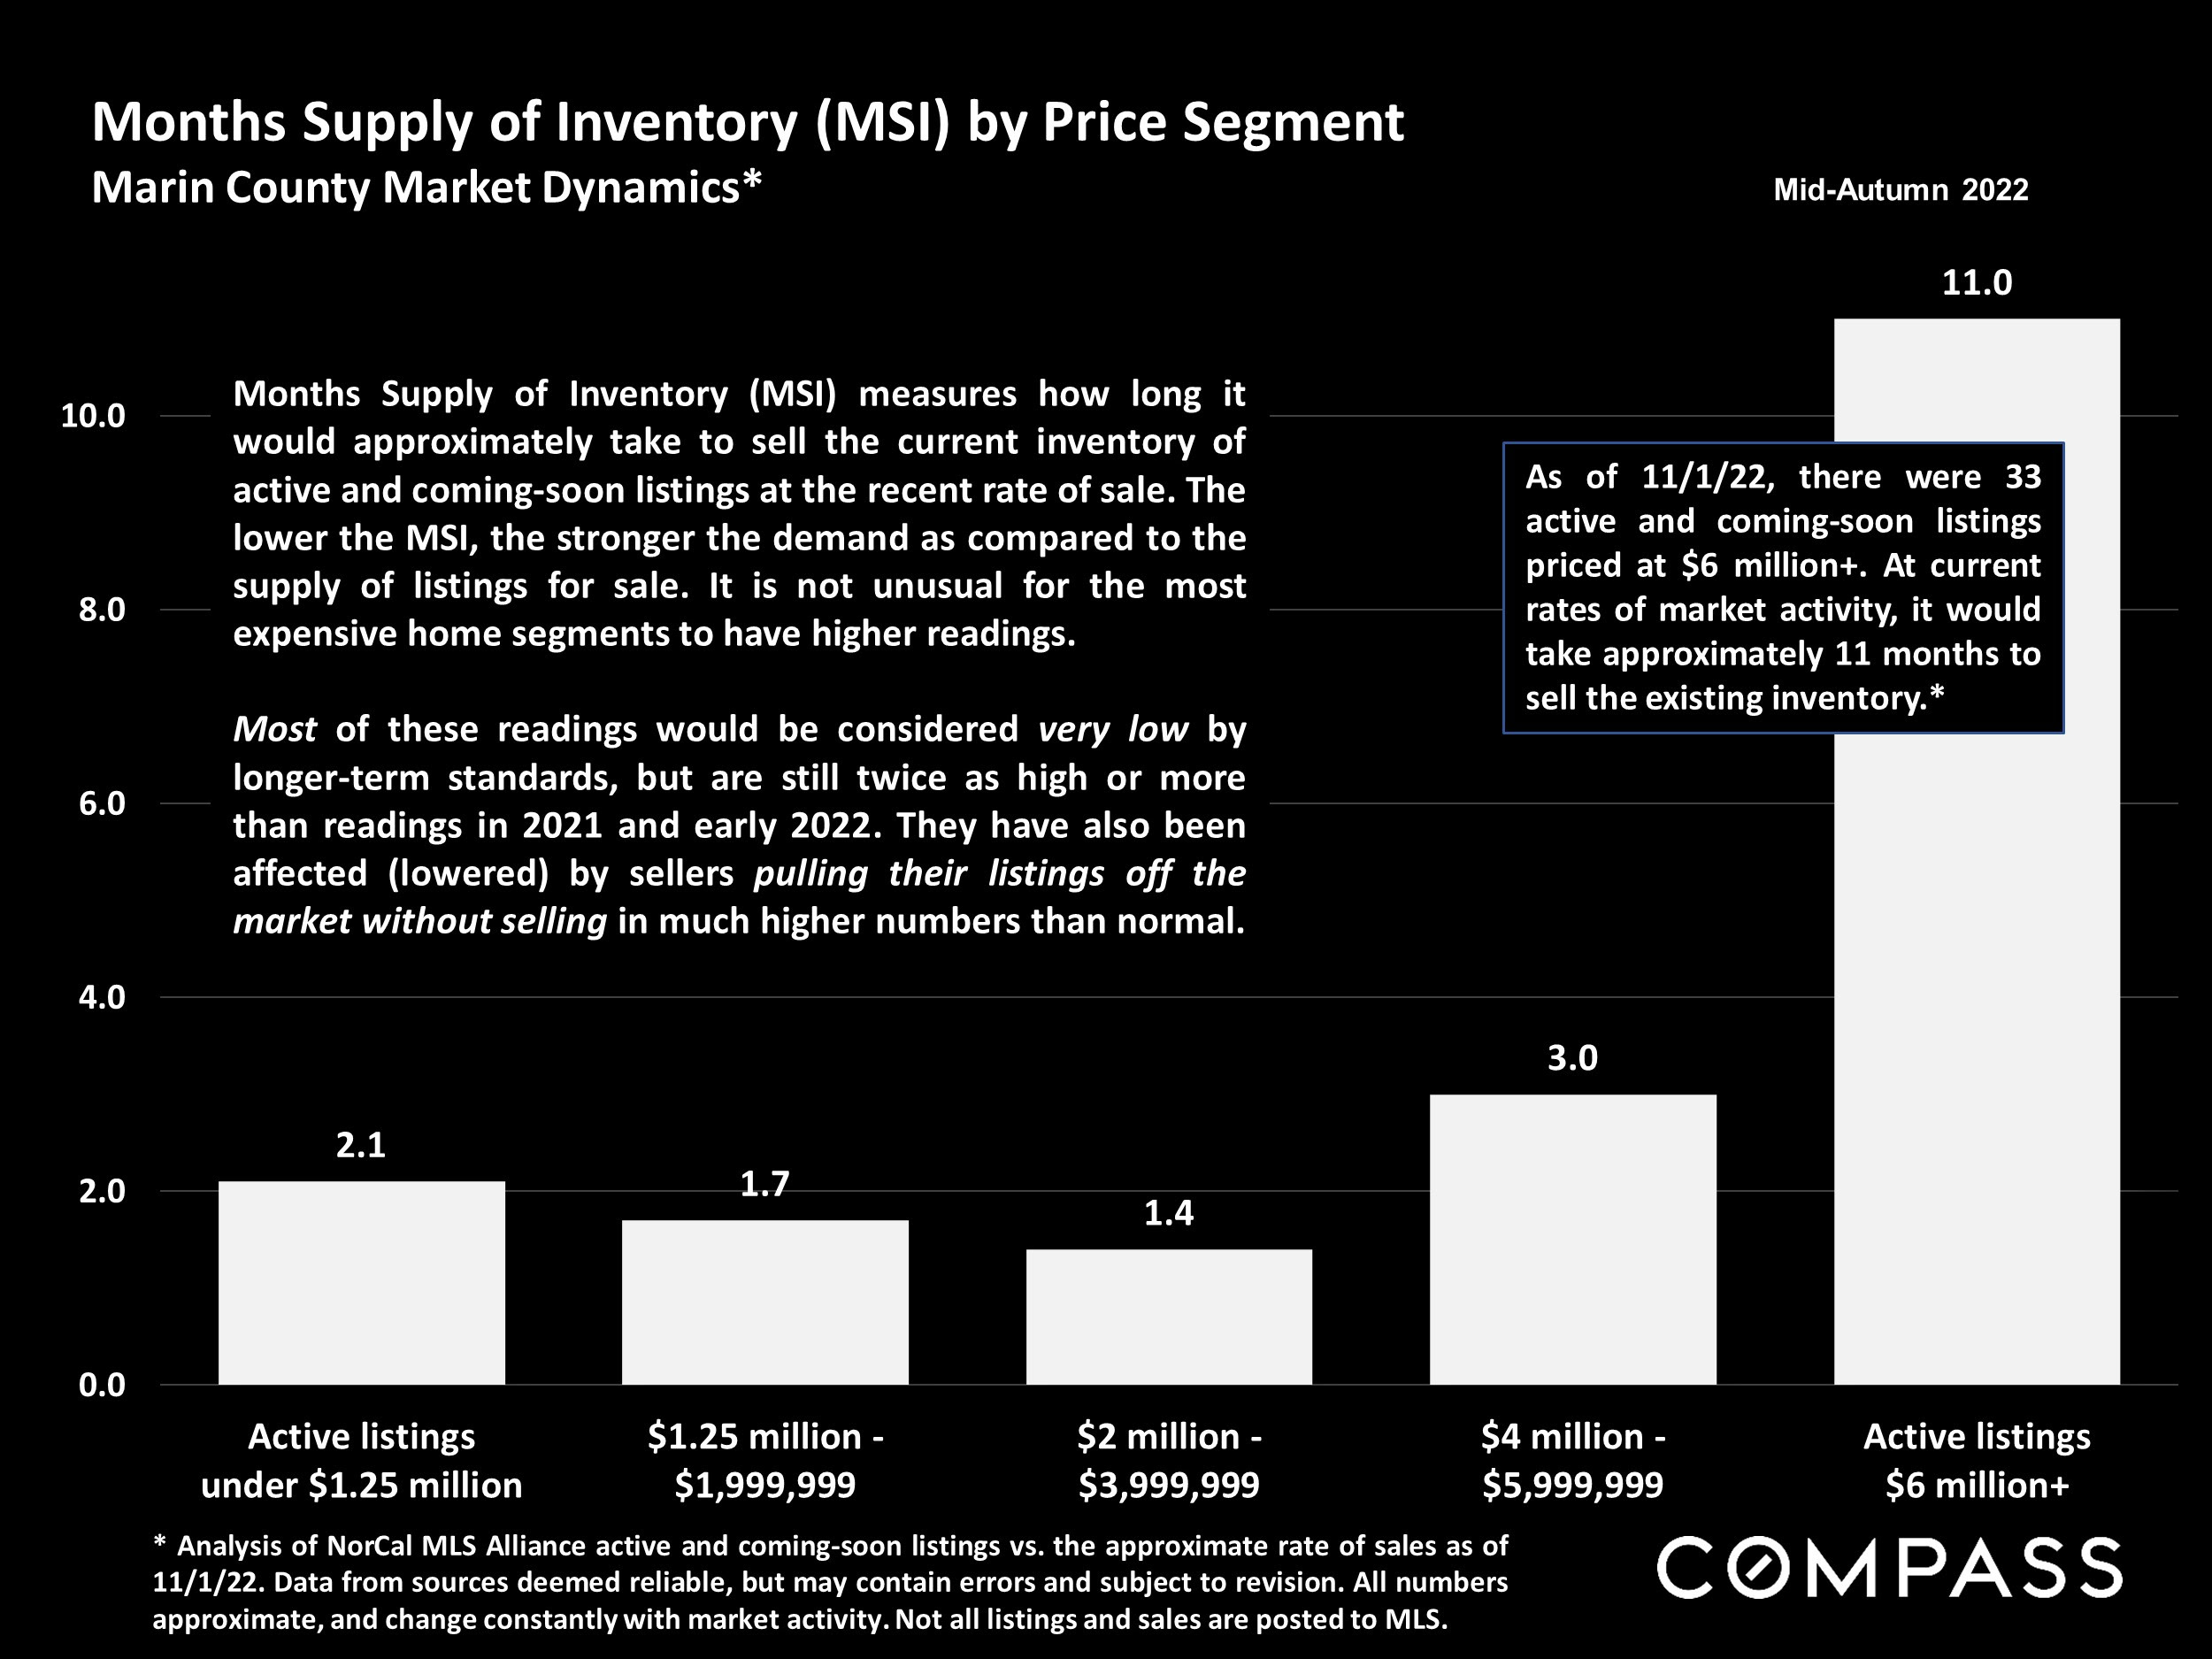
Marin County months-of-supply chart by price segment, ranging from 1.4 to 11 months.
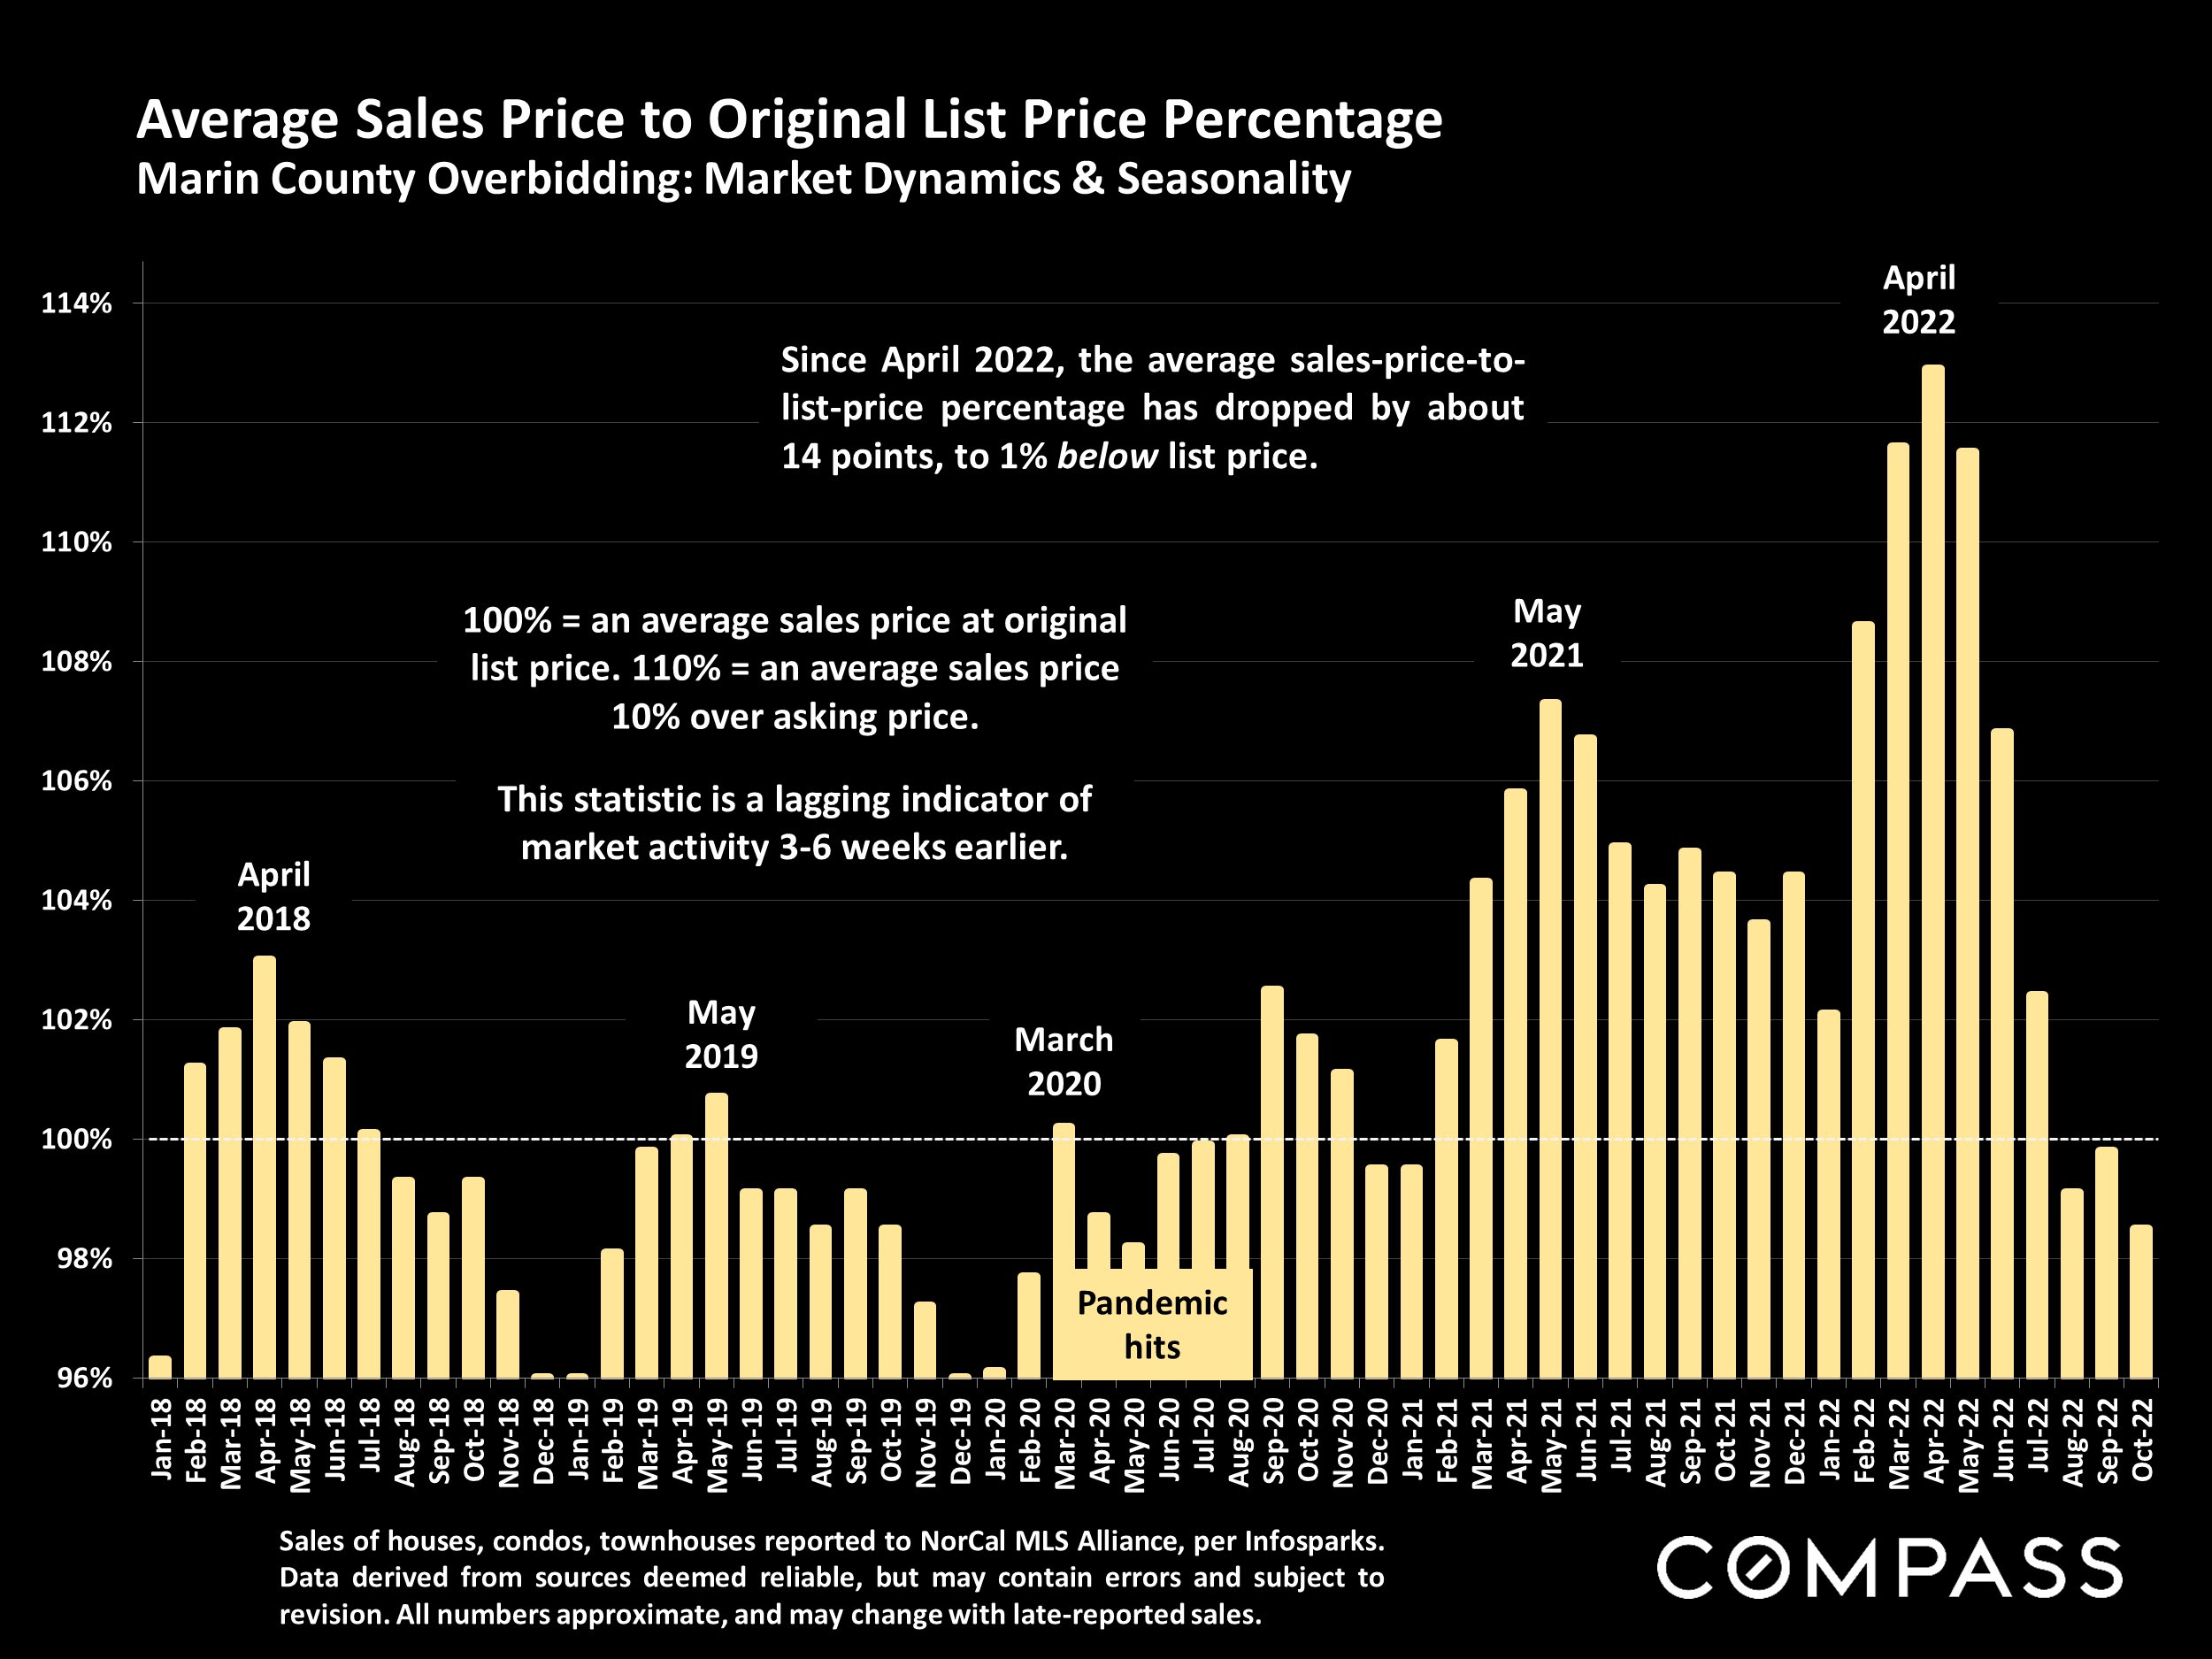
Bar chart of Marin County sales prices relative to original list prices, January 2018 to October 2022.
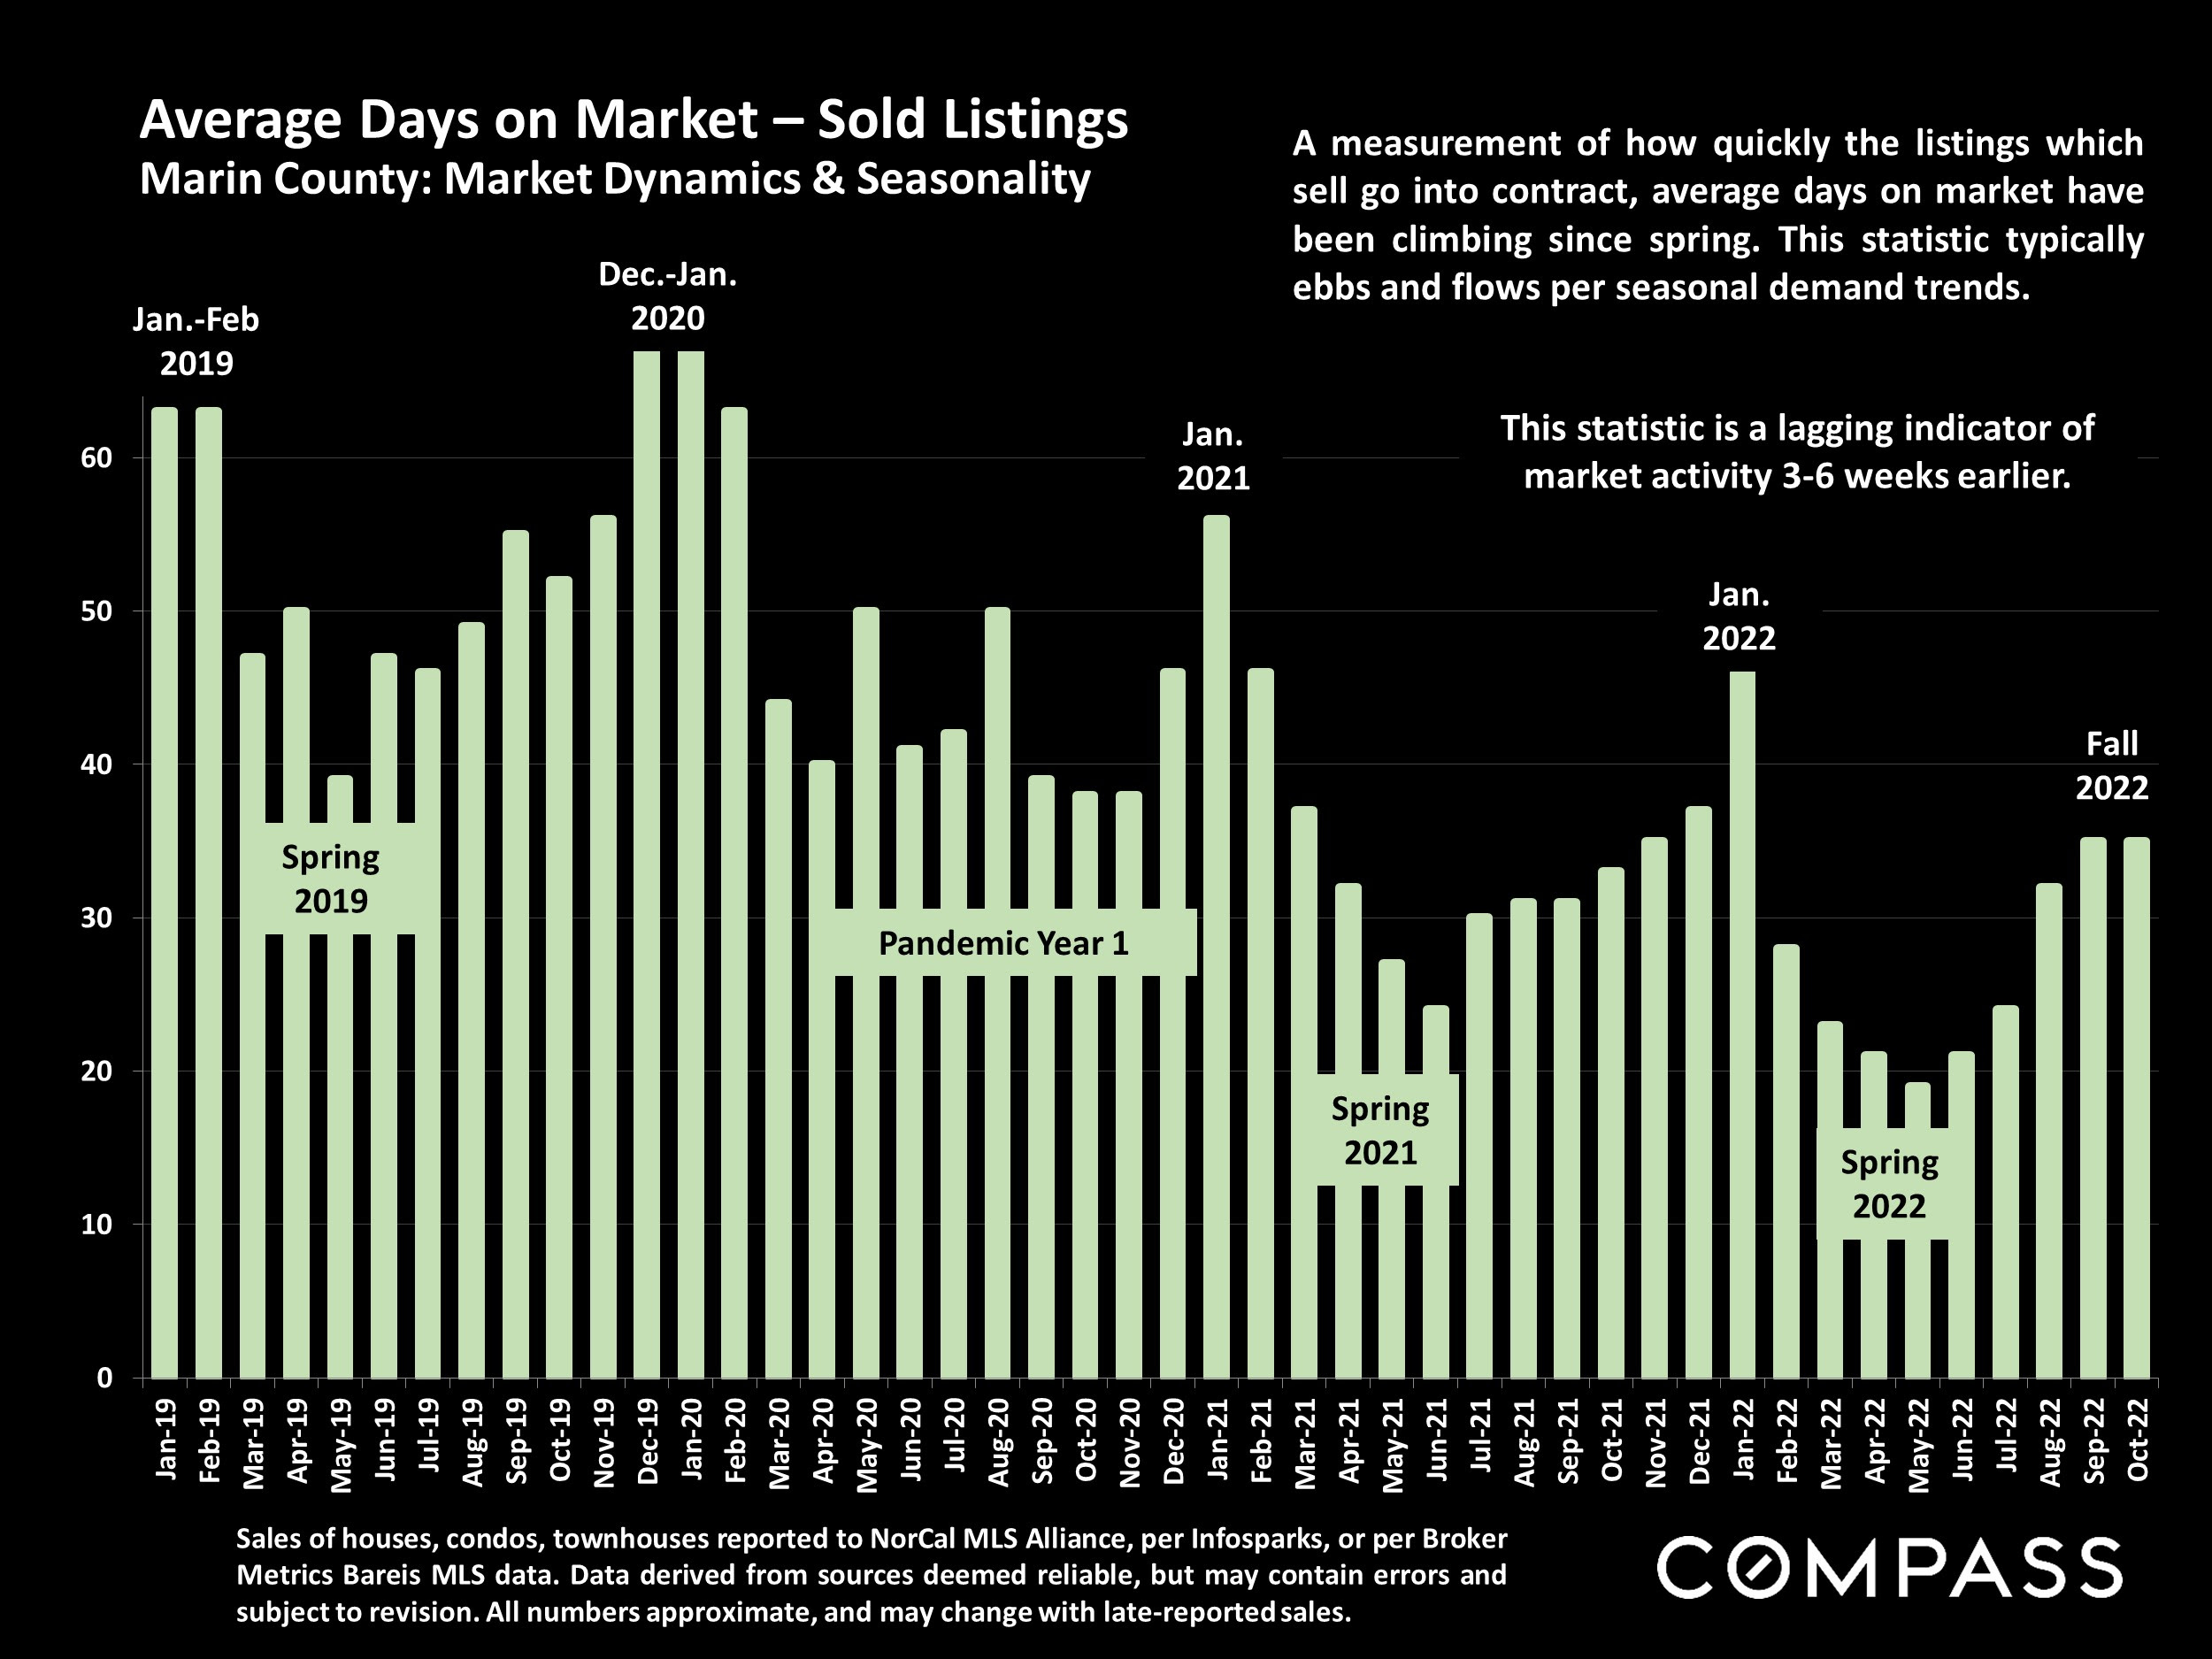
Bar chart of Marin County sold-listing days on market, with monthly data from 2019 through October 2022.
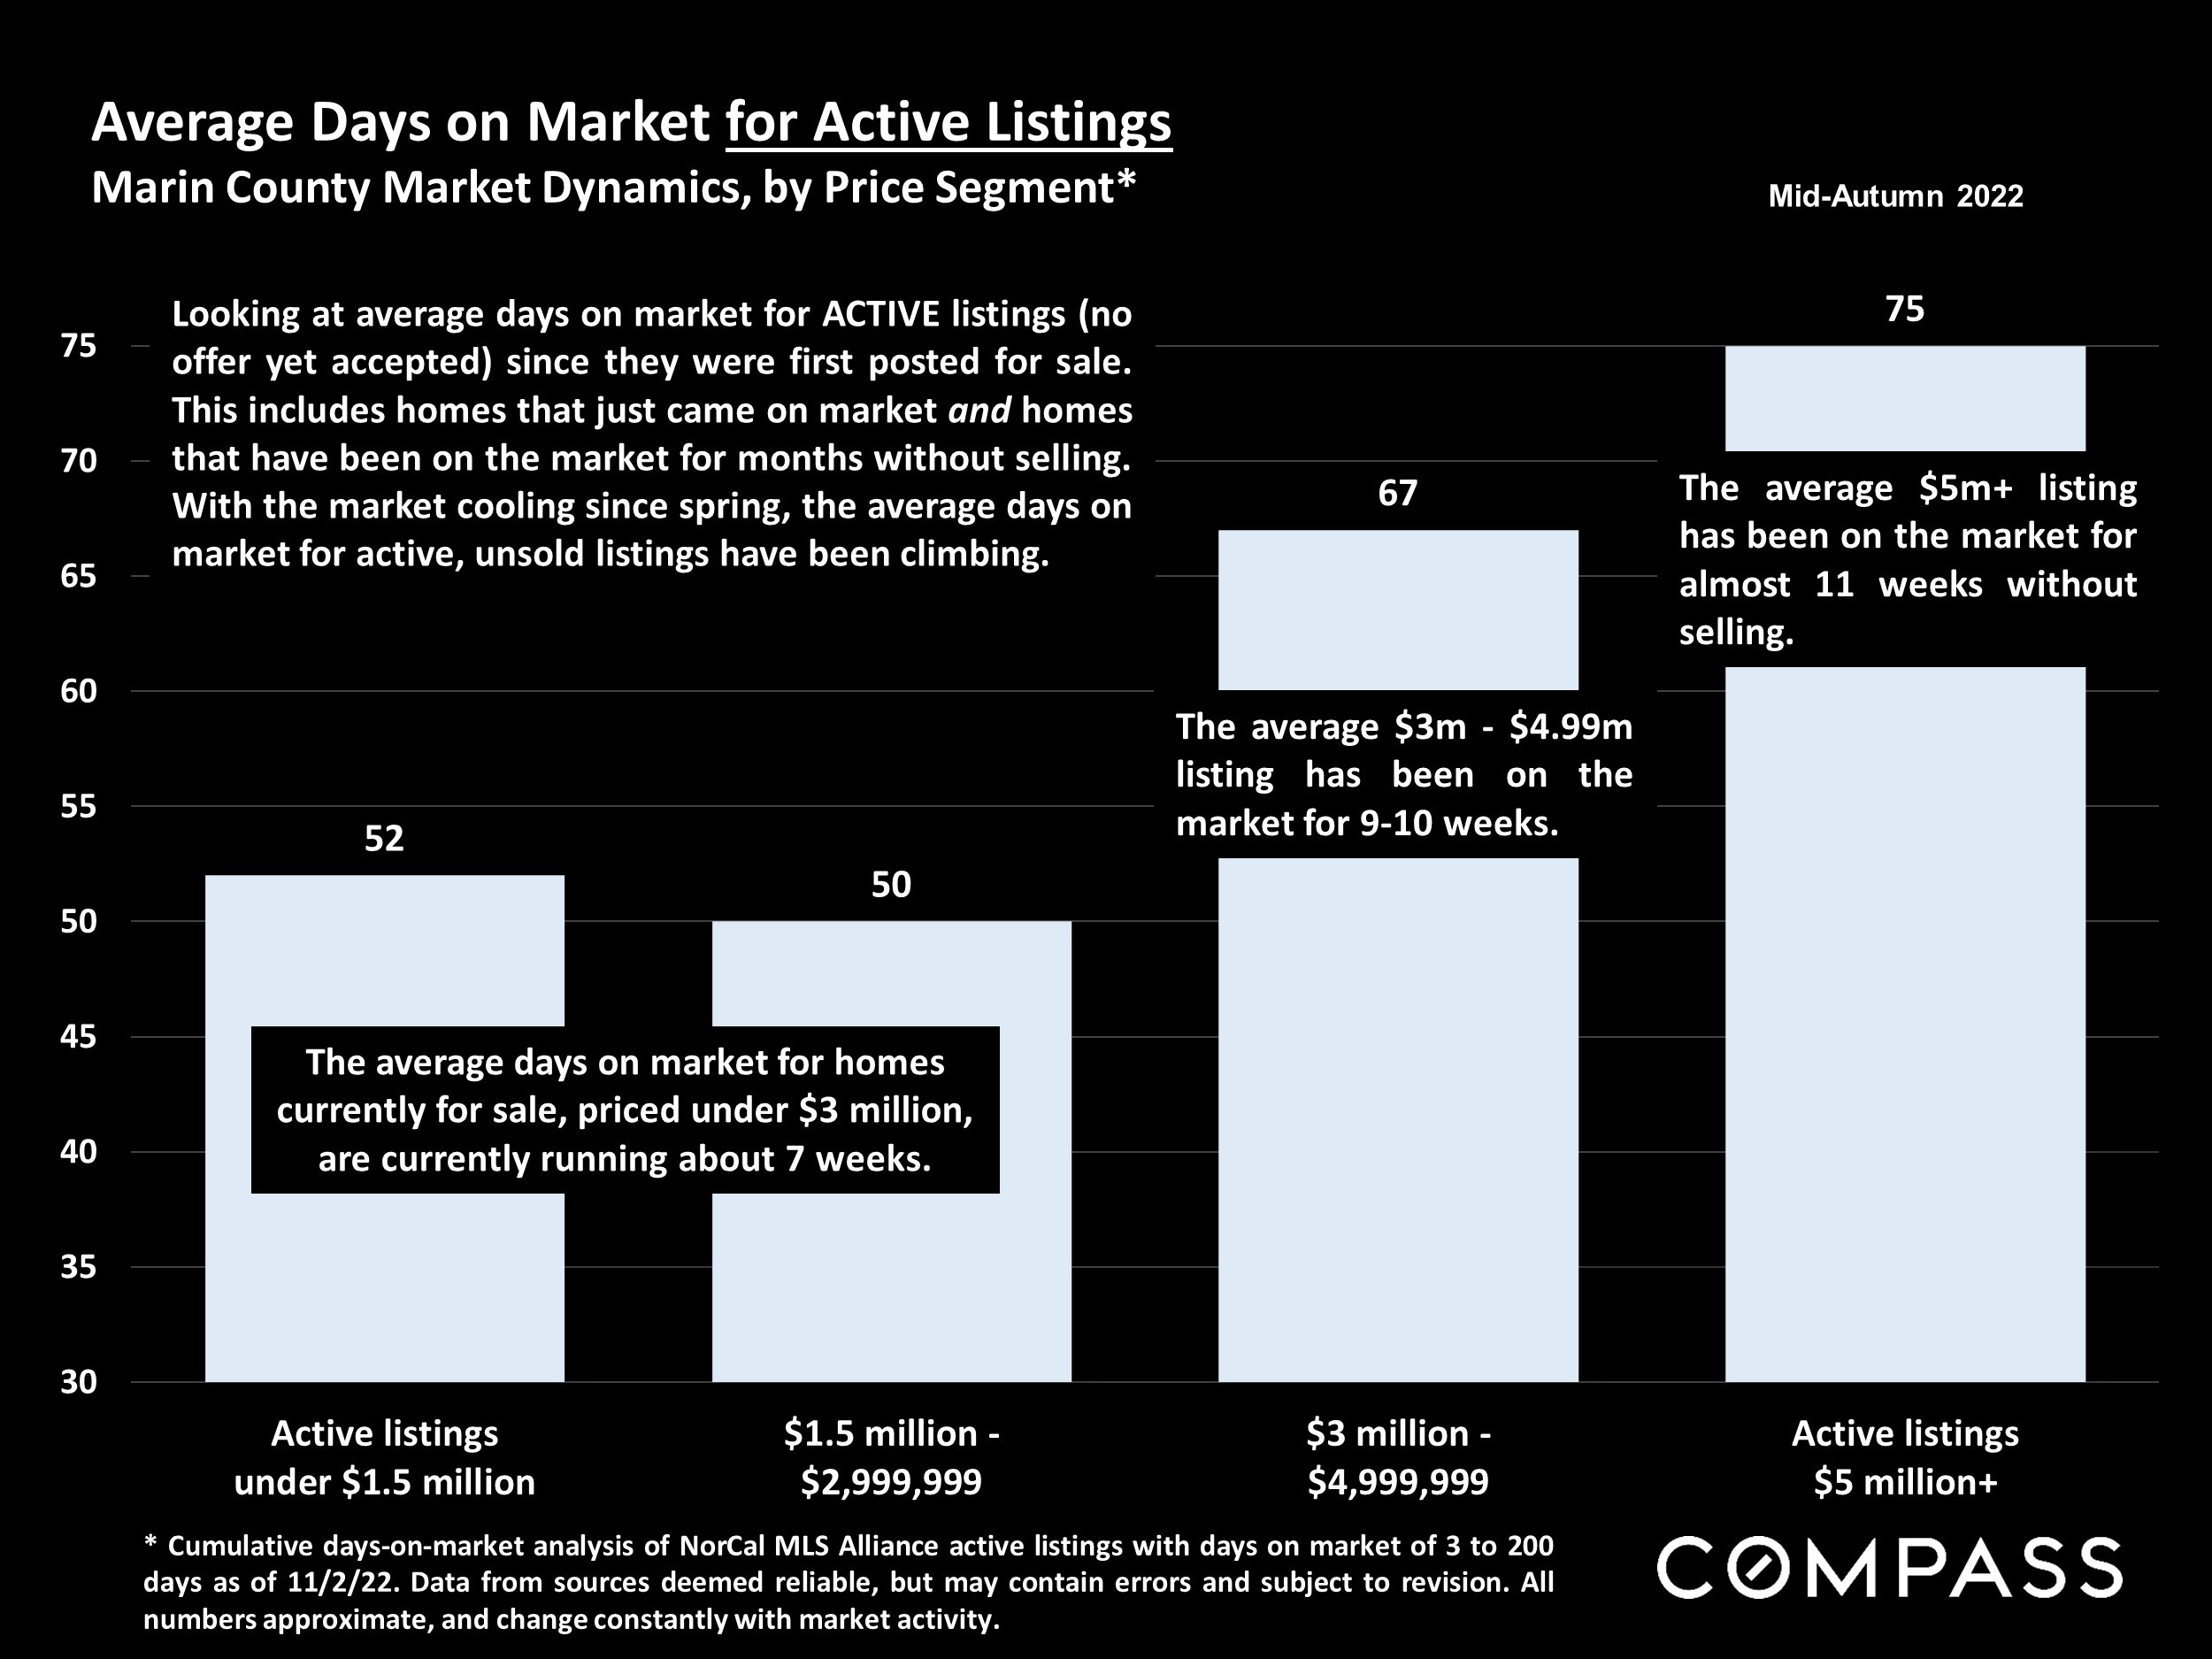
Marin County active listings average 50–75 days on market by price segment, in a Compass infographic.
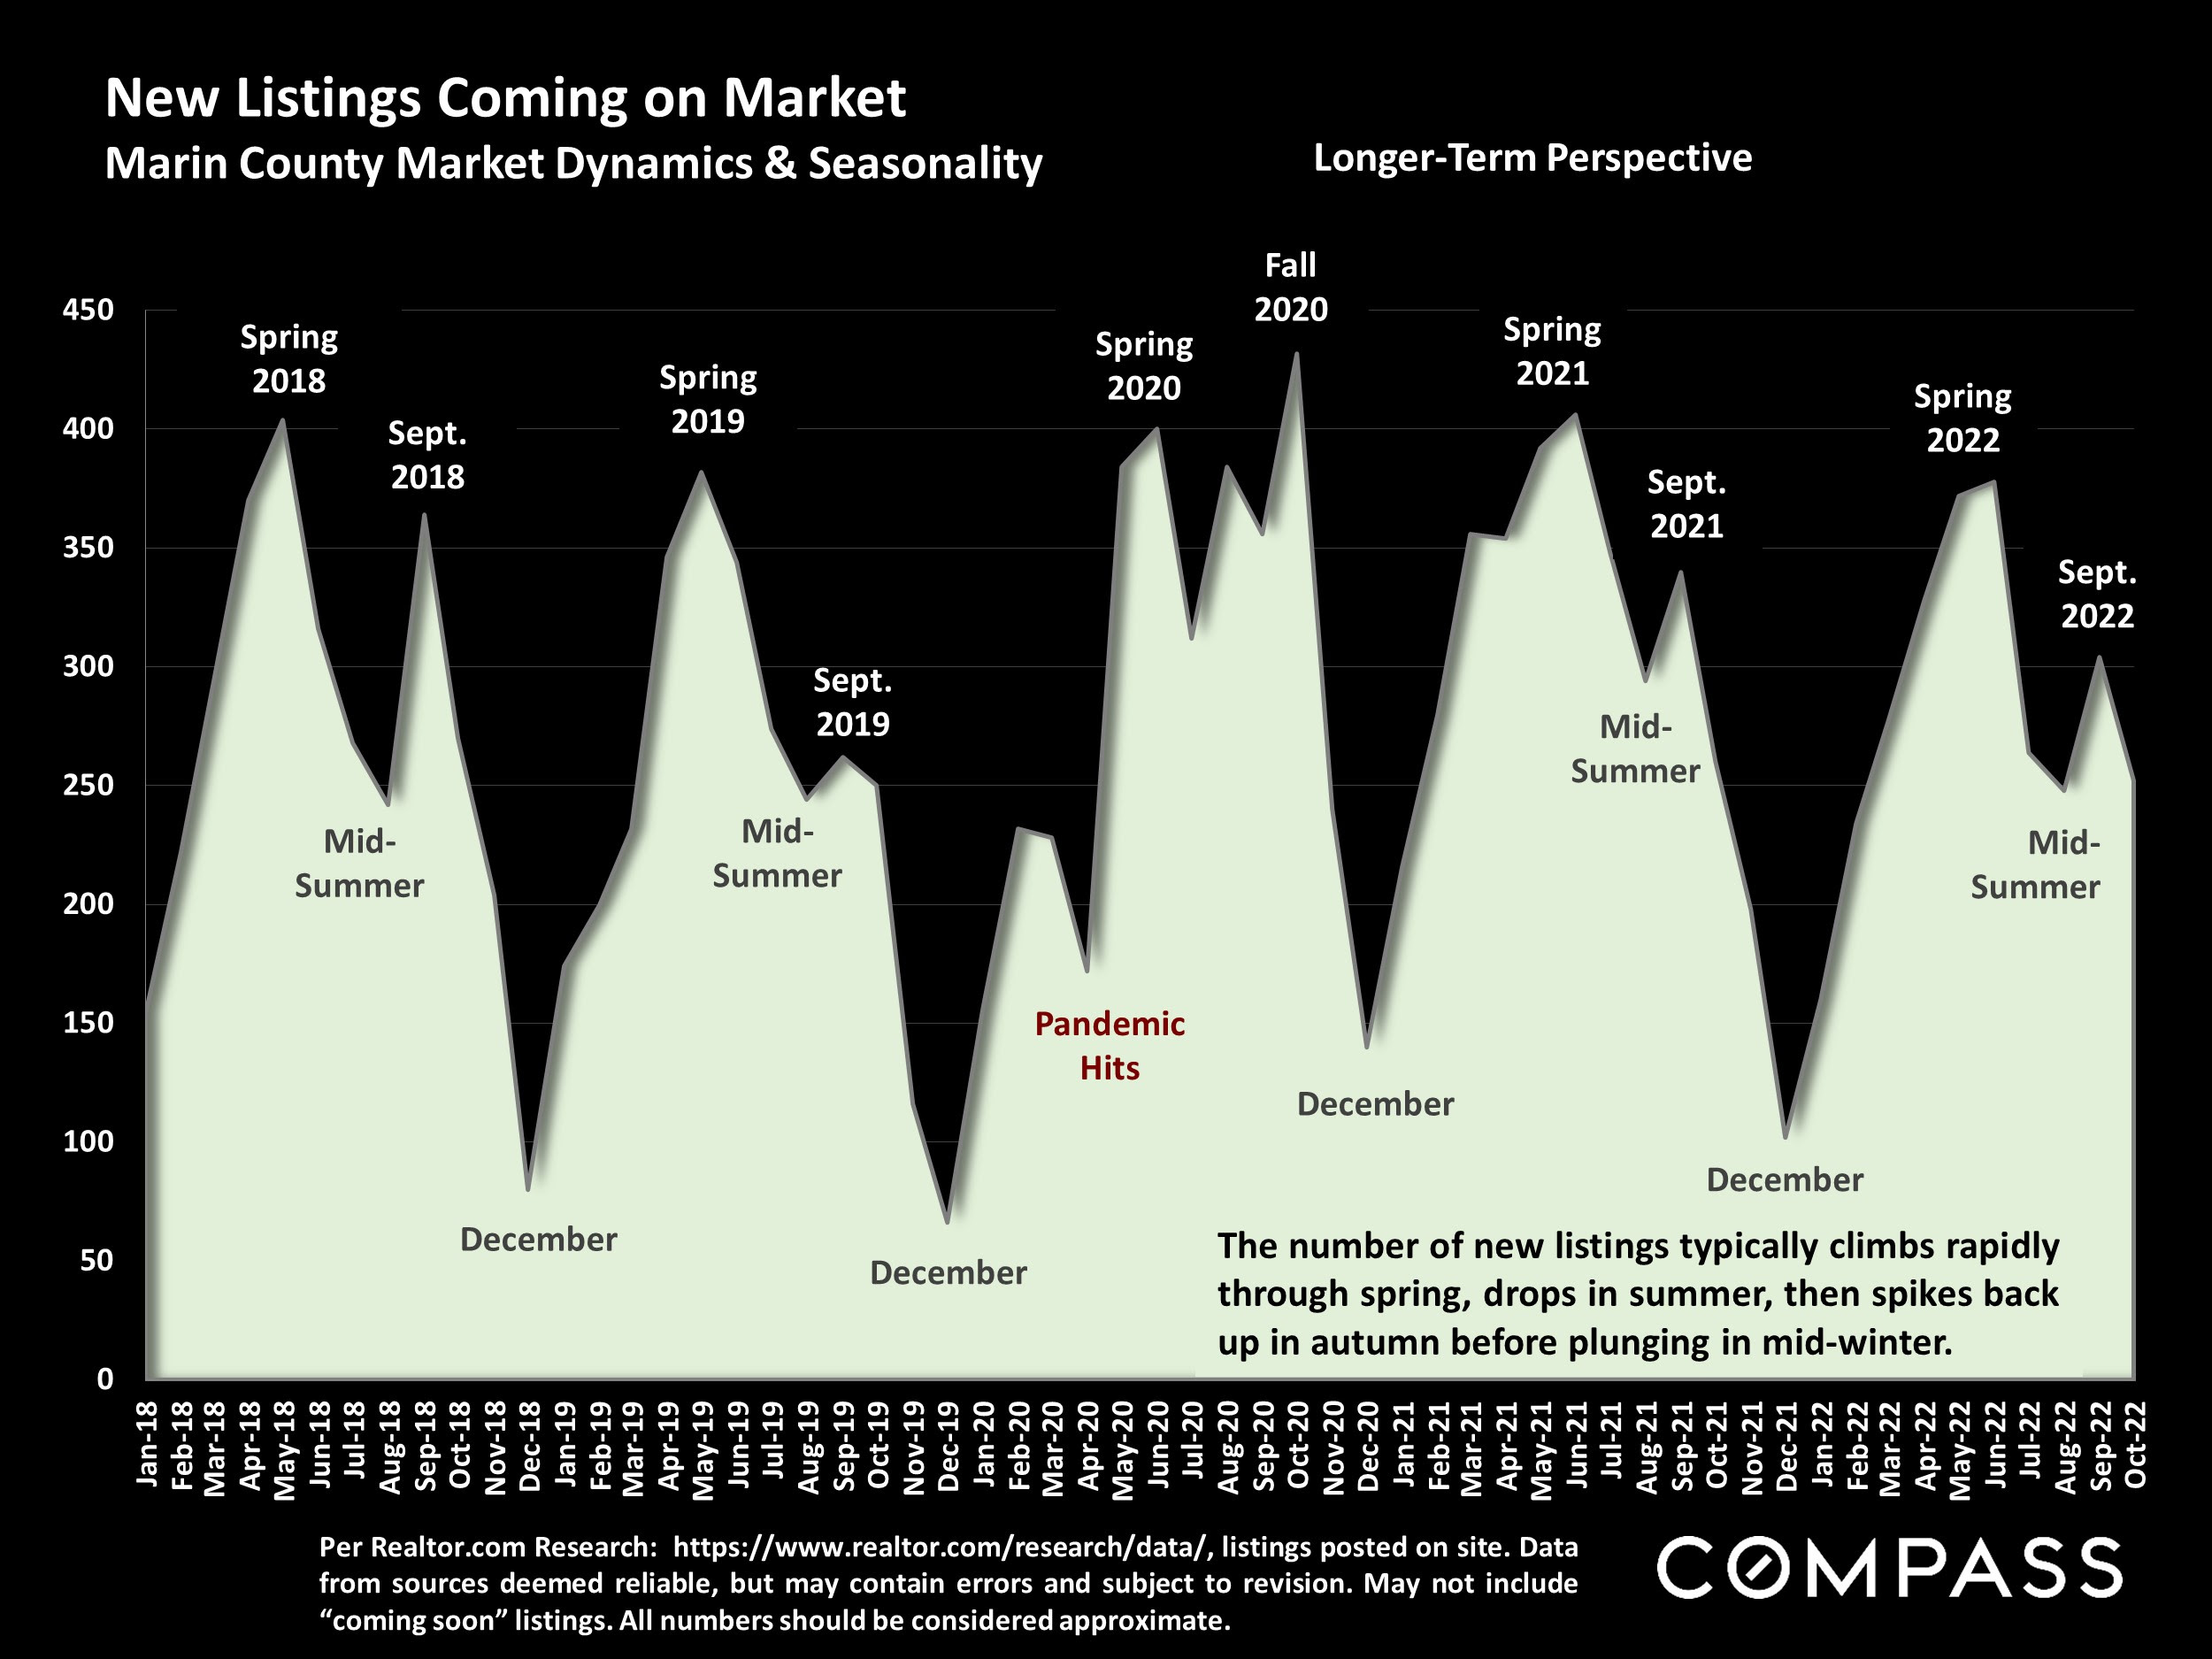
Infographic charting seasonal Marin County new listings from January 2018 to October 2022.
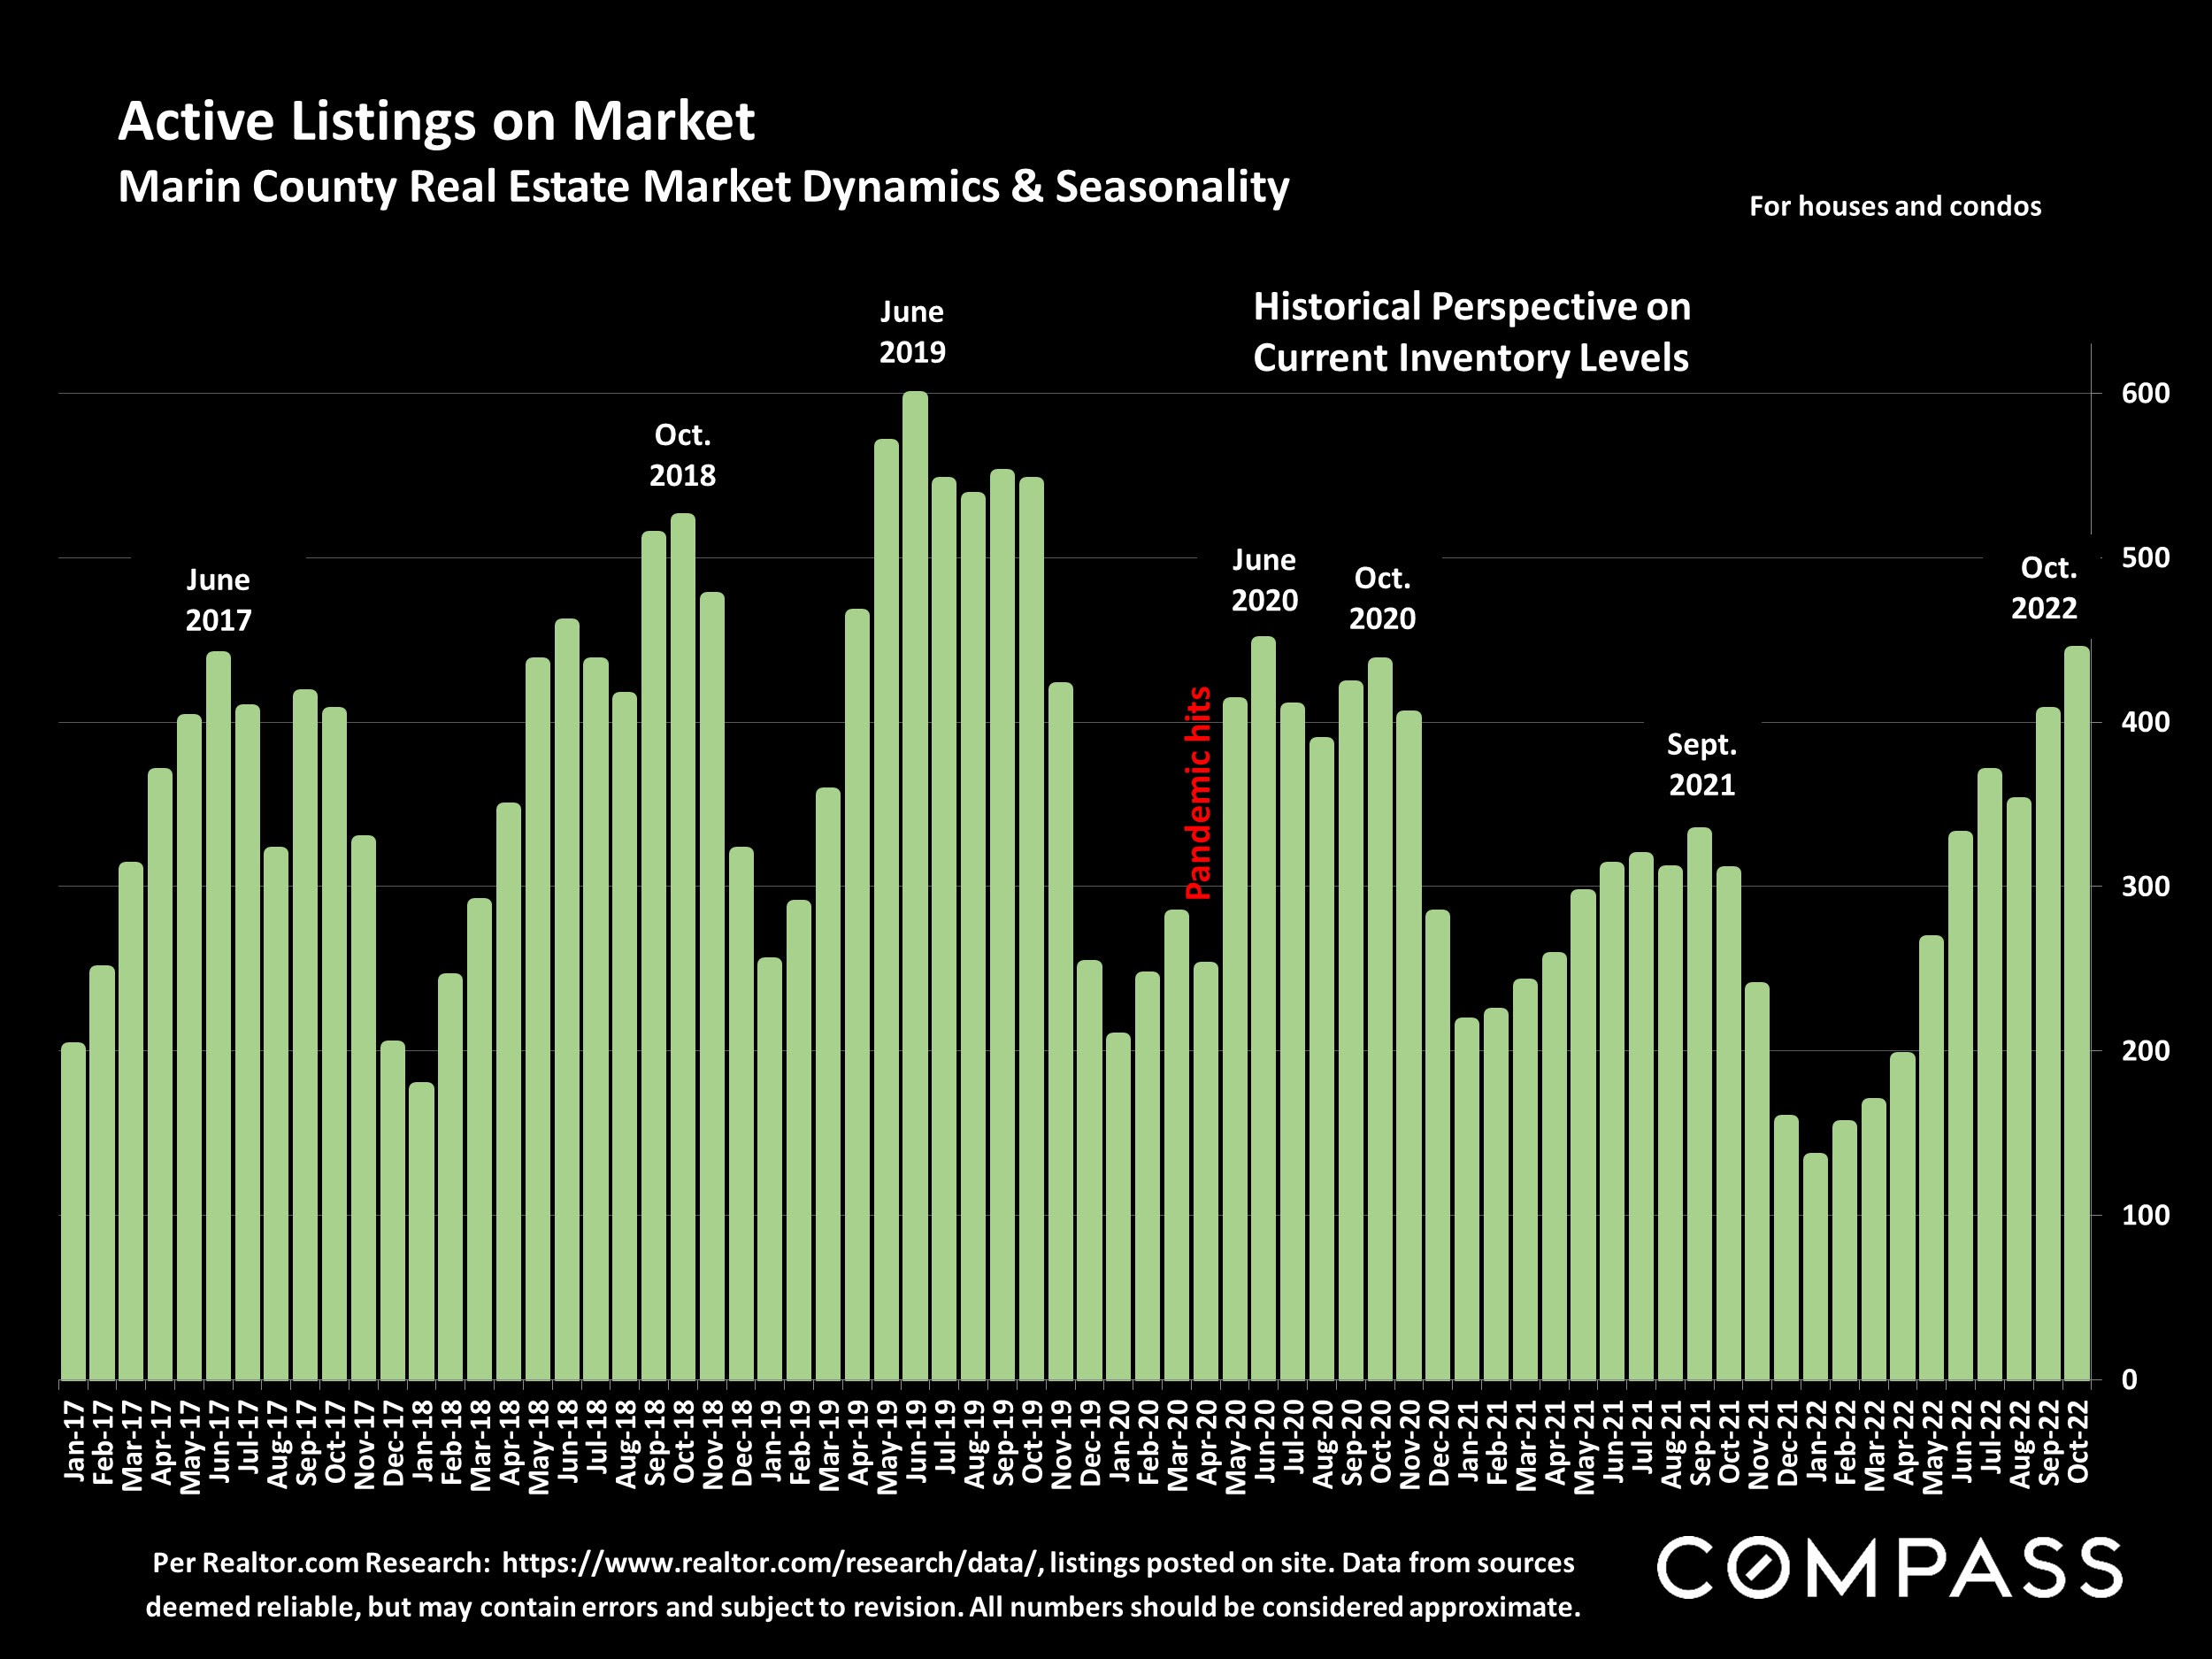
Chart of monthly active Marin County house and condo listings from 2017 to 2022, with a 2019 peak and 2021 decline.
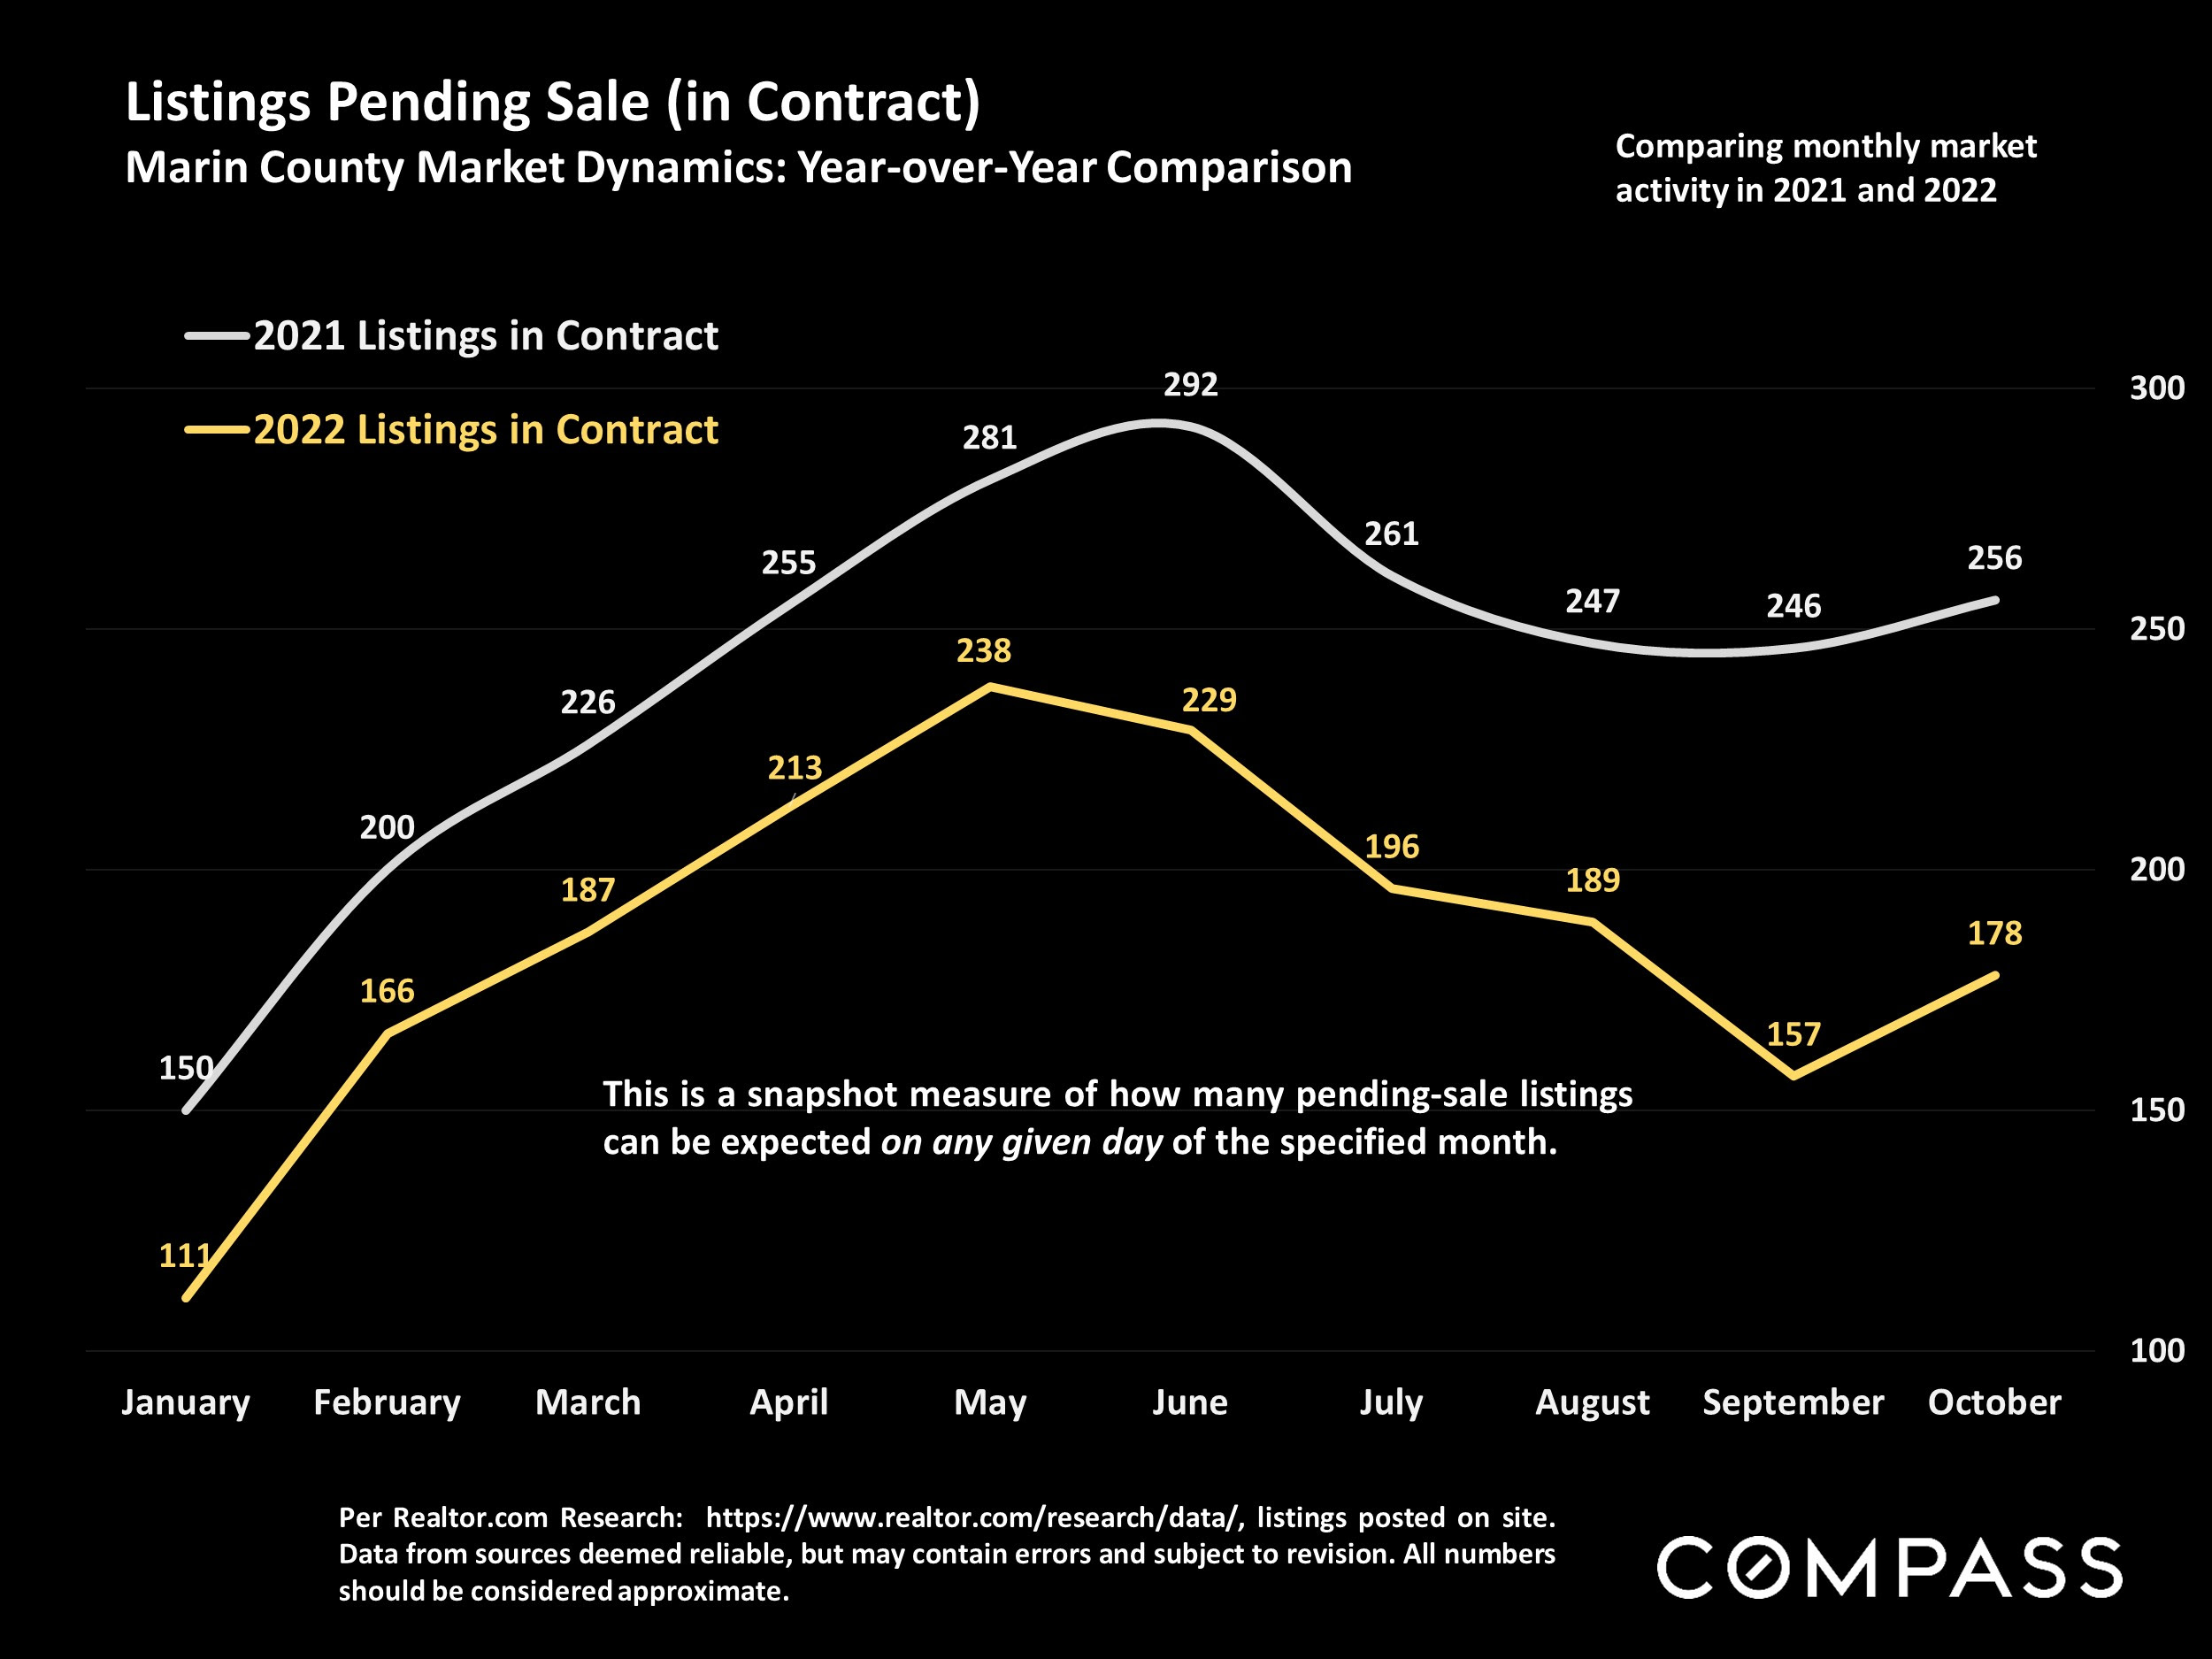
Line chart comparing Marin County pending-sale listings in 2021 and 2022, with monthly counts from January through October.
Chart of Marin County listings accepting offers from 2018 to 2022, with rates peaking near 58% in spring 2022.
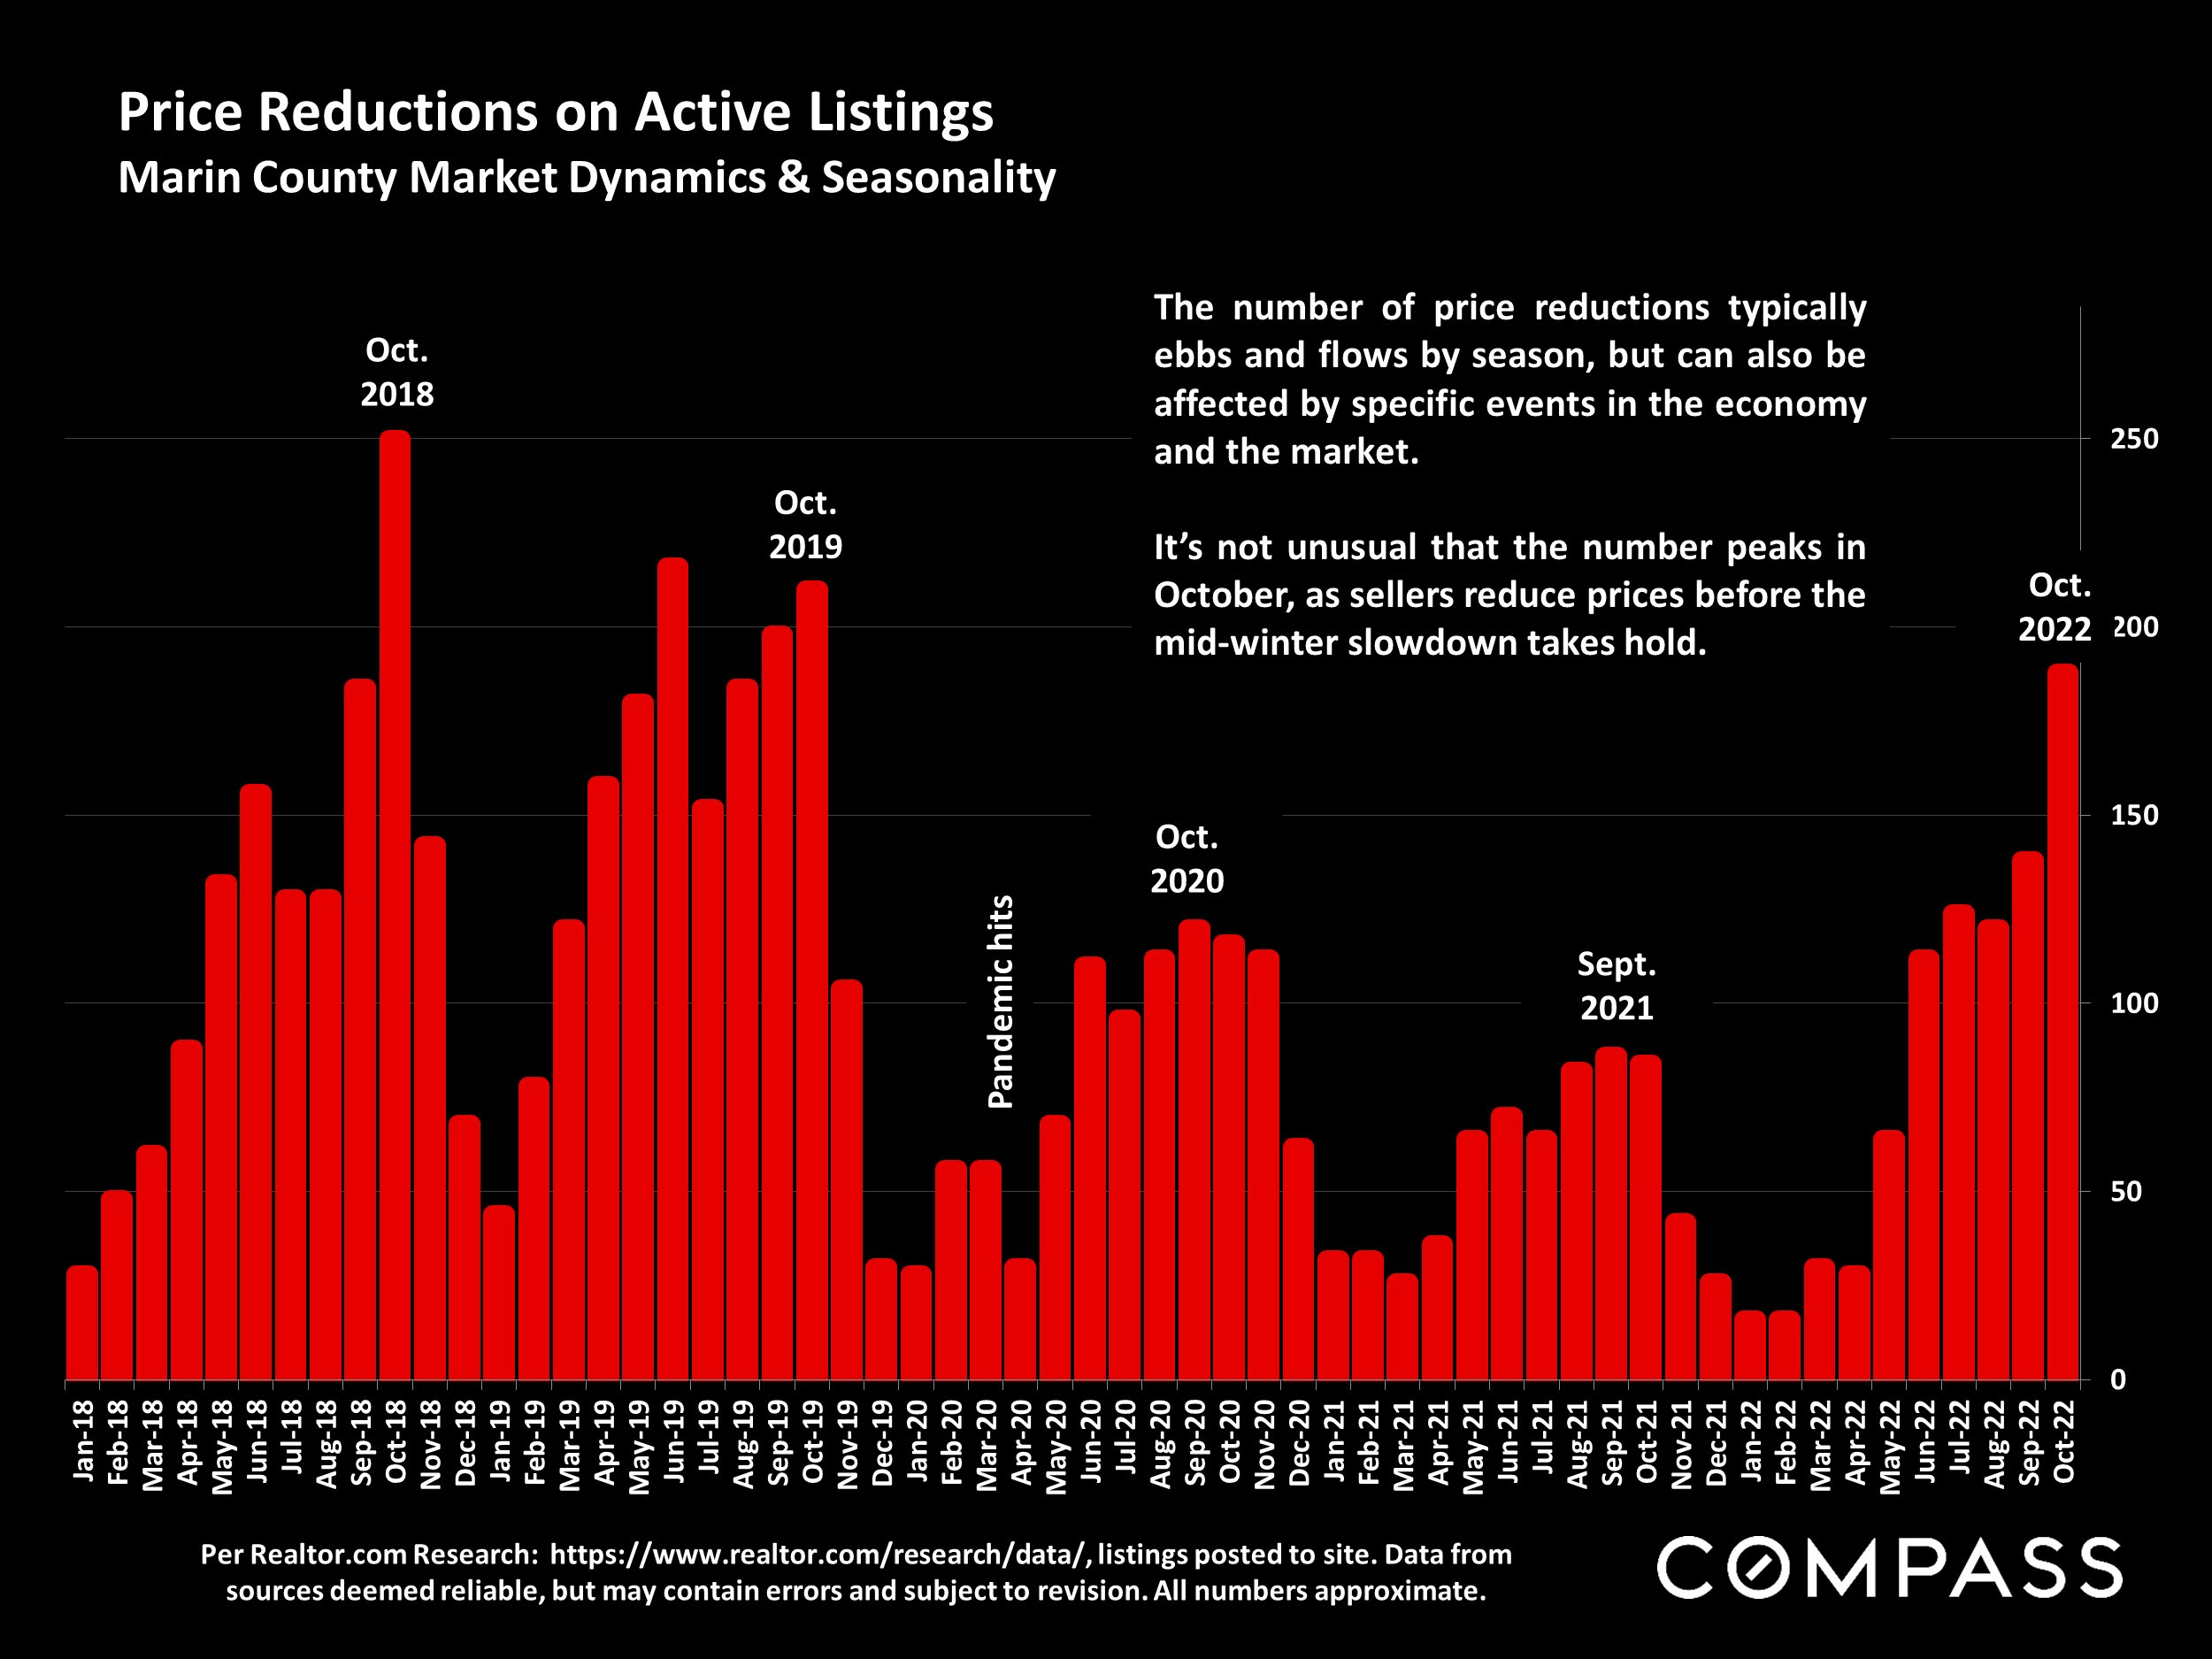
Bar chart of Marin County listing price reductions, January 2018 to October 2022, with seasonal peaks and pandemic annotation.
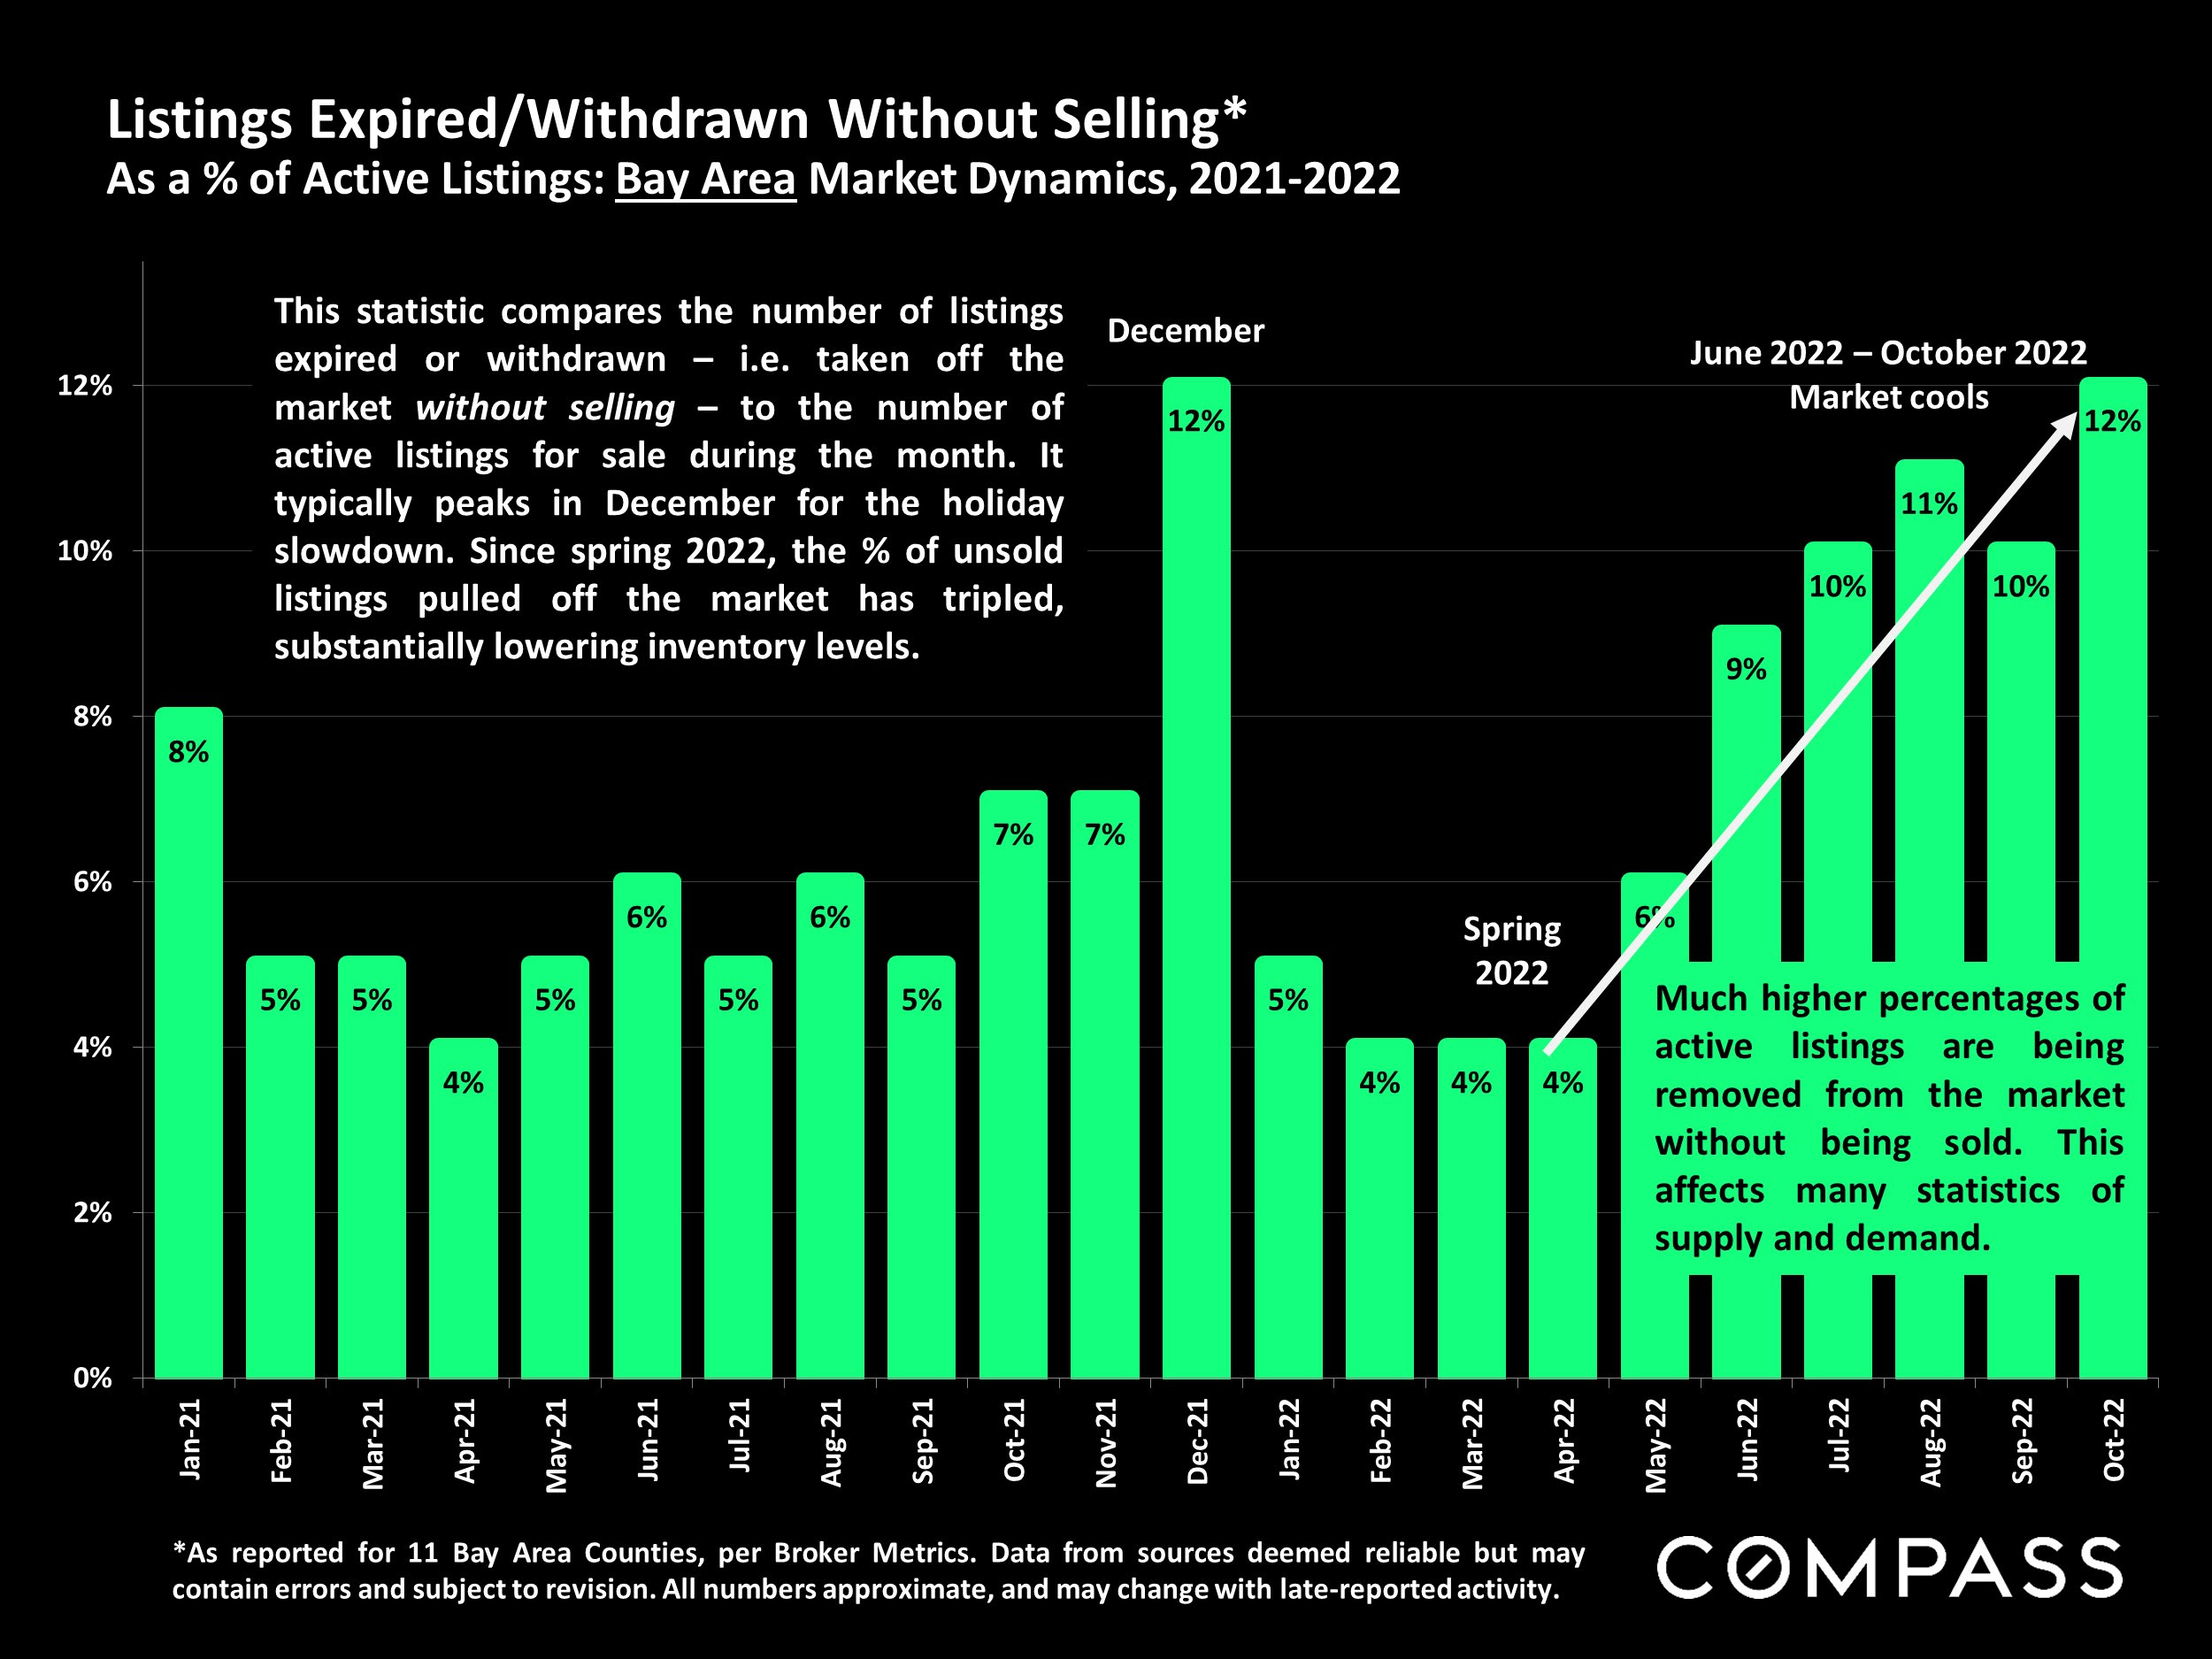
Bar chart showing Bay Area listings withdrawn or expired without selling, rising to 12% in October 2022.
compass
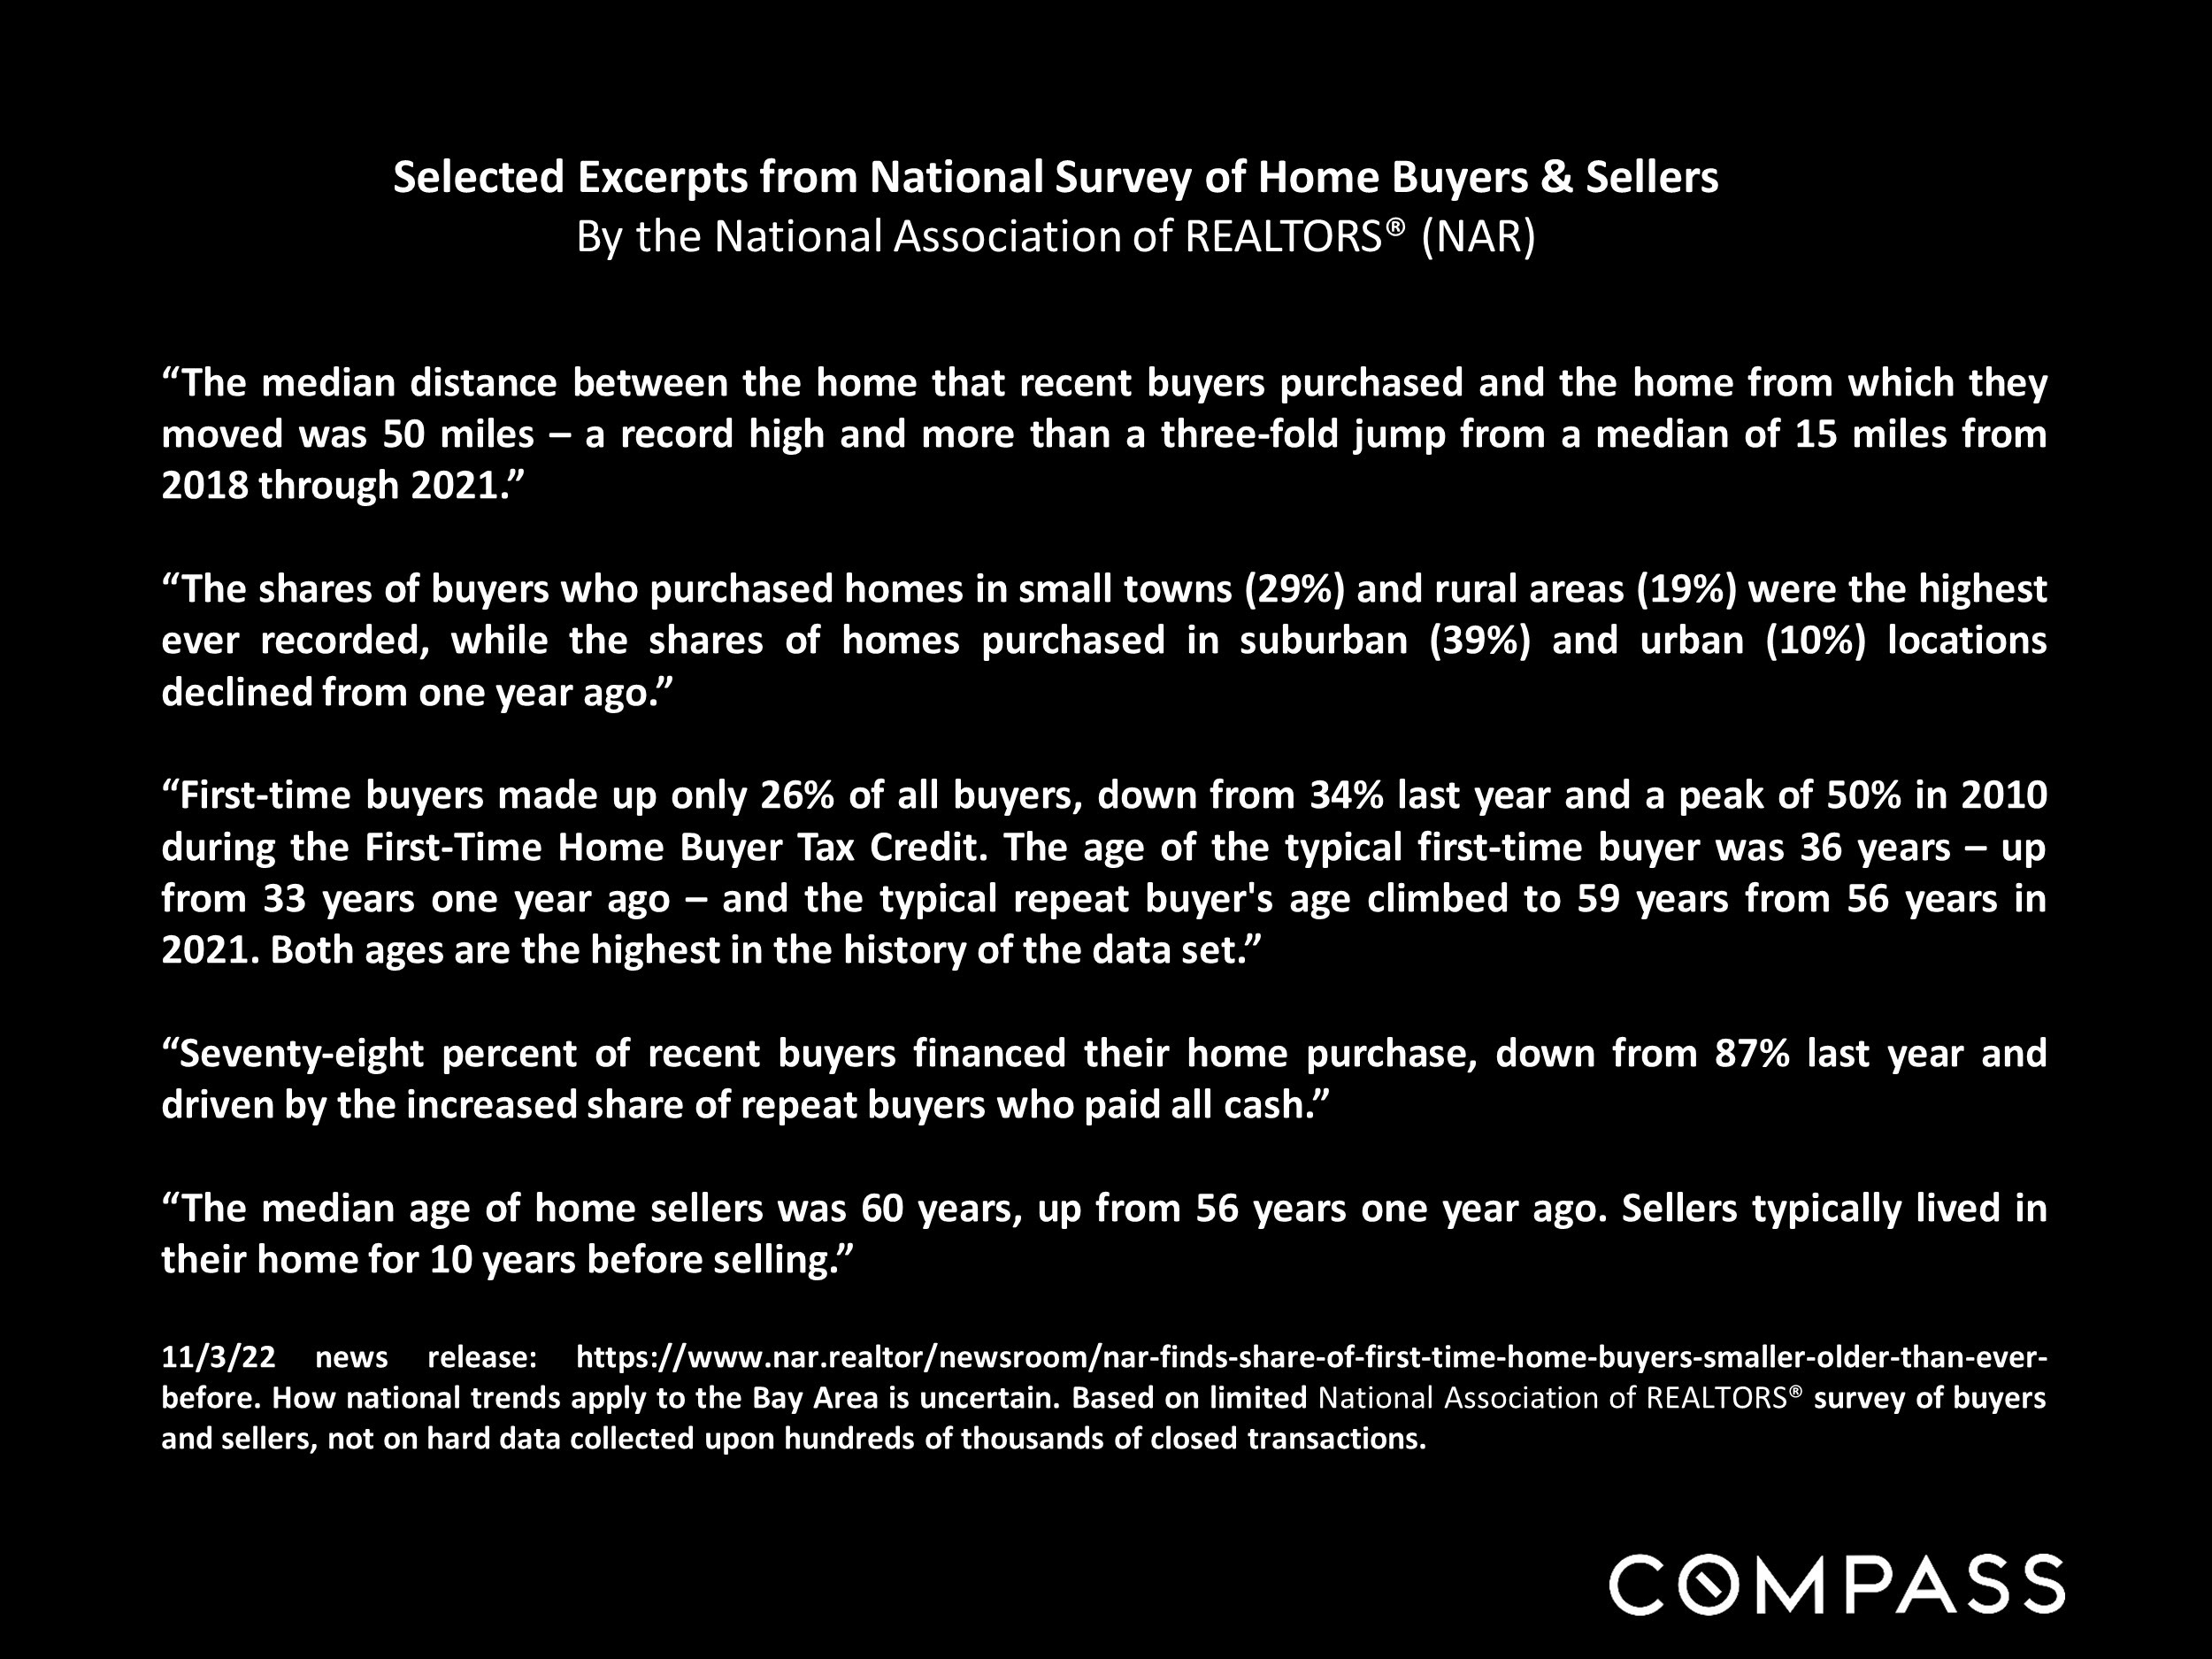
National Association of REALTORS® survey excerpts on home buyers and sellers, with a Compass wordmark.


Ready to talk real estate?

Let's connect!


Back to homepage

Follow Us On Instagram