Max Armour
Max Armour walking along a sunny sidewalk beside brick storefronts and planters.

SF Real Estate Market Report

April 2022. The San Francisco real estate market remained heated in Q1, seeing robust sales across property types, but interest rates have soared with large impact on the monthly cost of housing for those financing their purchase. Effects of the increase in interest rates will not show up in the statistics until later in Q2.

April 2022 San Francisco real estate report with Q1 market statistics and a man walking on a city sidewalk.
Bar chart of San Francisco quarterly median house prices, rising from about $666,000 in 2012 to $1.875 million in Q1 2022.
San Francisco quarterly condo prices, 2012–2022, rising from about $646,000 to over $1.2 million.
San Francisco six-month house sales statistics by neighborhood, with prices, home sizes, and days on market.
Table comparing six months of two-bedroom, two-bath condo sale statistics across San Francisco neighborhoods.
Bar chart of San Francisco active listings, January 2017–March 2022, with a fall 2020 peak and annual March highlights.
San Francisco housing market infographic comparing active listings from February to April 2022 with 12 months of sales.
San Francisco housing affordability chart comparing house prices, downpayments, and monthly payments in Q1 2021 and Q1 2022.

It is very difficult to accurately predict interest rate changes; 3 months ago, Freddie Mac predicted an average, 30-year, fixed rate of 3.6% for 2022; at the end of March, it hit 4.6%. Now in April, at 5% for the first time in over 10 years -- an increase of 61% since 2022 began.

Chart of weekly 30-year mortgage rates, showing a sharp rise to 4.67% by March 2022.
Chart of San Francisco new listings, December 2017–March 2022, showing seasonal fluctuations and a spring 2022 increase.
Chart comparing monthly San Francisco house and condo sales from 2019 to March 2022, with seasonal and pandemic annotations.
Chart of San Francisco luxury home sales by quarter, 2018–2022, comparing $3m+ houses with $2m+ condos and co-ops.
Bar chart of San Francisco home price reductions, with a pronounced peak in late 2020.
San Francisco quarterly sale-to-list price chart for houses and condos, 2018–2022, with houses reaching 121%.
San Francisco quarterly days-on-market chart: houses took longer to sell than condos from 2019 through early 2022.
Bay Area demographic infographic with charts of population, protected open space, housing occupancy, and earnings.
 
Modern home at dusk with expansive glass windows and a brightly lit garage.
325 Buena Vista Avenue
Mill Valley
4 Bed | 5 Bath
Listed at $5,495,000 
 
 
Living room with a white sectional and floor-to-ceiling windows overlooking the San Francisco skyline.
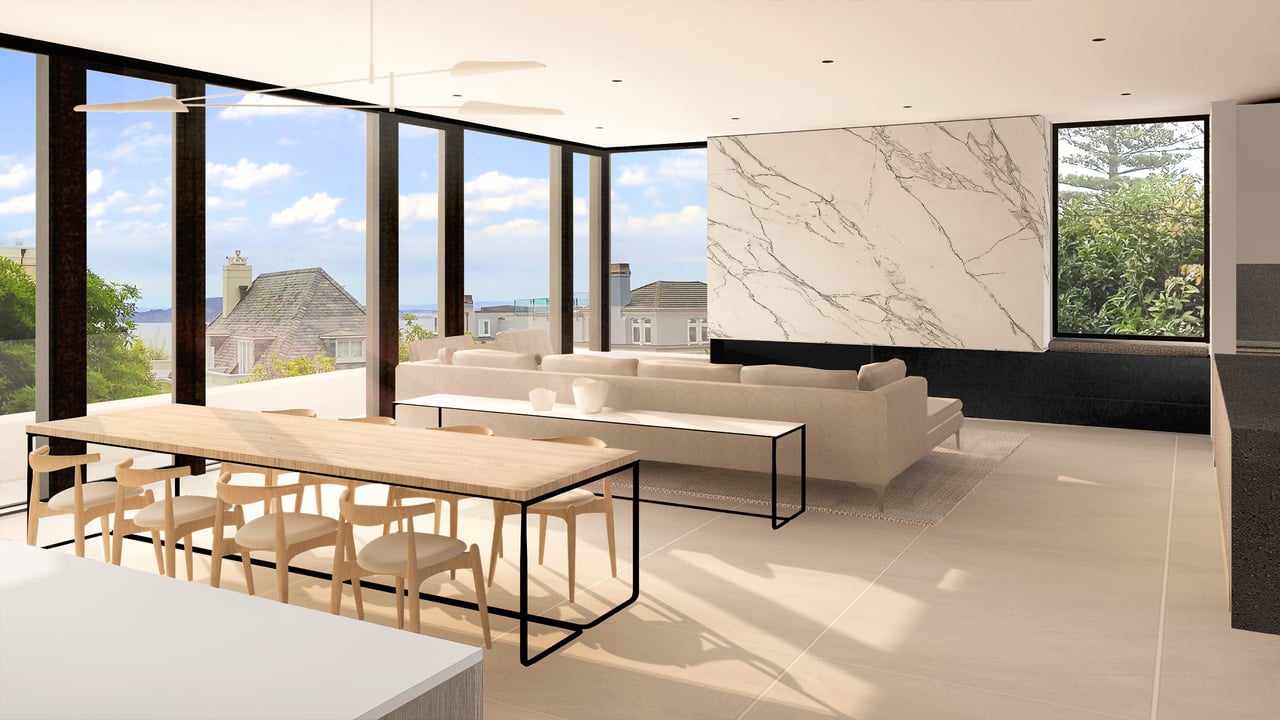
Pacific Heights Penthouse
Completely Remodeled
2 Bed | 2 Bath
Listed at $2,495,000
 
Max Armour

Luxury at Compass

Real estate statistics caveats and Compass legal disclaimer.

Follow Us On Instagram