Max Armour
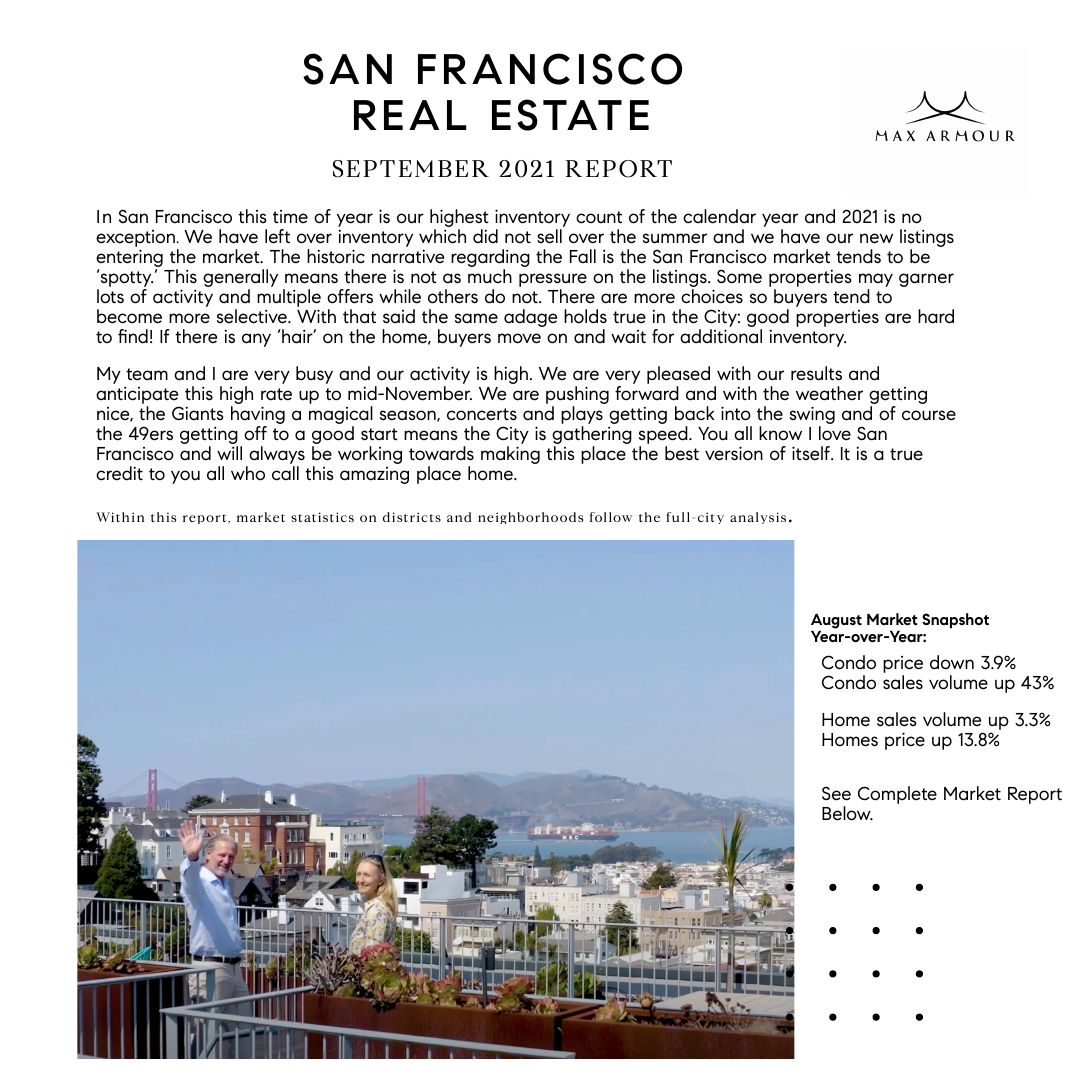
Rooftop terrace overlooking San Francisco and the Golden Gate Bridge, with two people beside raised planters.

SF Market Report -September

In San Francisco this time of year is our highest inventory count of the calendar year and 2021 is no exception
View in browser
 
September 2021 San Francisco real estate report with market commentary, August statistics, and a rooftop view of the city.

 I appreciate you all and please stop by this weekend to check out our latest additions to our Fall Collection: 

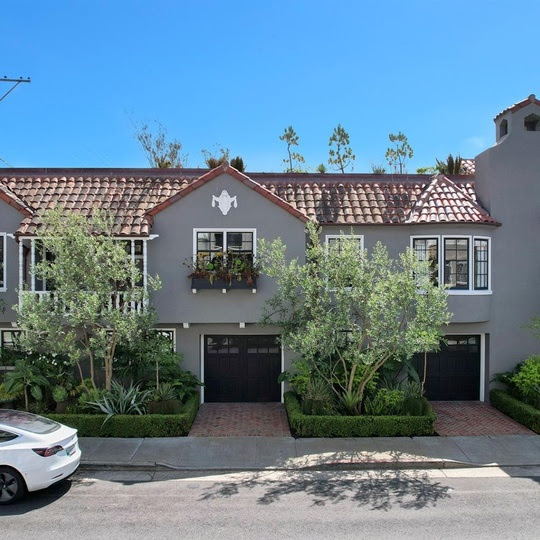
Gray stucco homes with tiled roofs, garage doors, and landscaped front yards on a sunny street.
196 Avila Street
Marina District
3 Bed | 3.5 Bath I 2 Car

$6,195,000

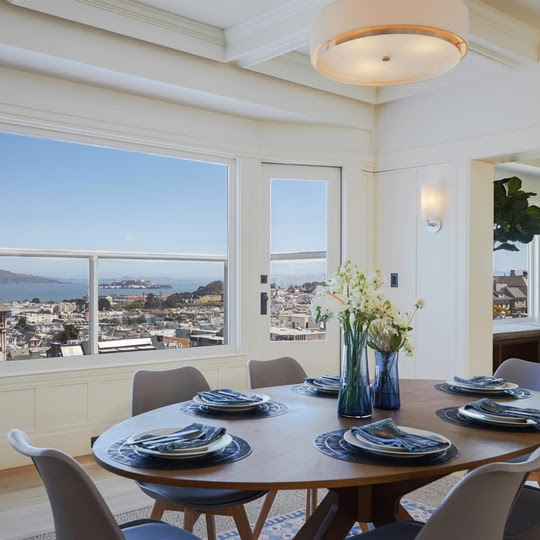
Dining room with a set table and wide windows overlooking San Francisco rooftops and the bay.
2440 Broadway
Pacific Heights View Flat
3 Bed | 3.5 Bath I TIC

$4,995,000

 
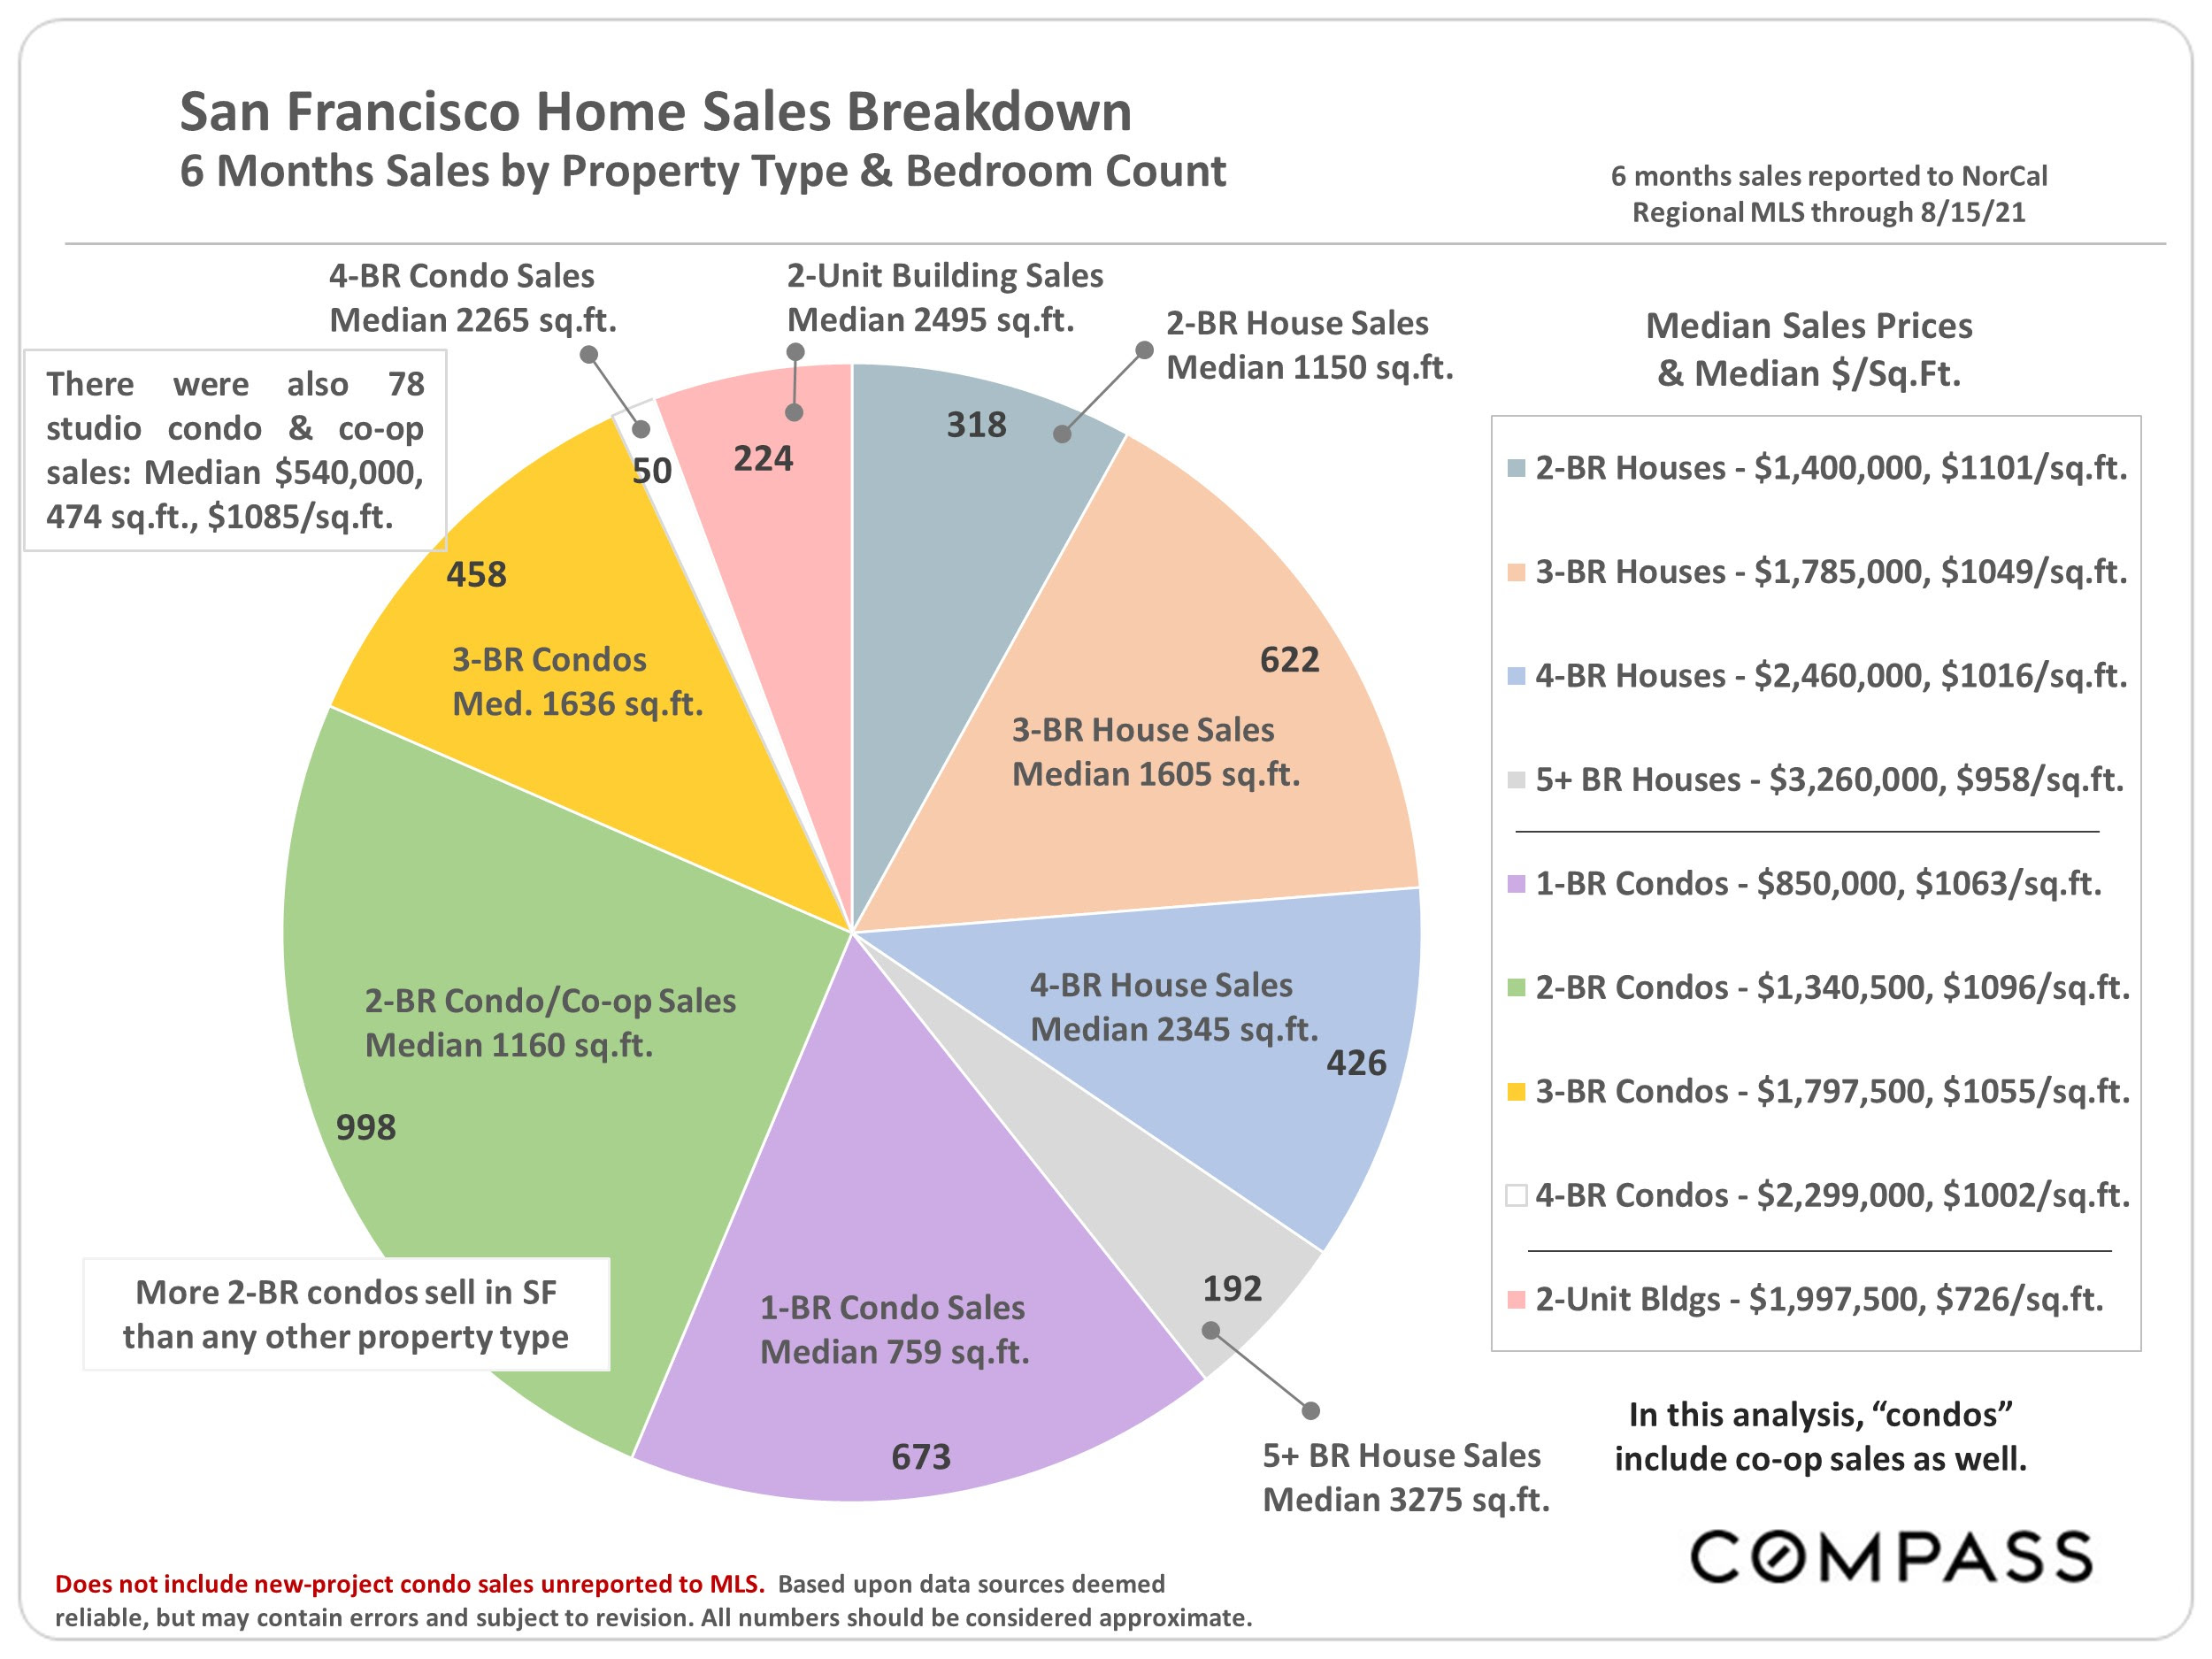
San Francisco home sales infographic comparing six-month sales counts, median sizes, prices, and prices per square foot.
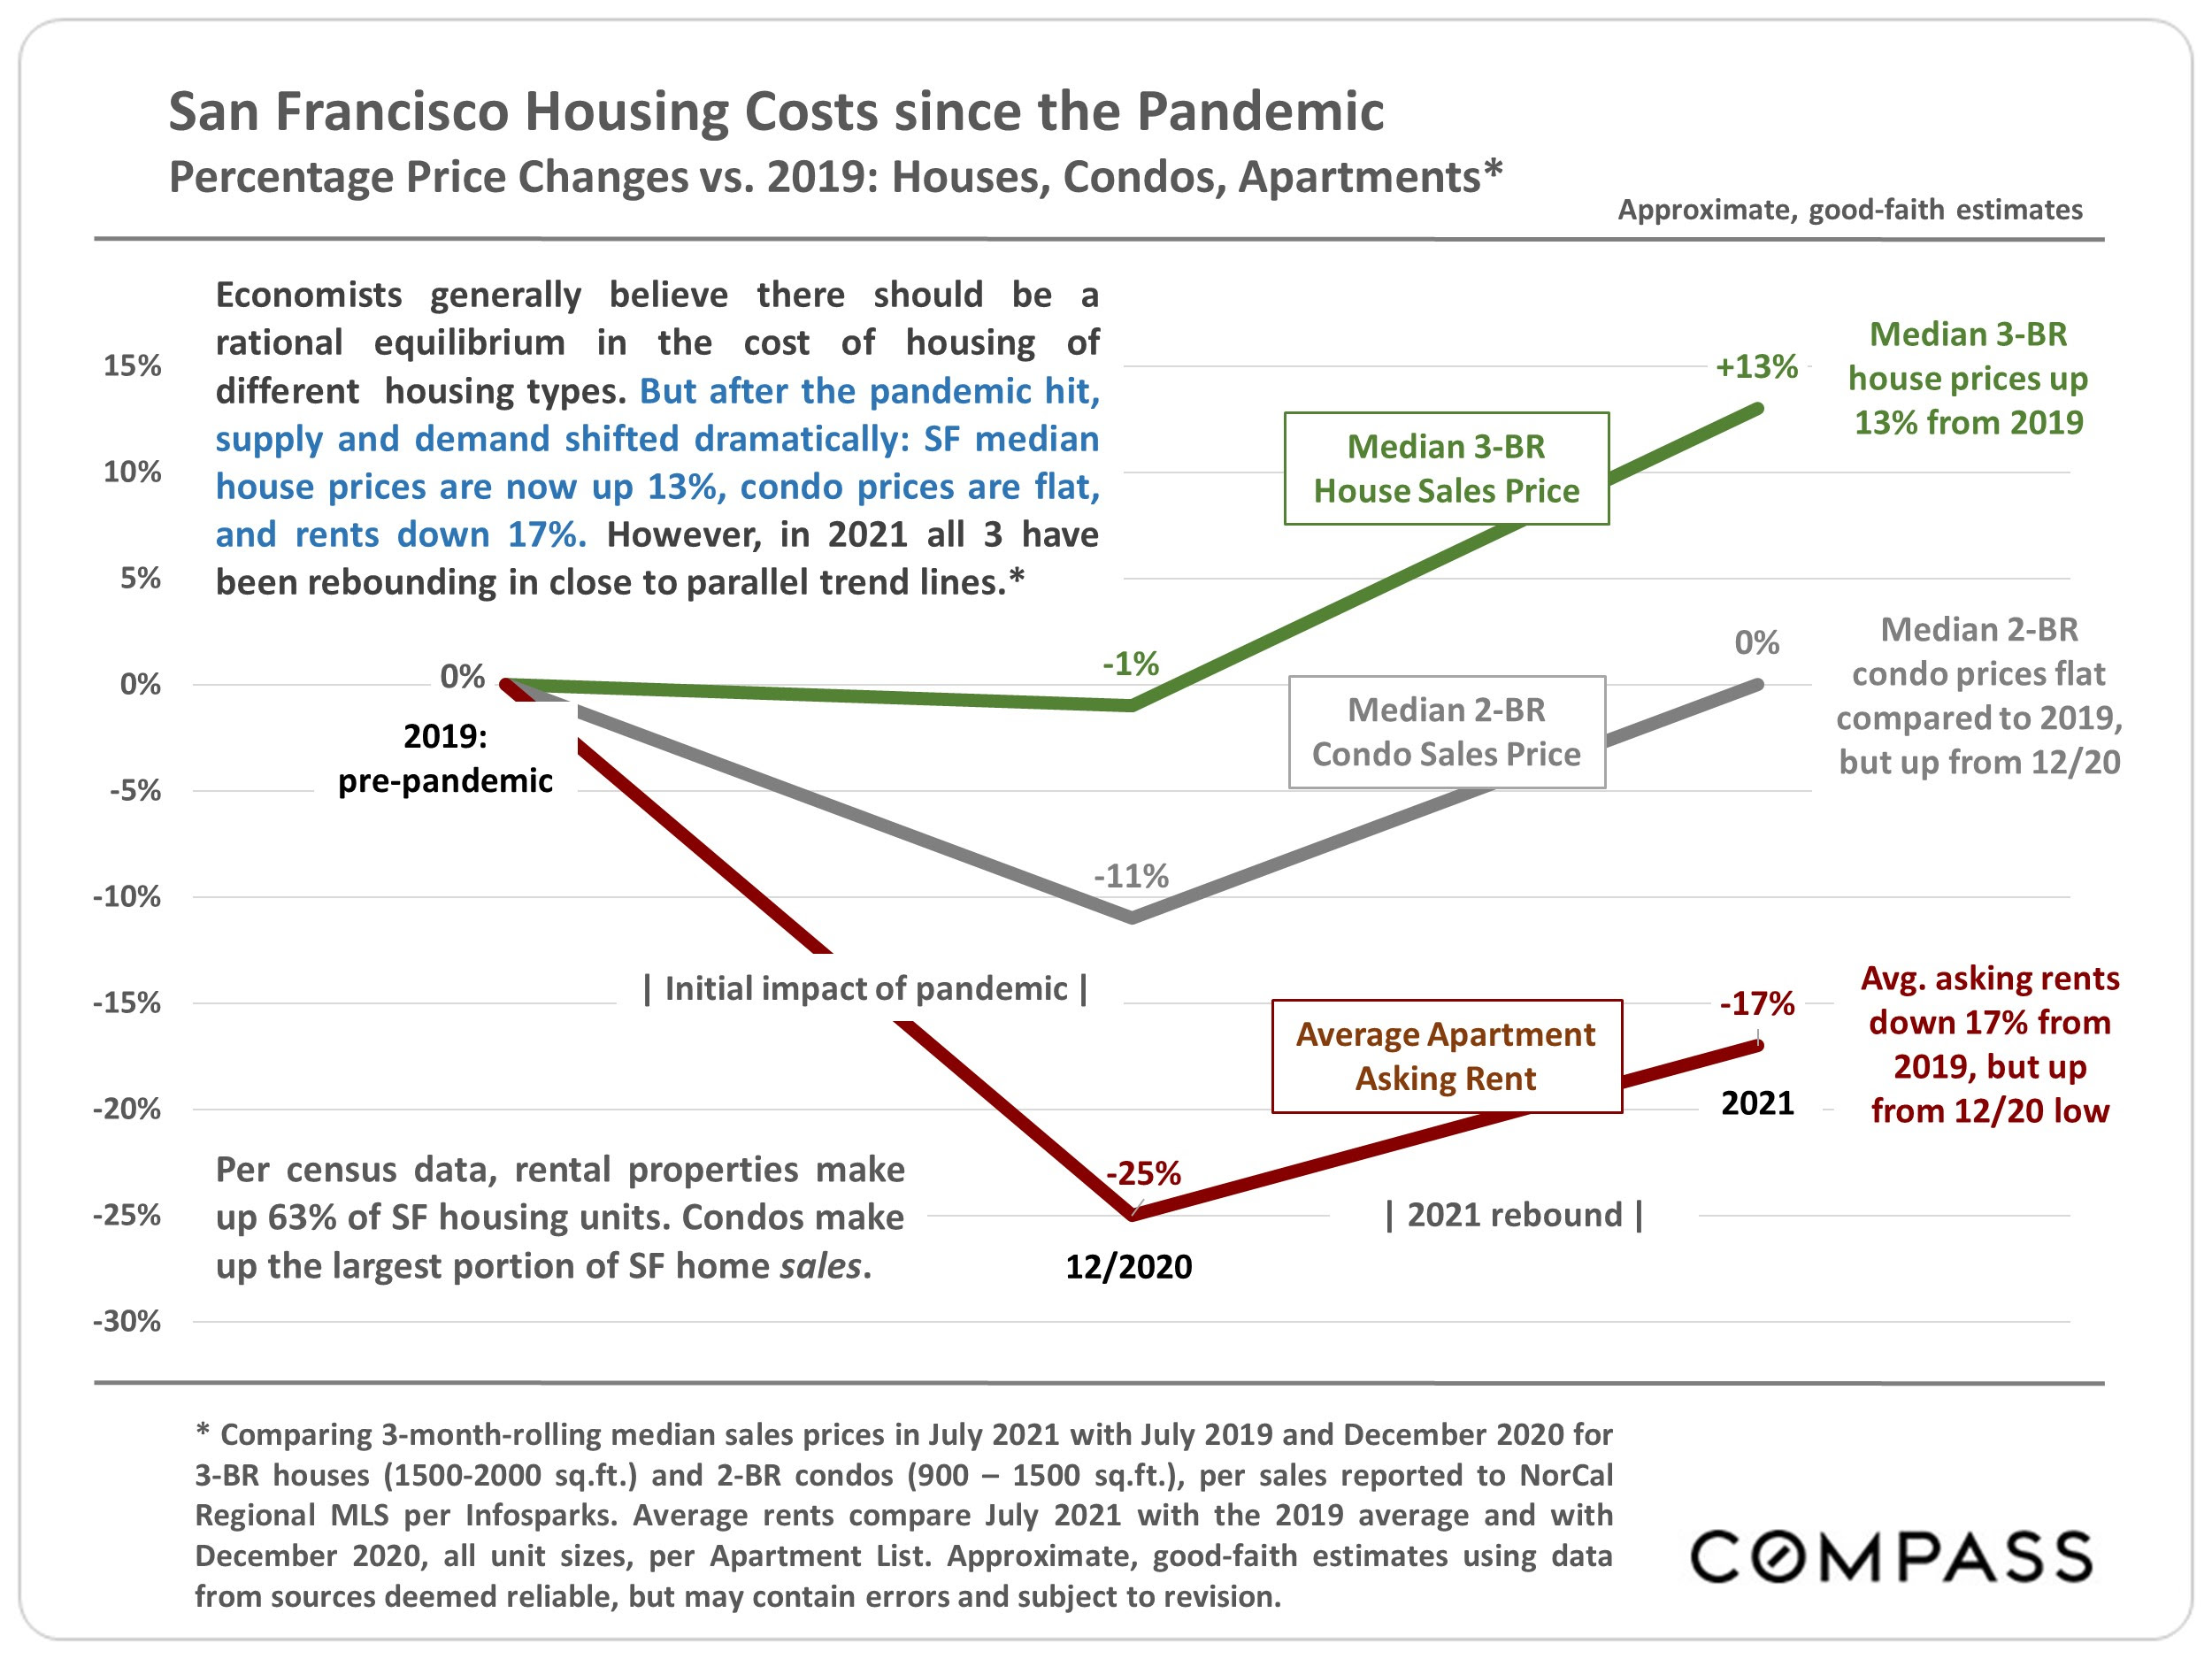
San Francisco housing-cost infographic: house prices up 13%, condo prices flat, and apartment rents down 17% since 2019.
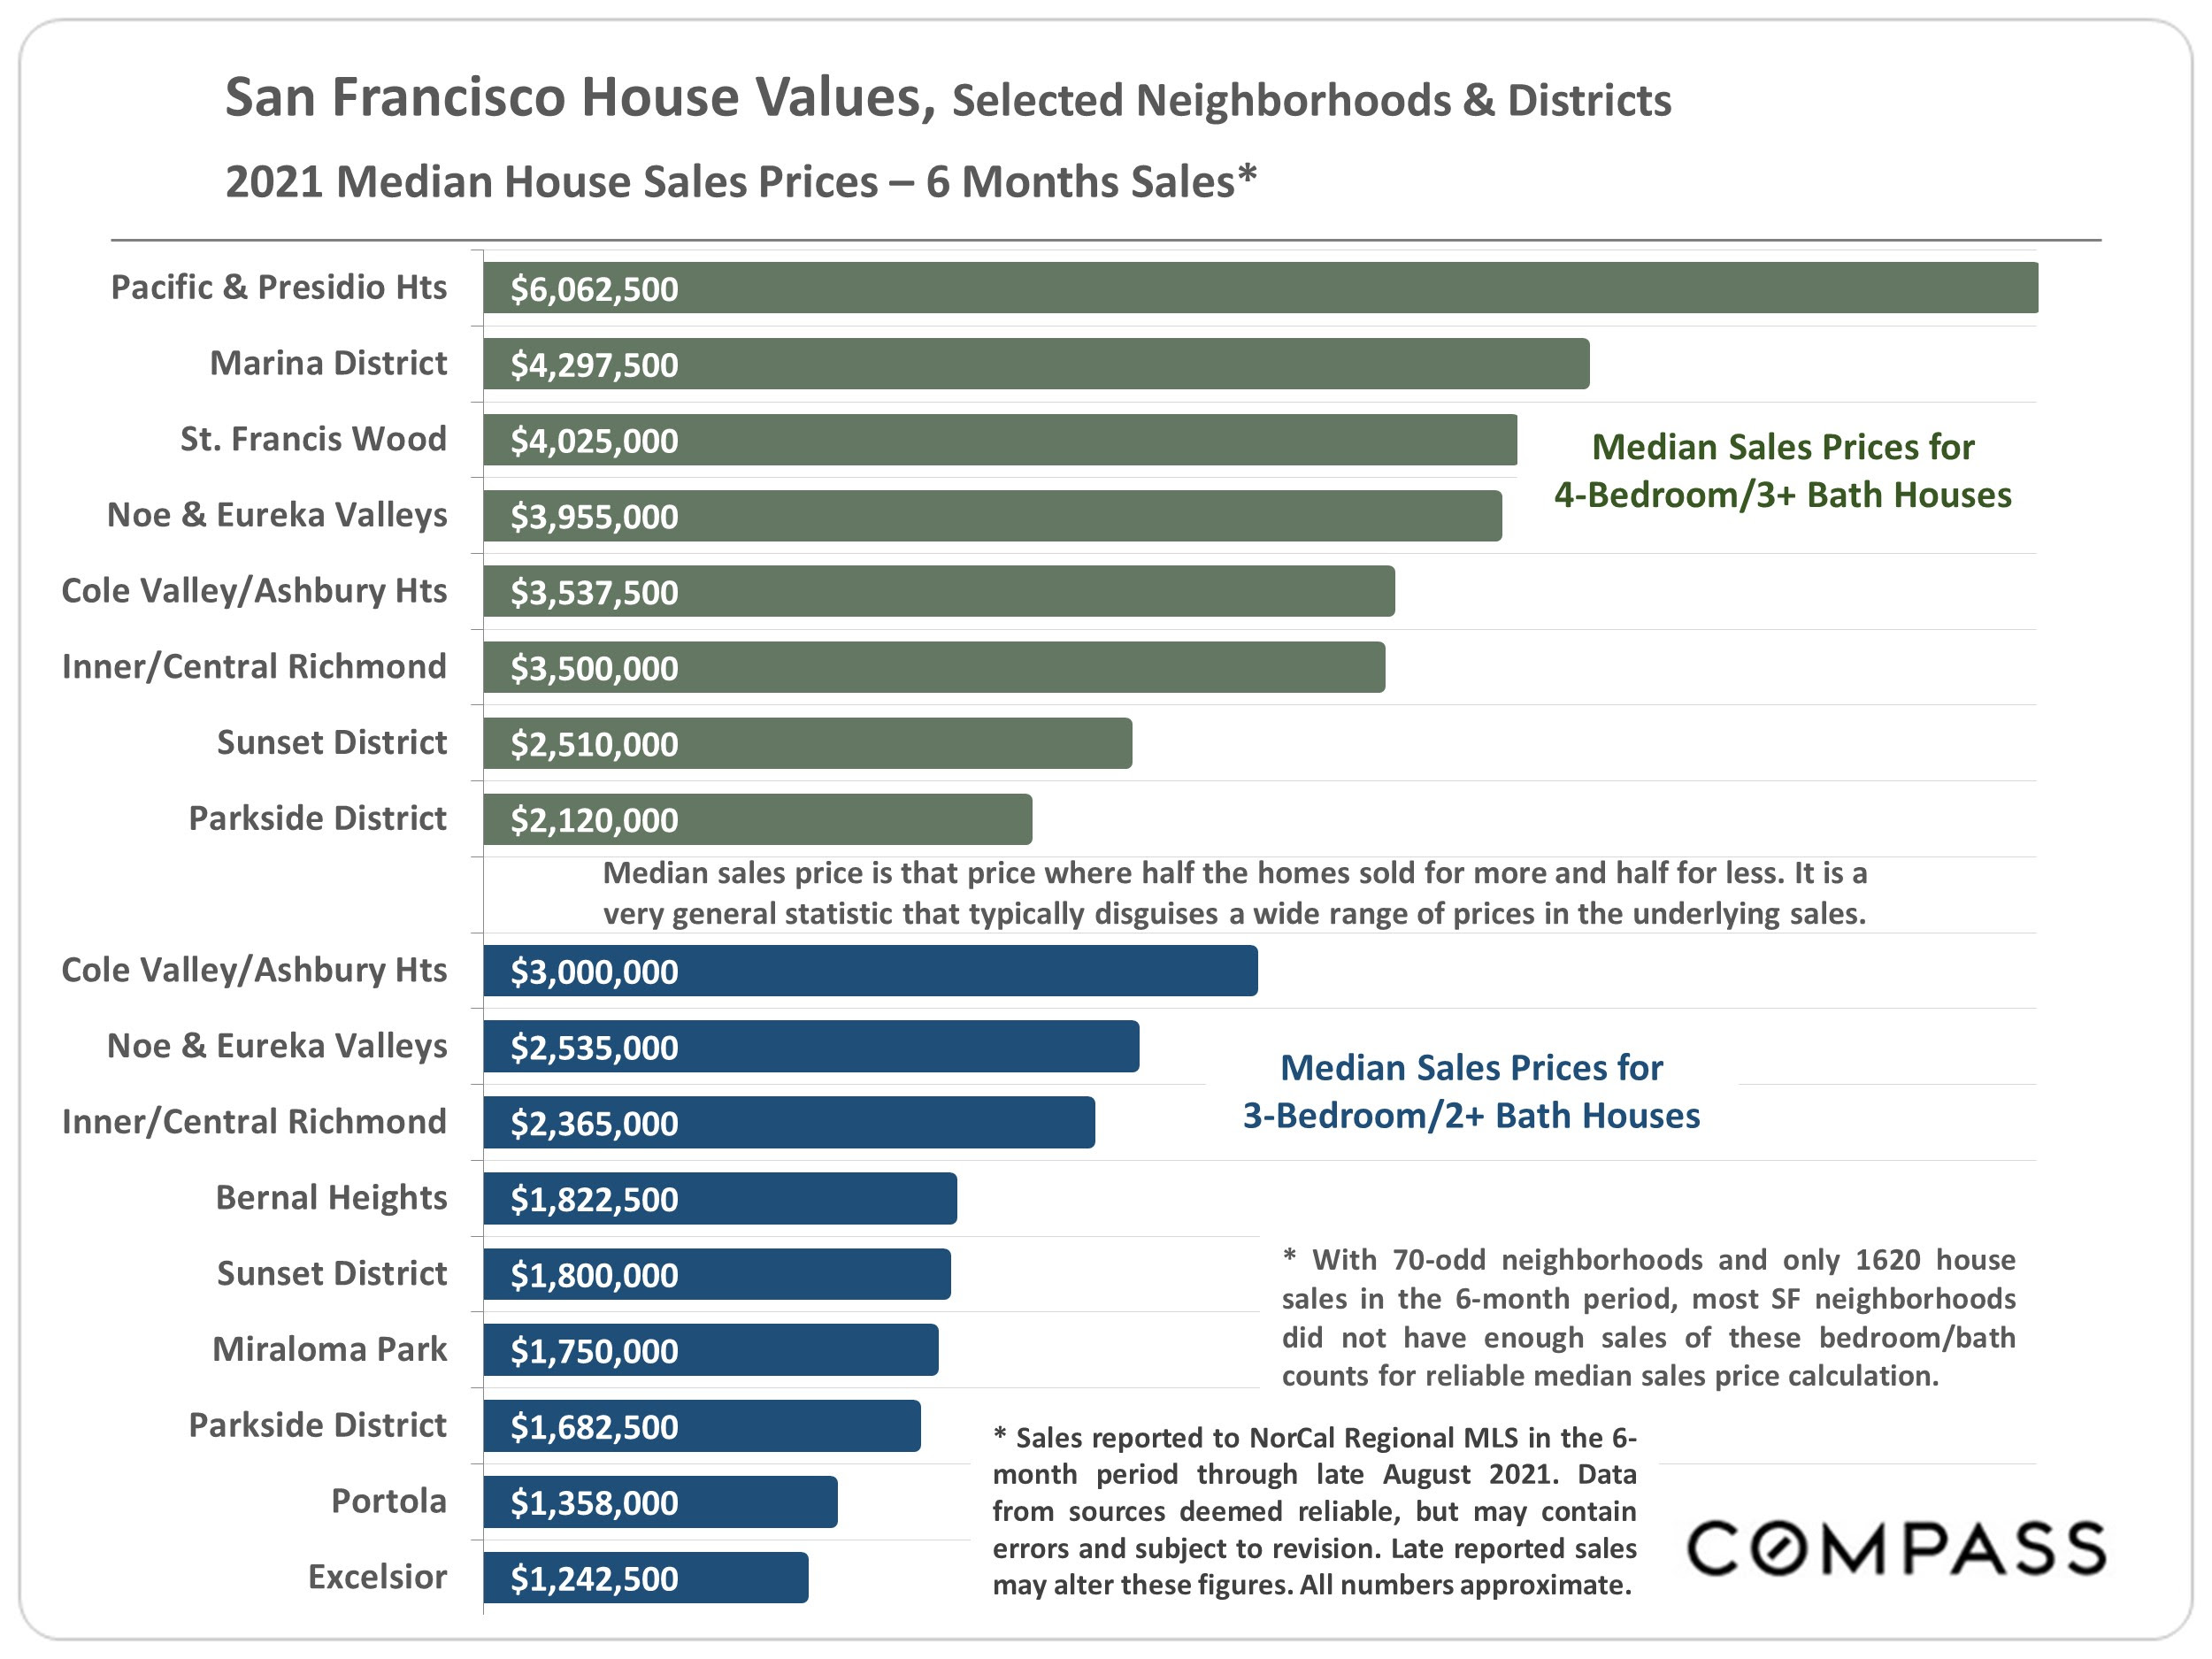
Chart comparing 2021 median San Francisco house prices by neighborhood for four- and three-bedroom homes.
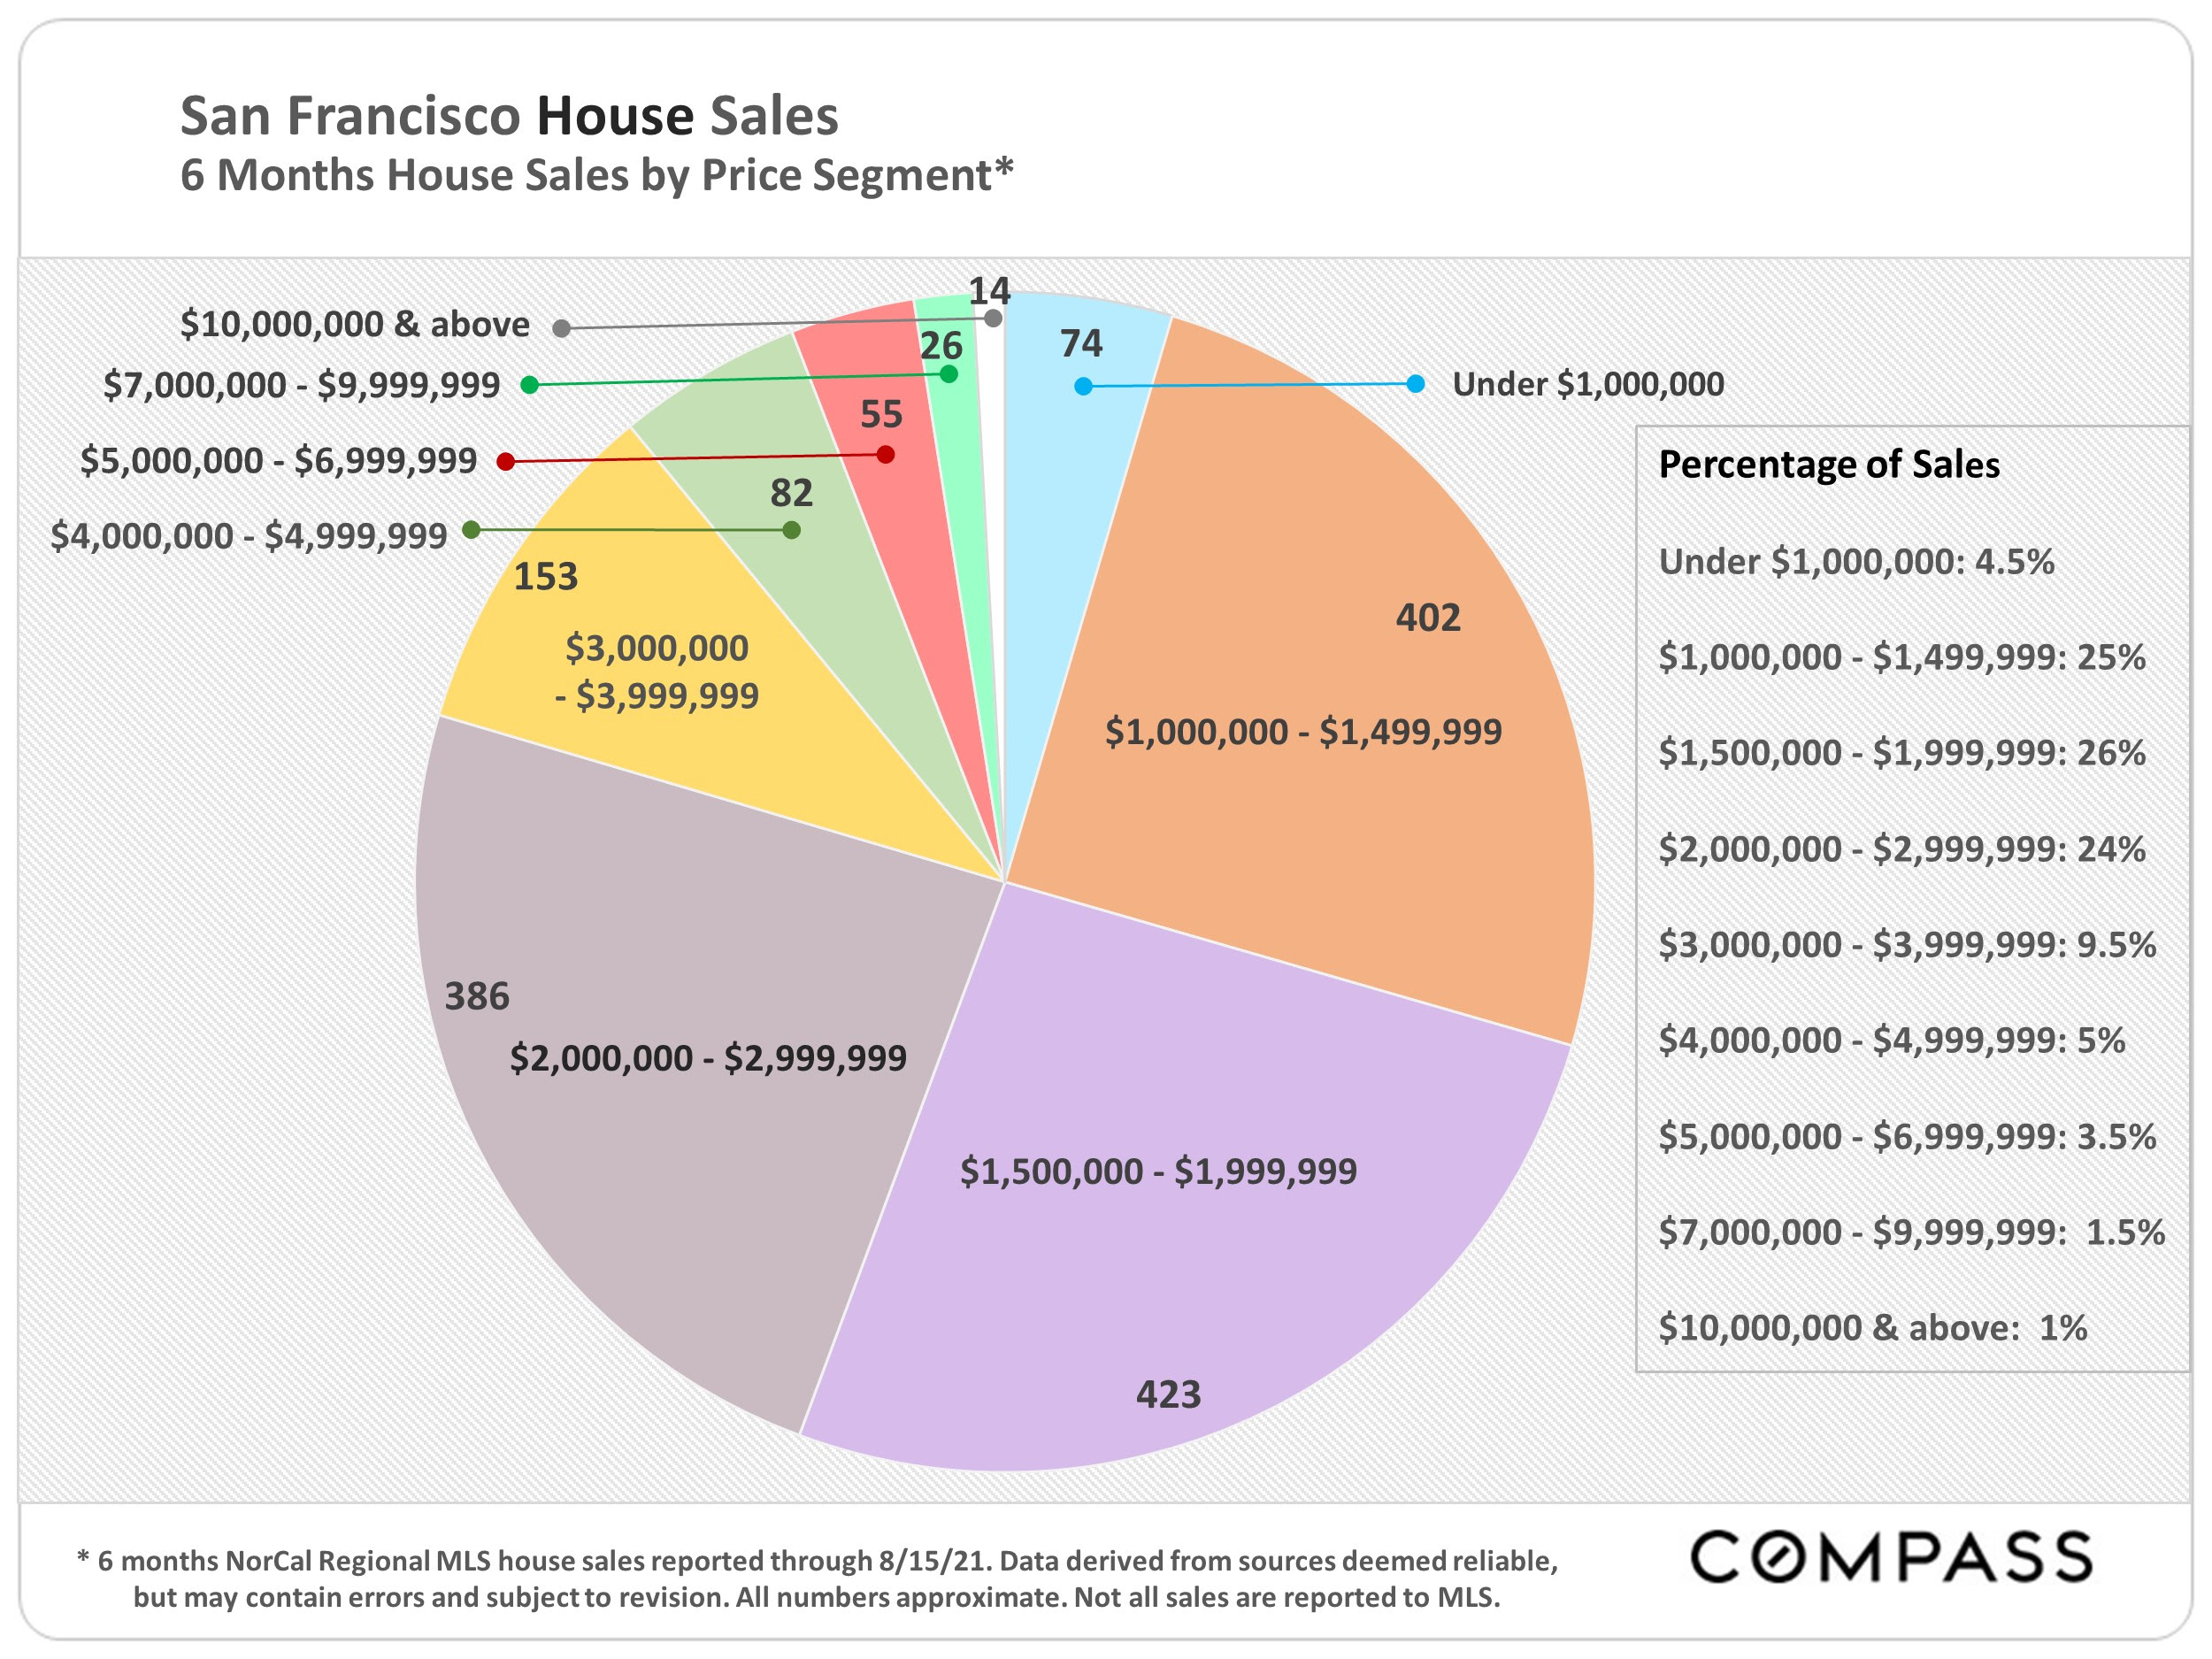
Pie chart of six months of San Francisco house sales by price range, with sales counts and percentages.
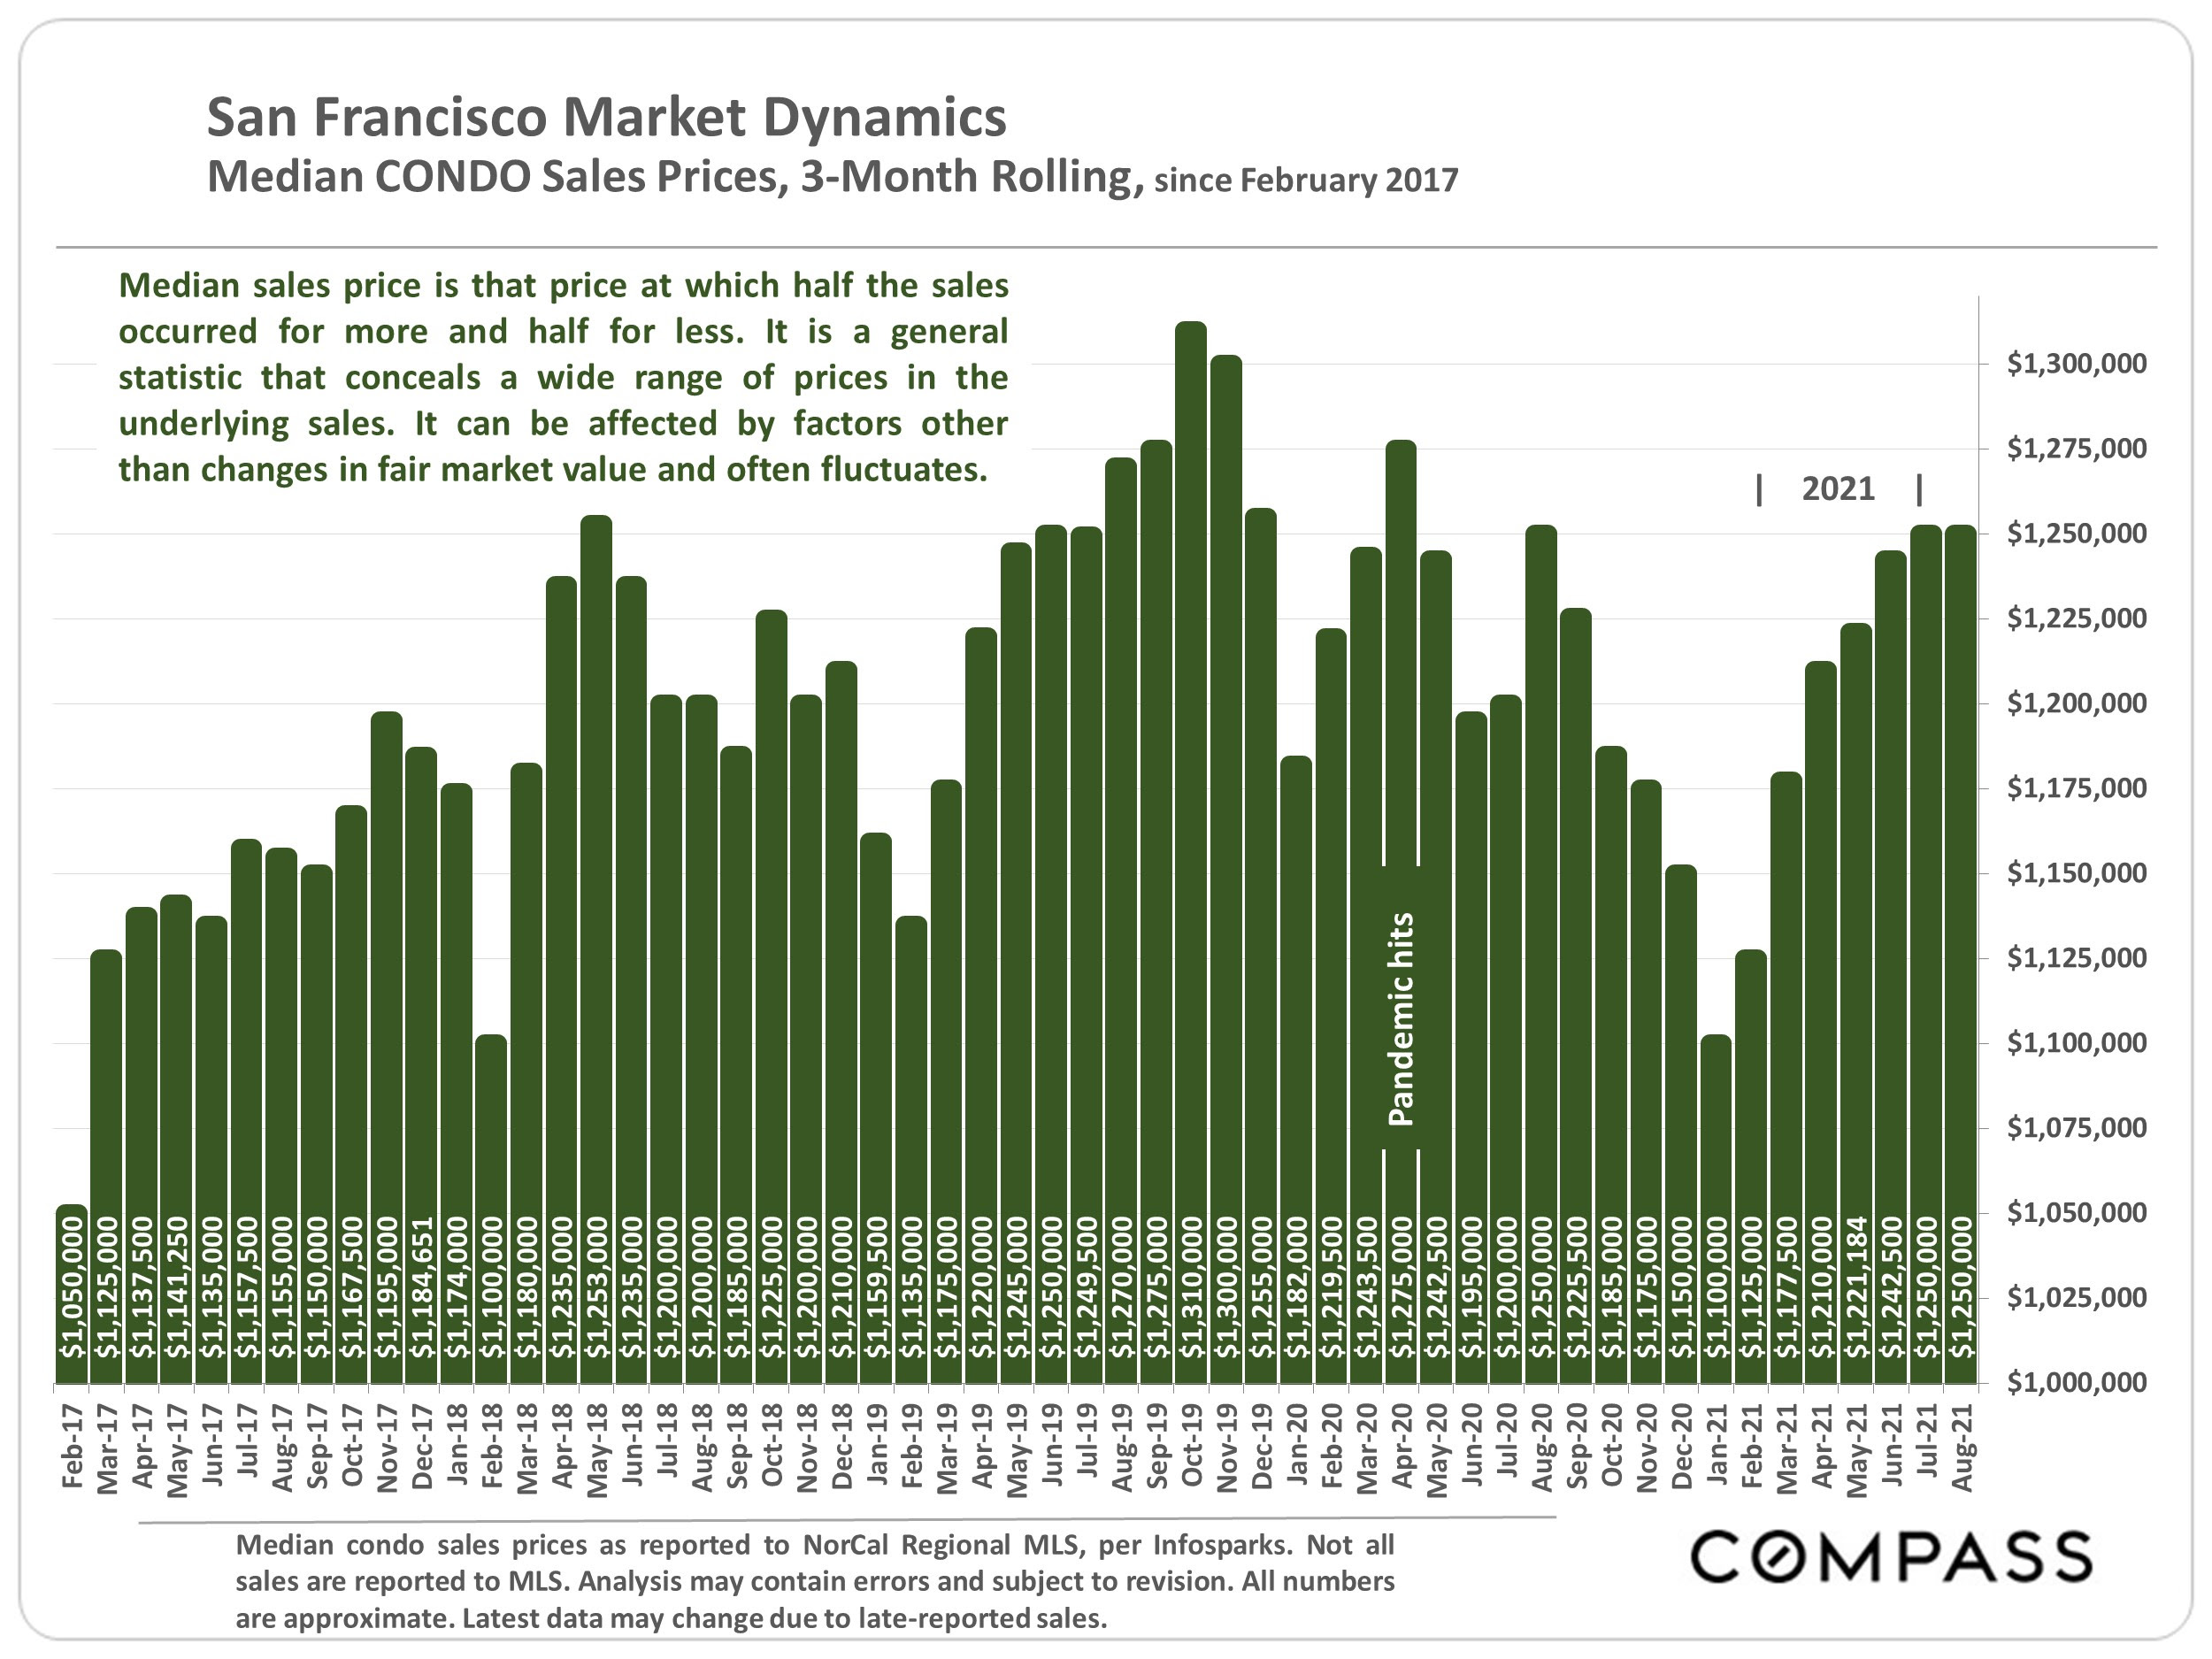
Chart of San Francisco median condo sale prices from February 2017 to August 2021, with a pandemic marker.
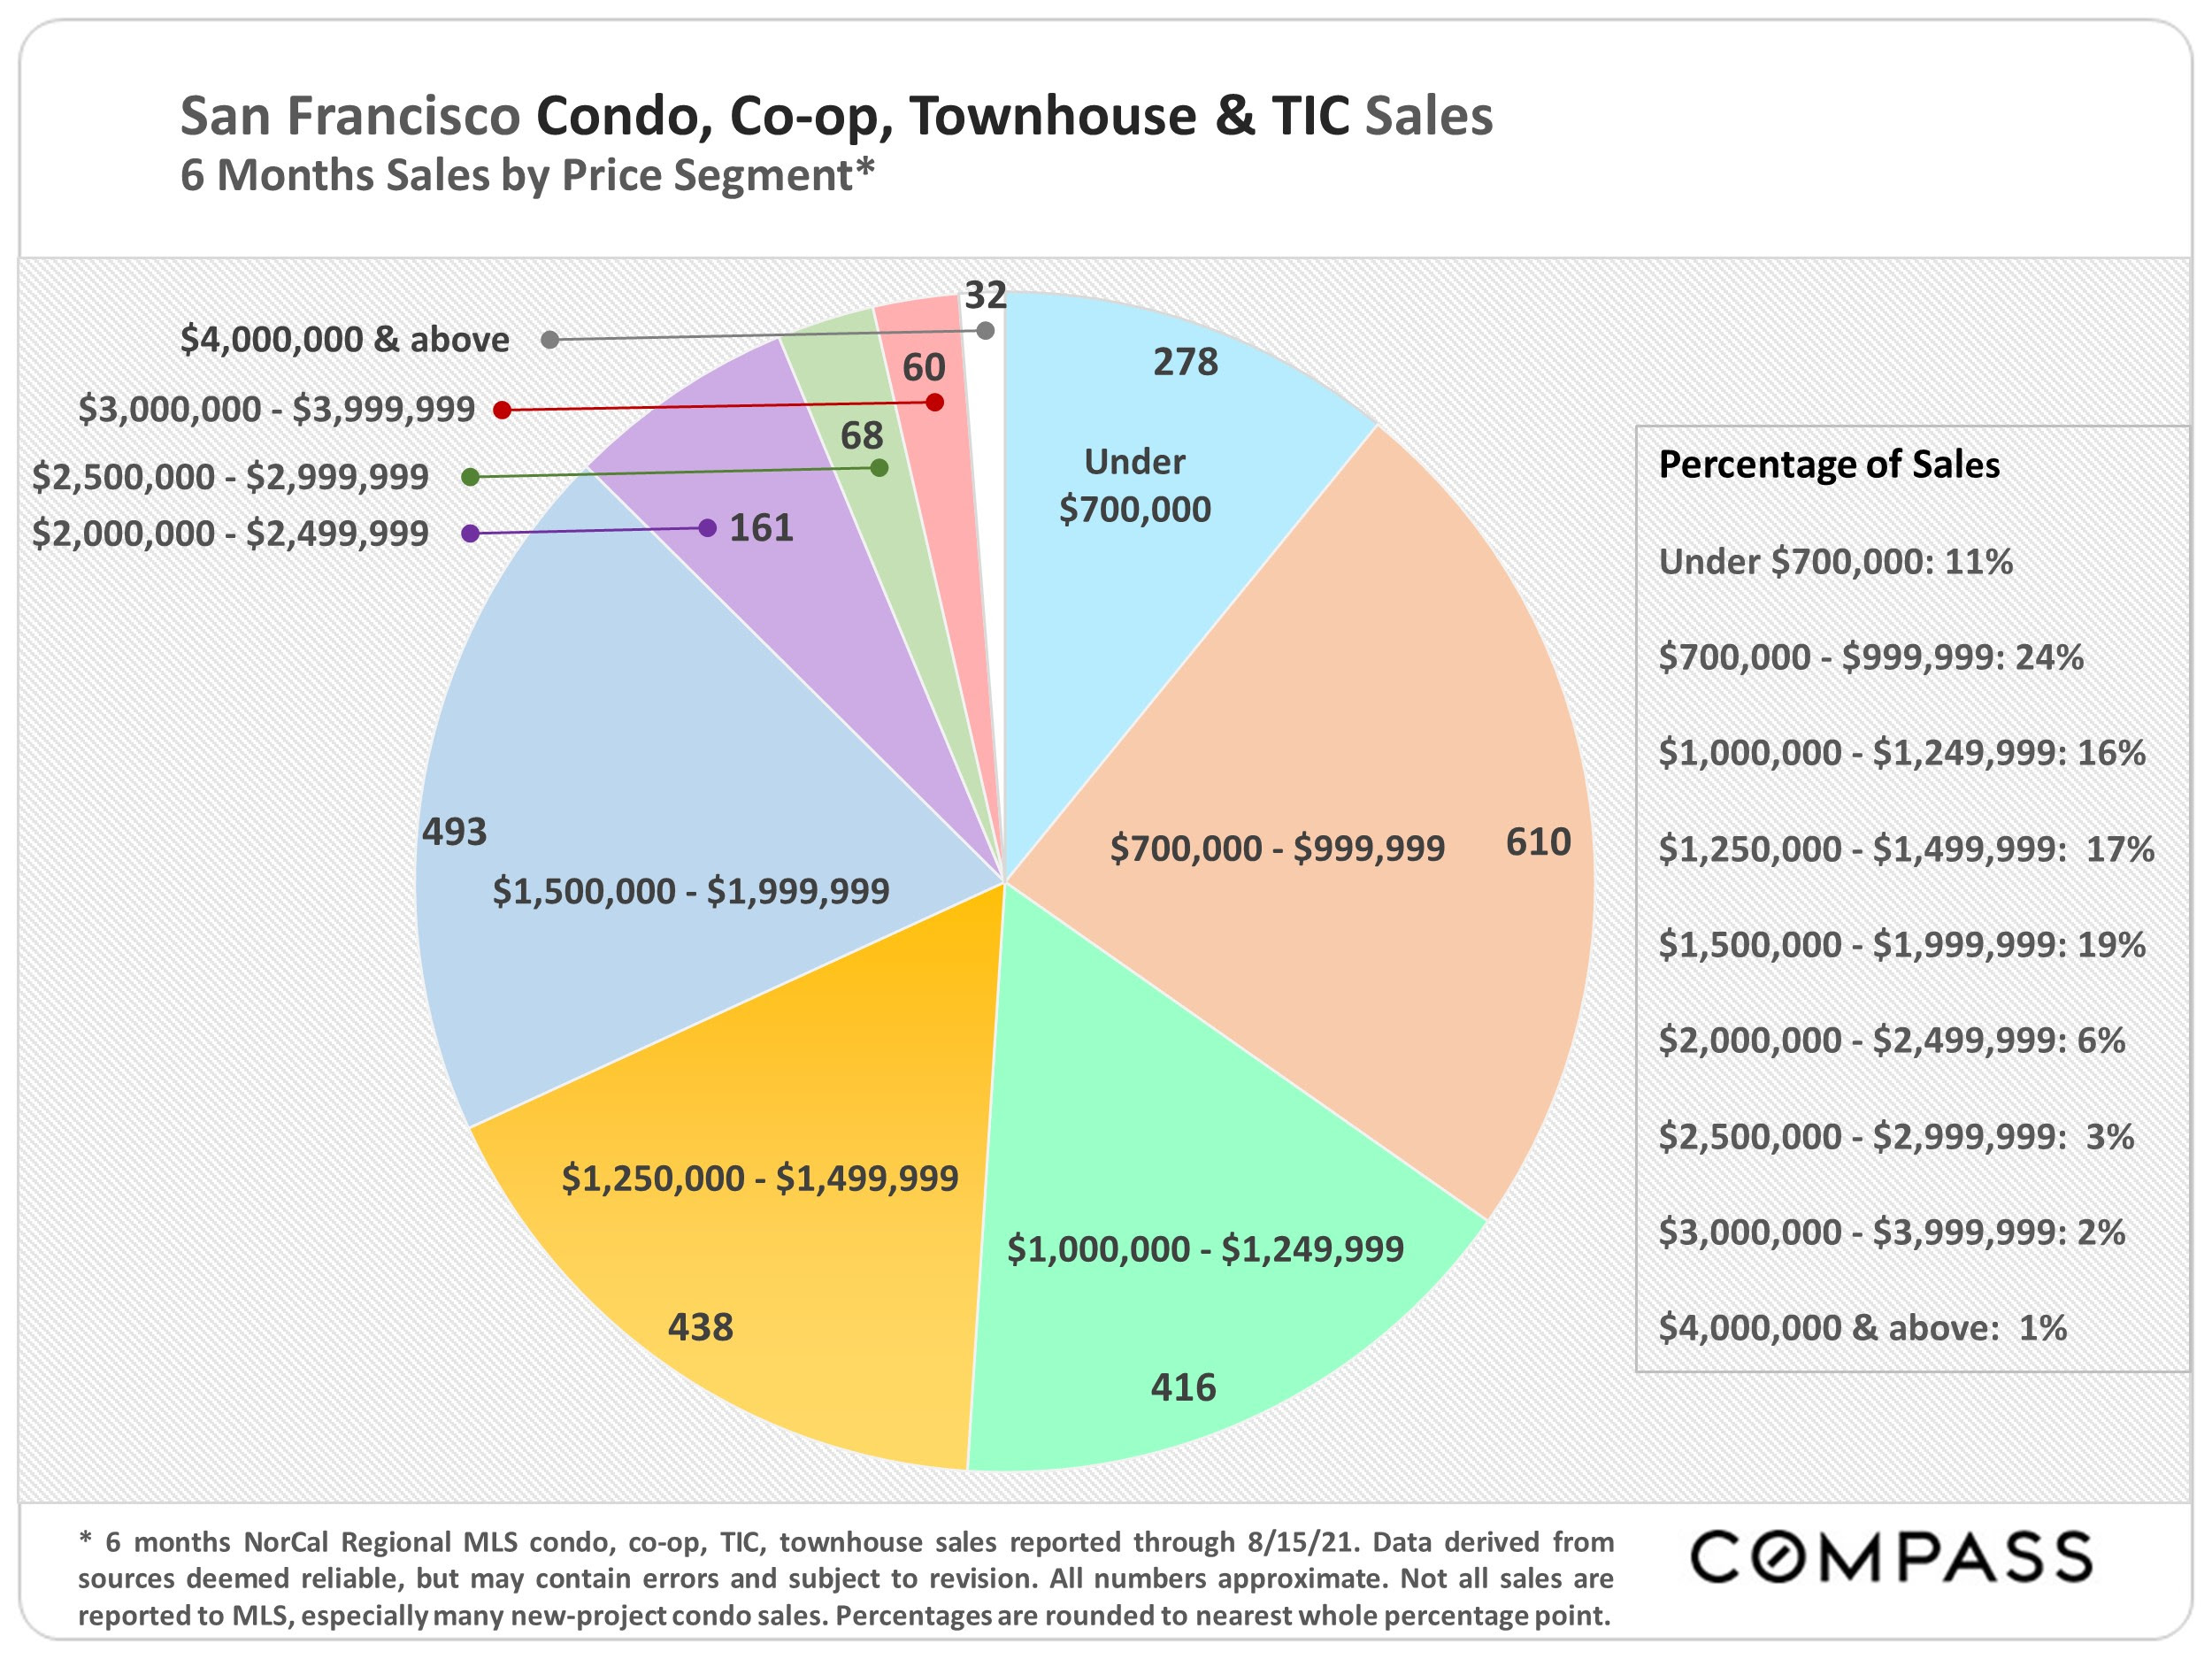
San Francisco home sales by price segment, shown as a pie chart with counts and percentages.
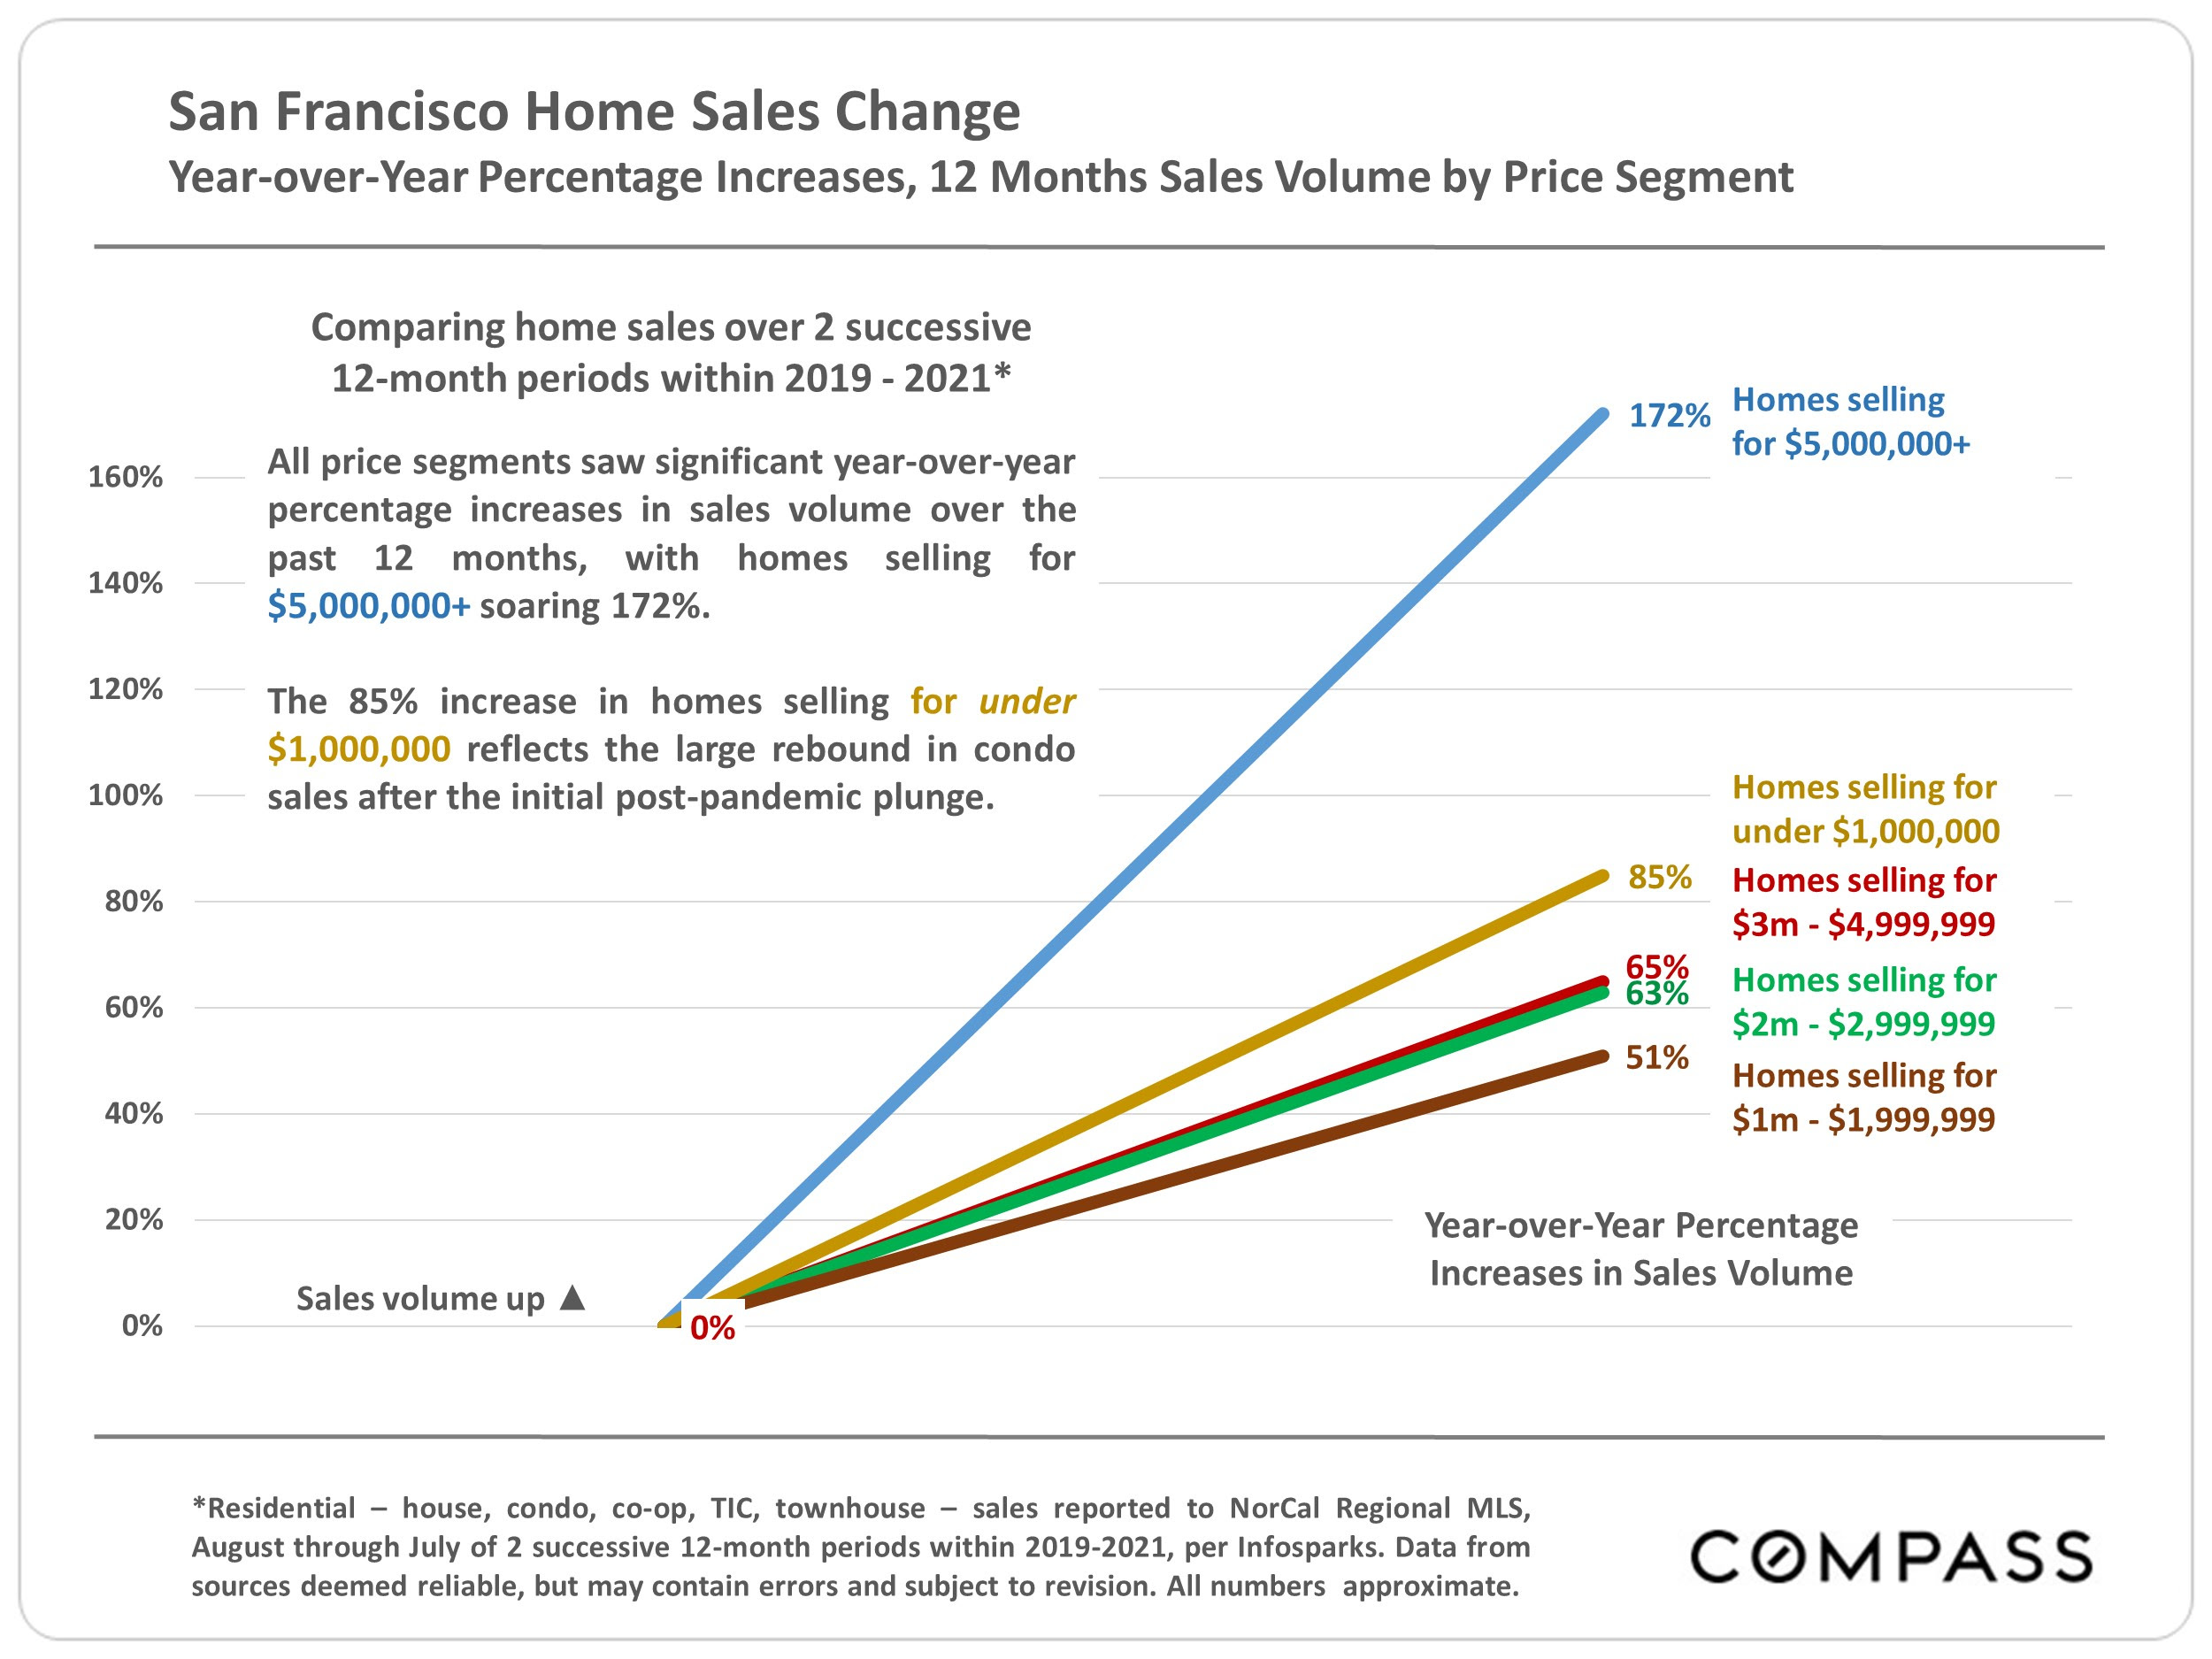
San Francisco home sales chart: increases range from 51% for $1–1.99 million homes to 172% for $5 million-plus homes.
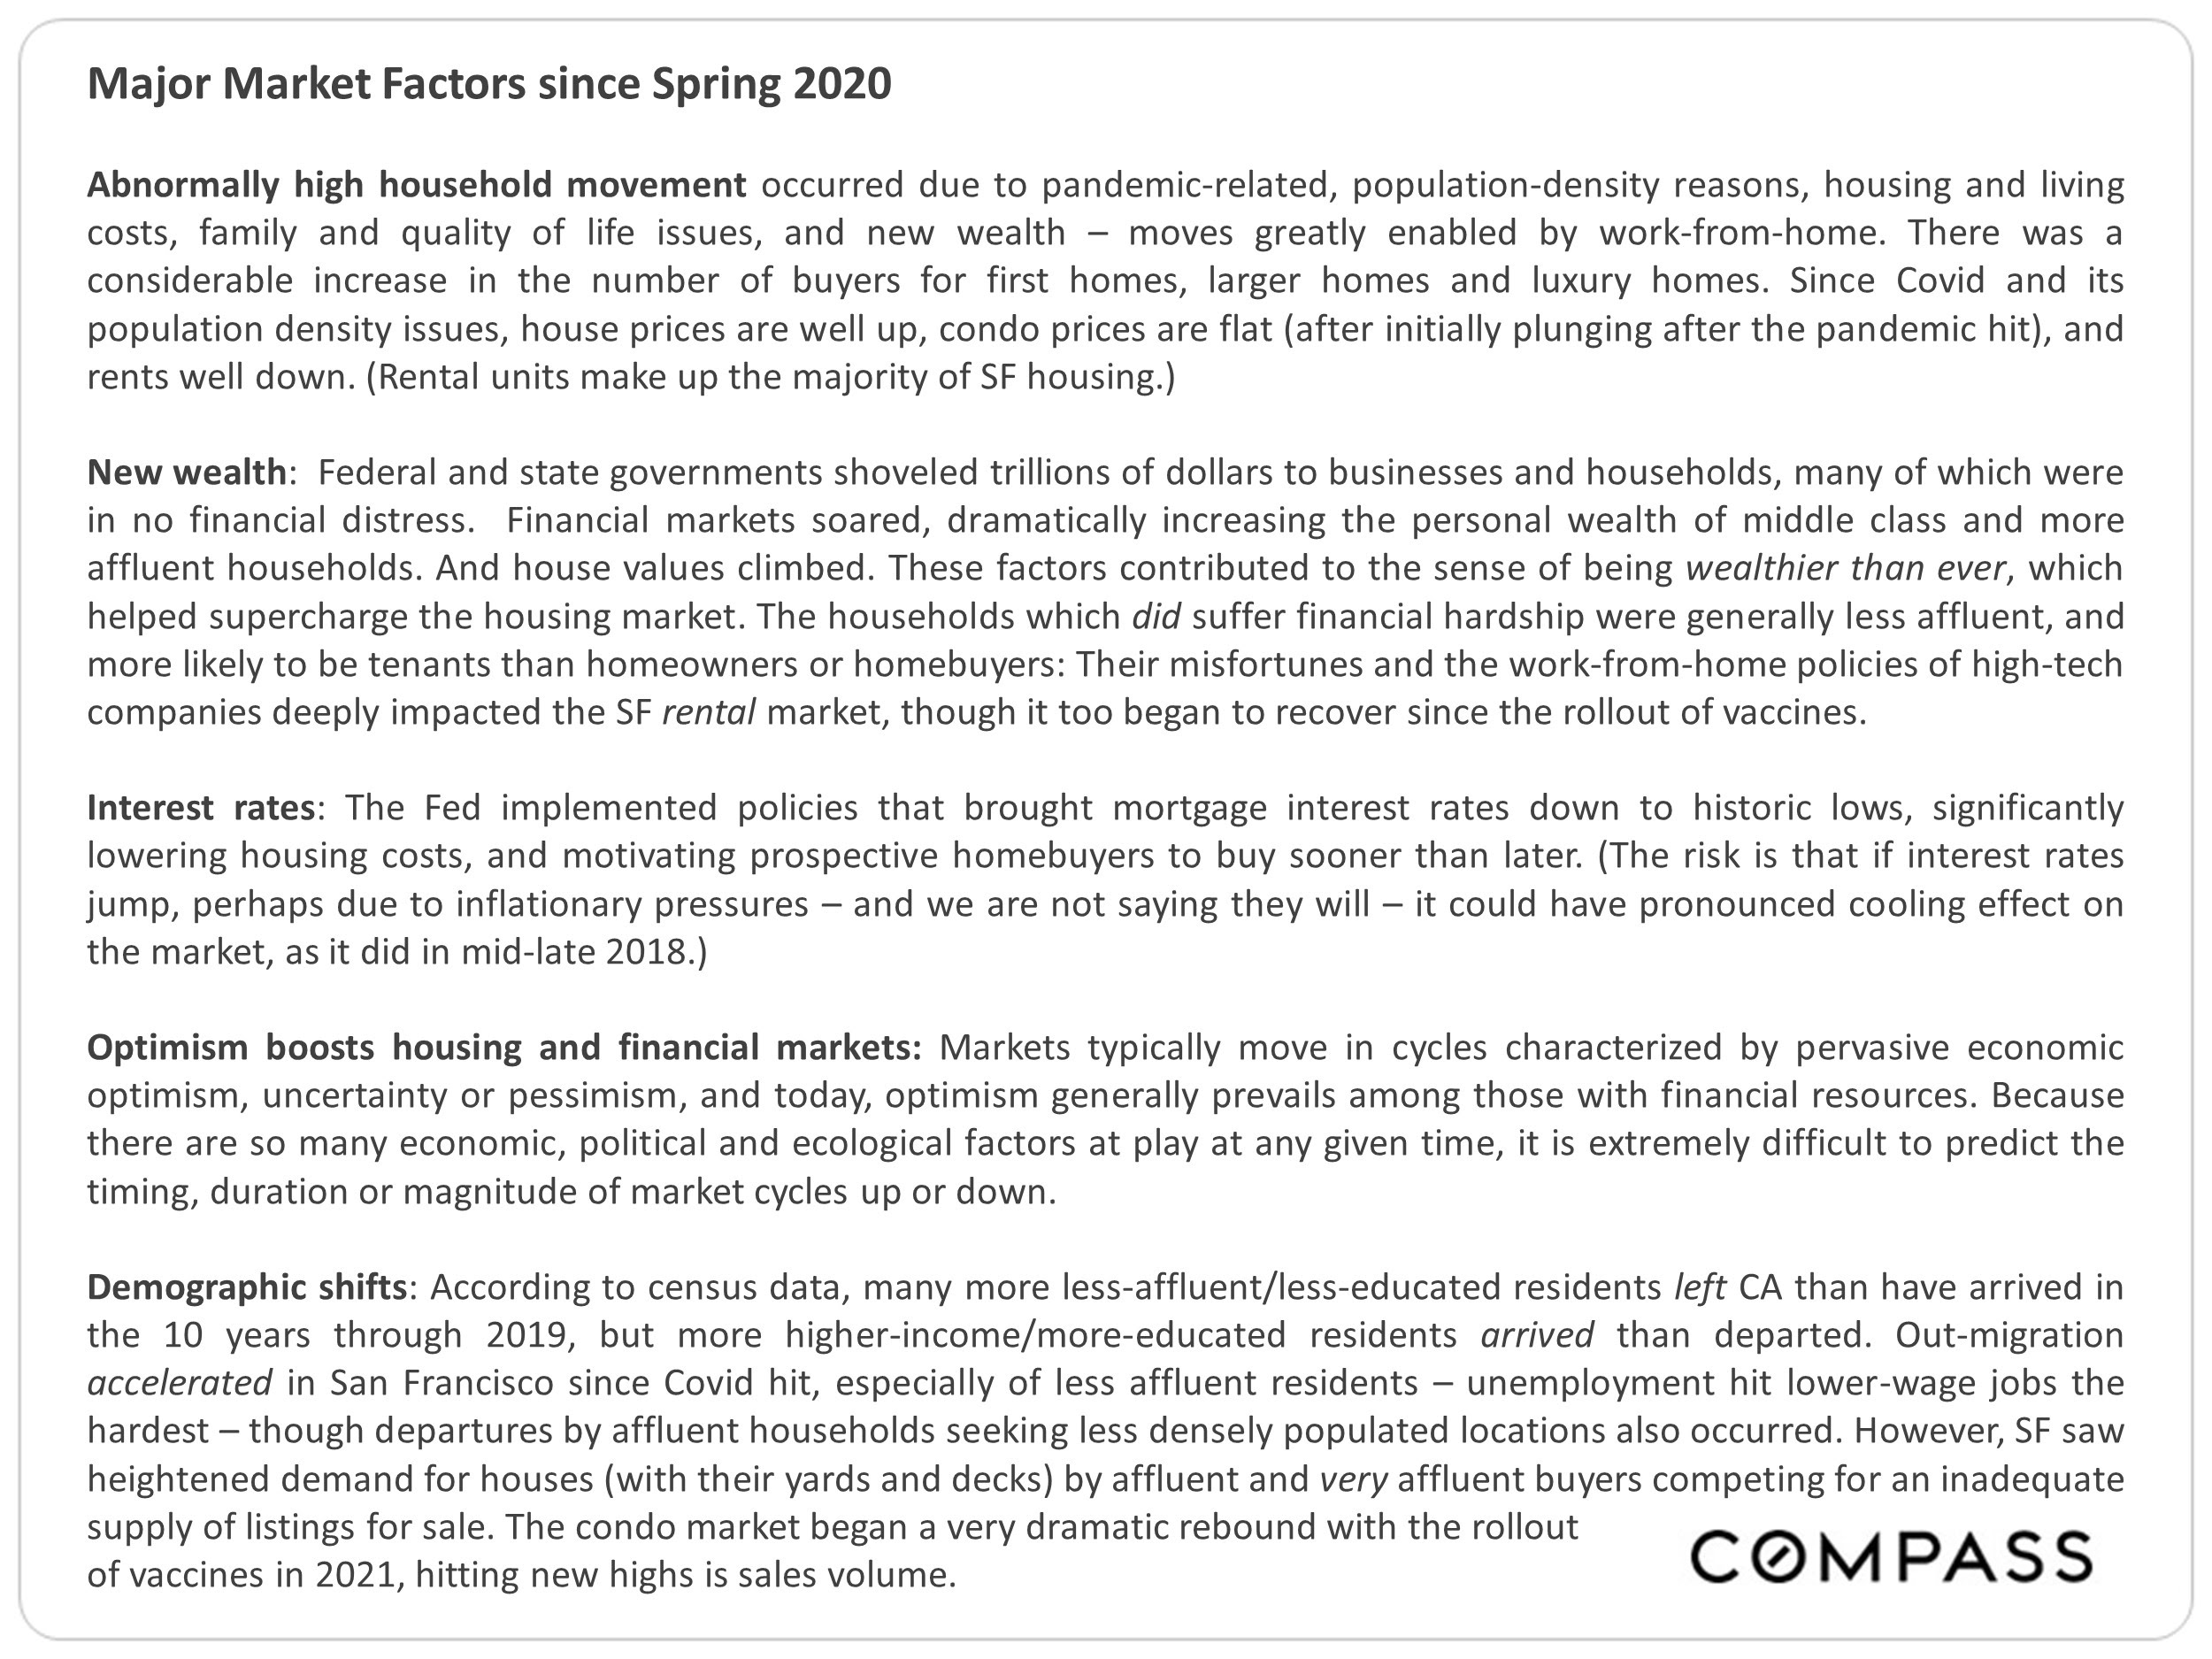
Graphic summarizing major San Francisco housing market factors since spring 2020, with Compass branding.
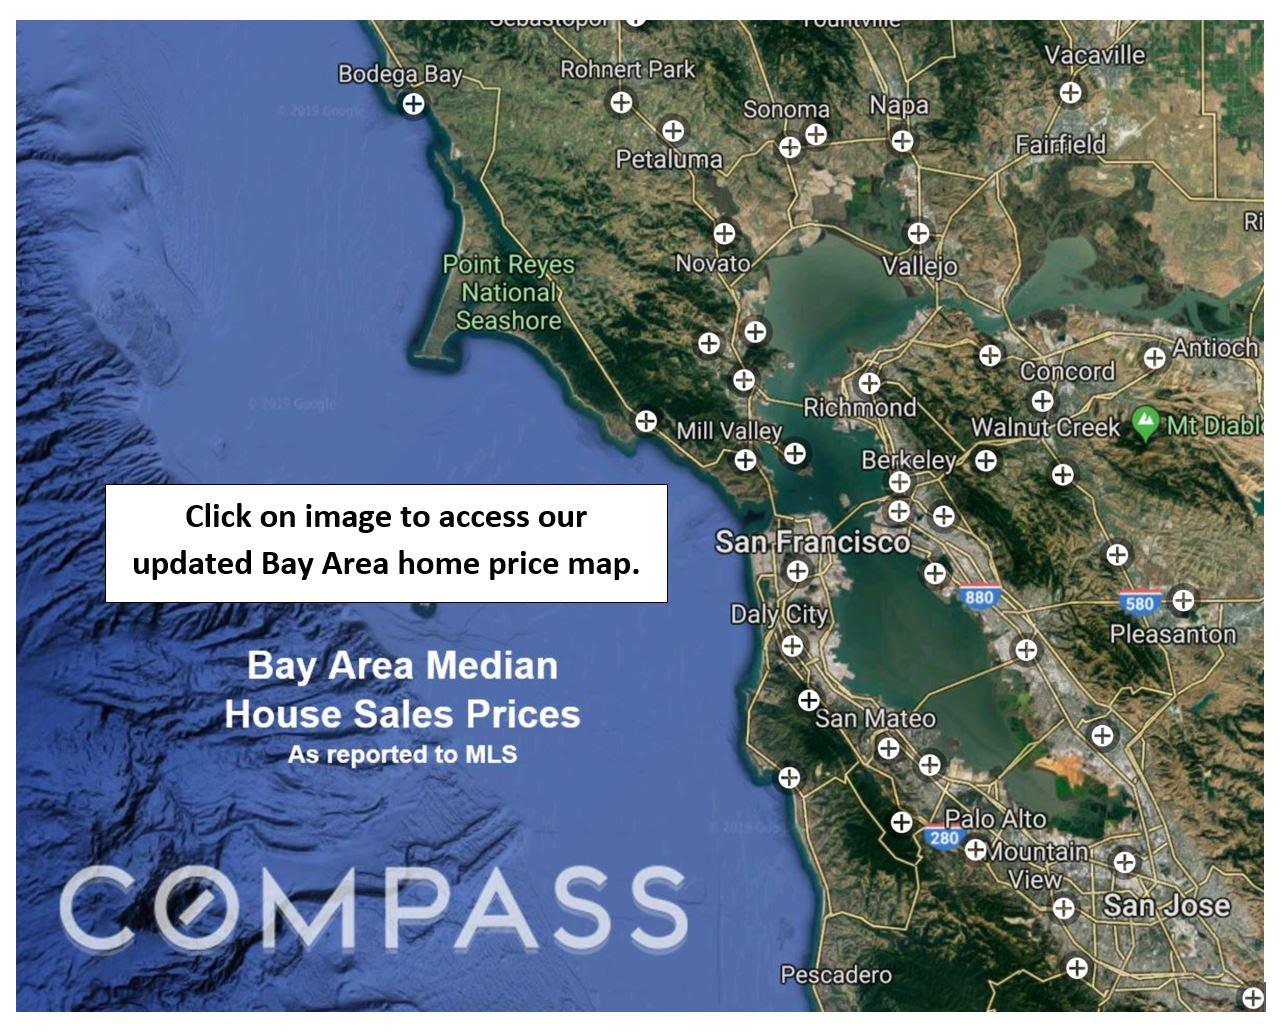
Compass Bay Area median house sales prices map, with markers across the San Francisco Bay Area.
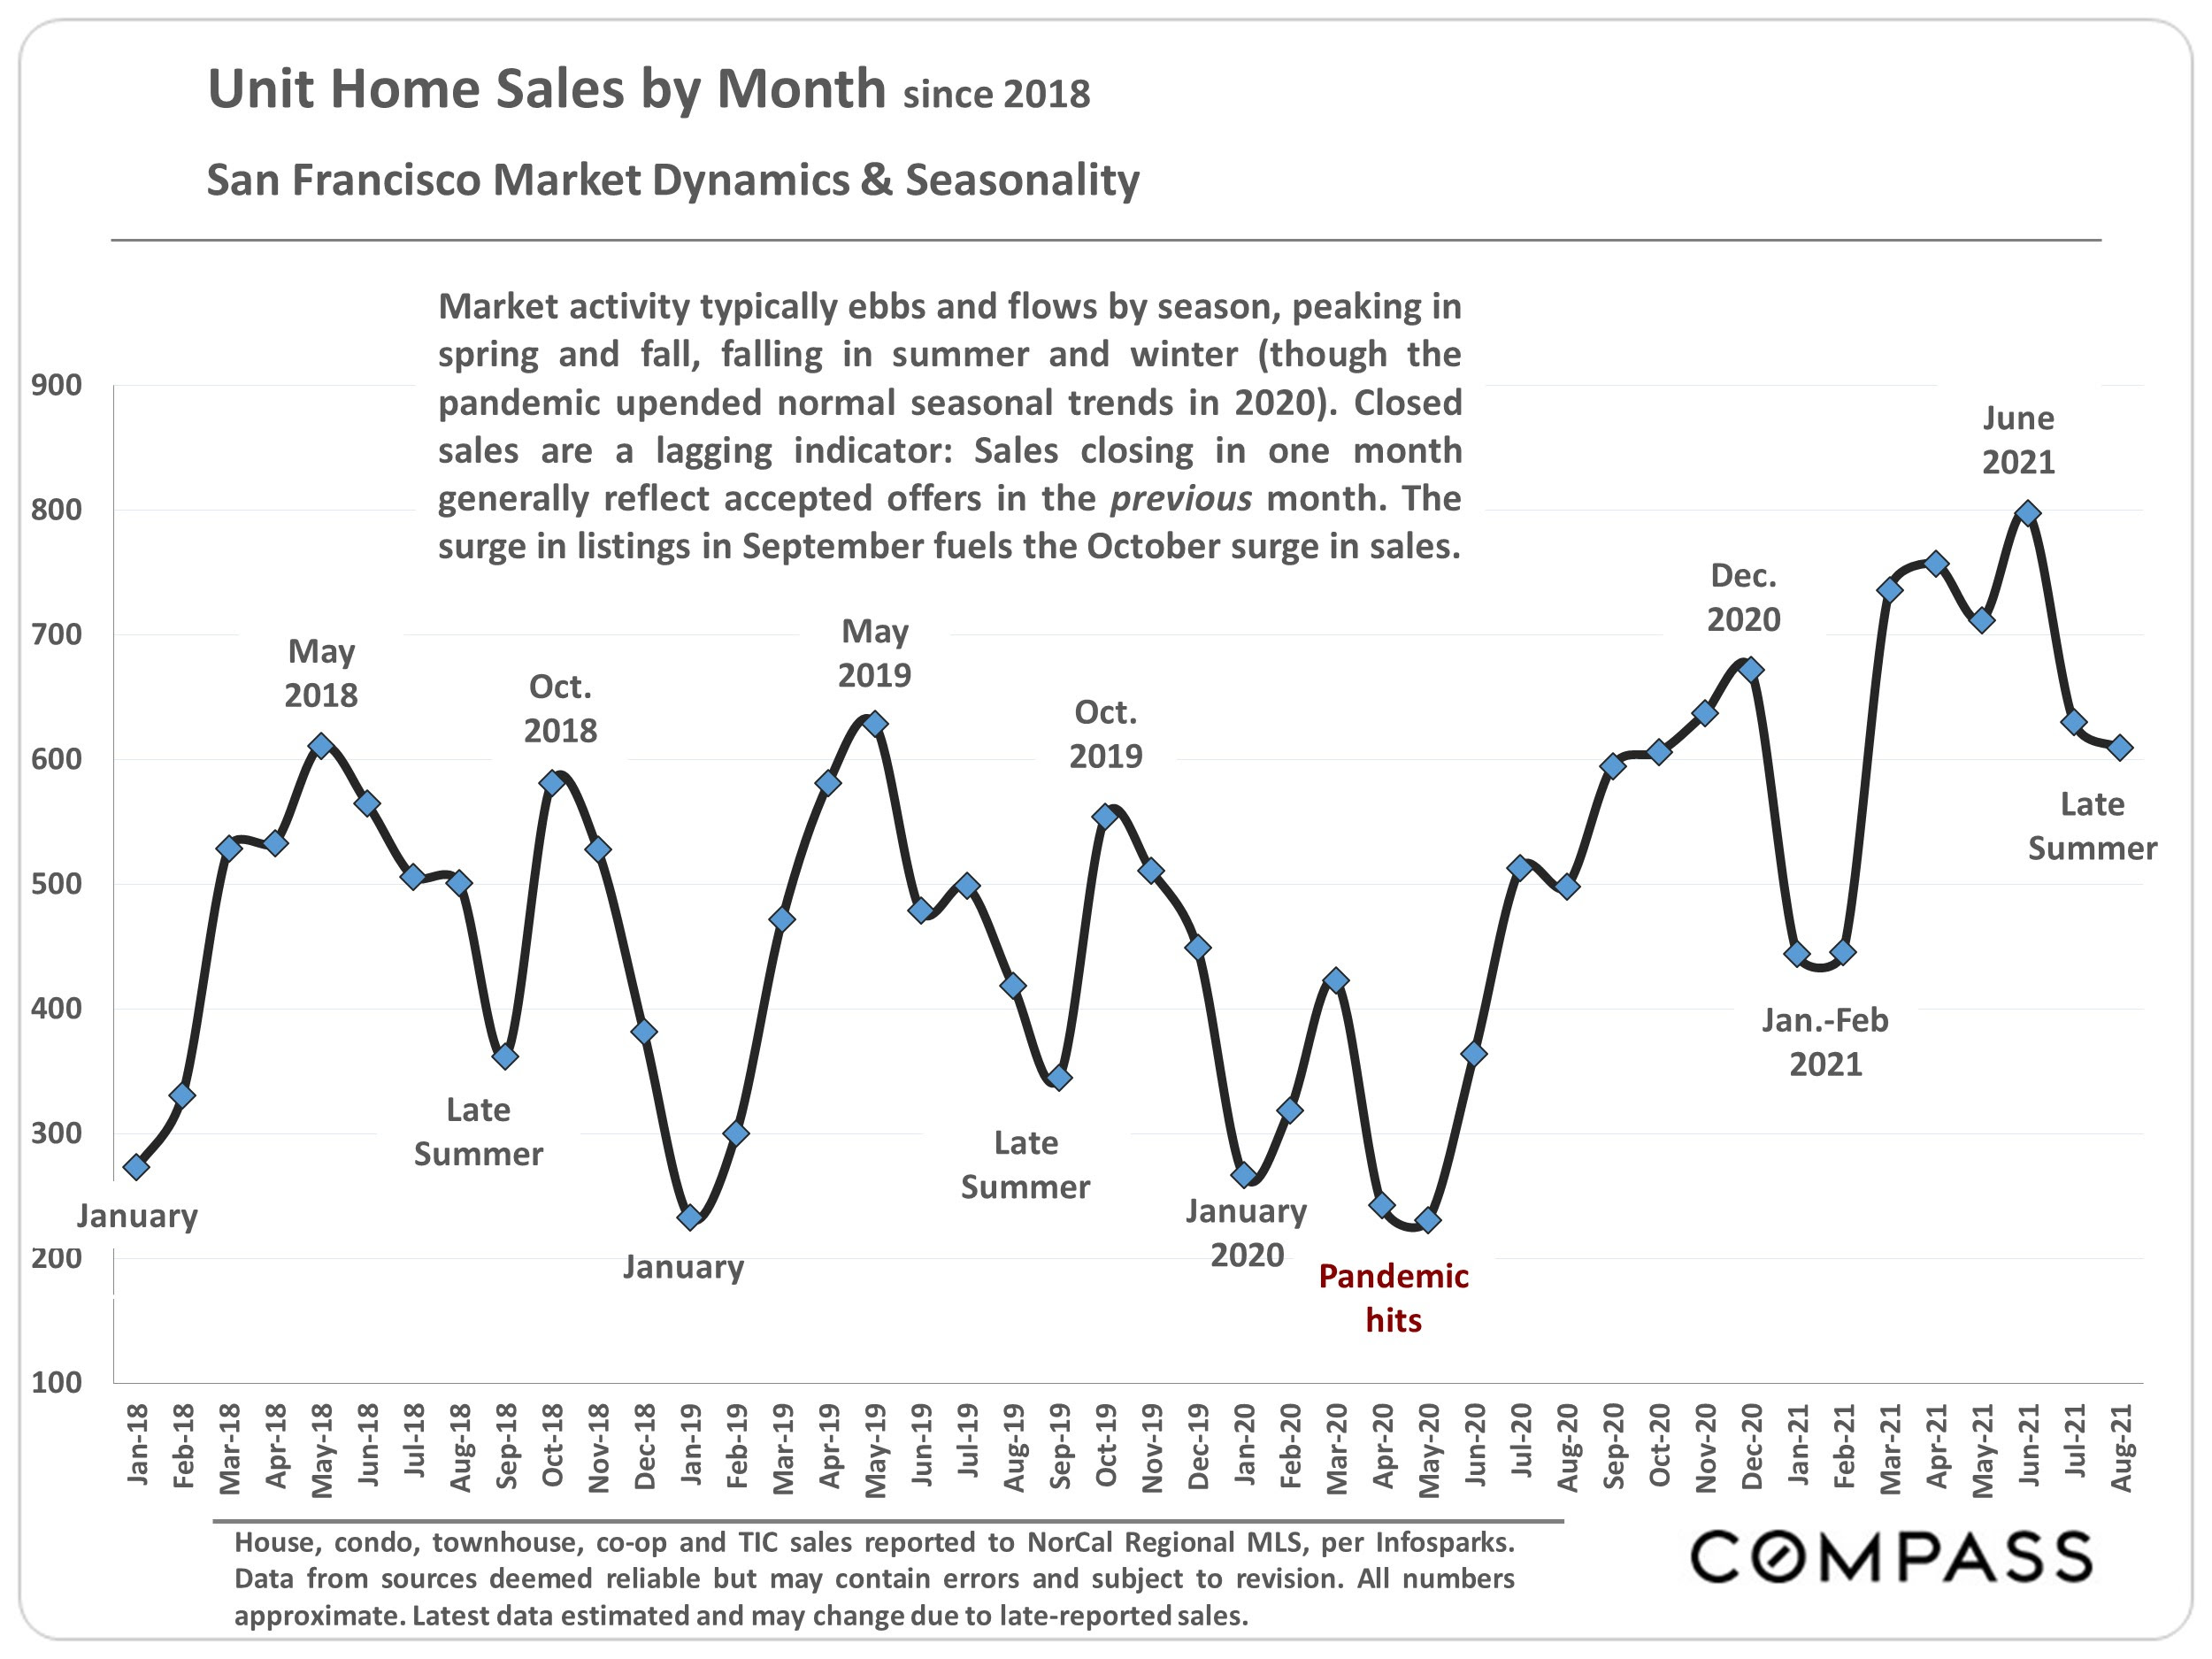
Chart of San Francisco monthly home sales from 2018 to 2021, with seasonal trends and pandemic-related changes.
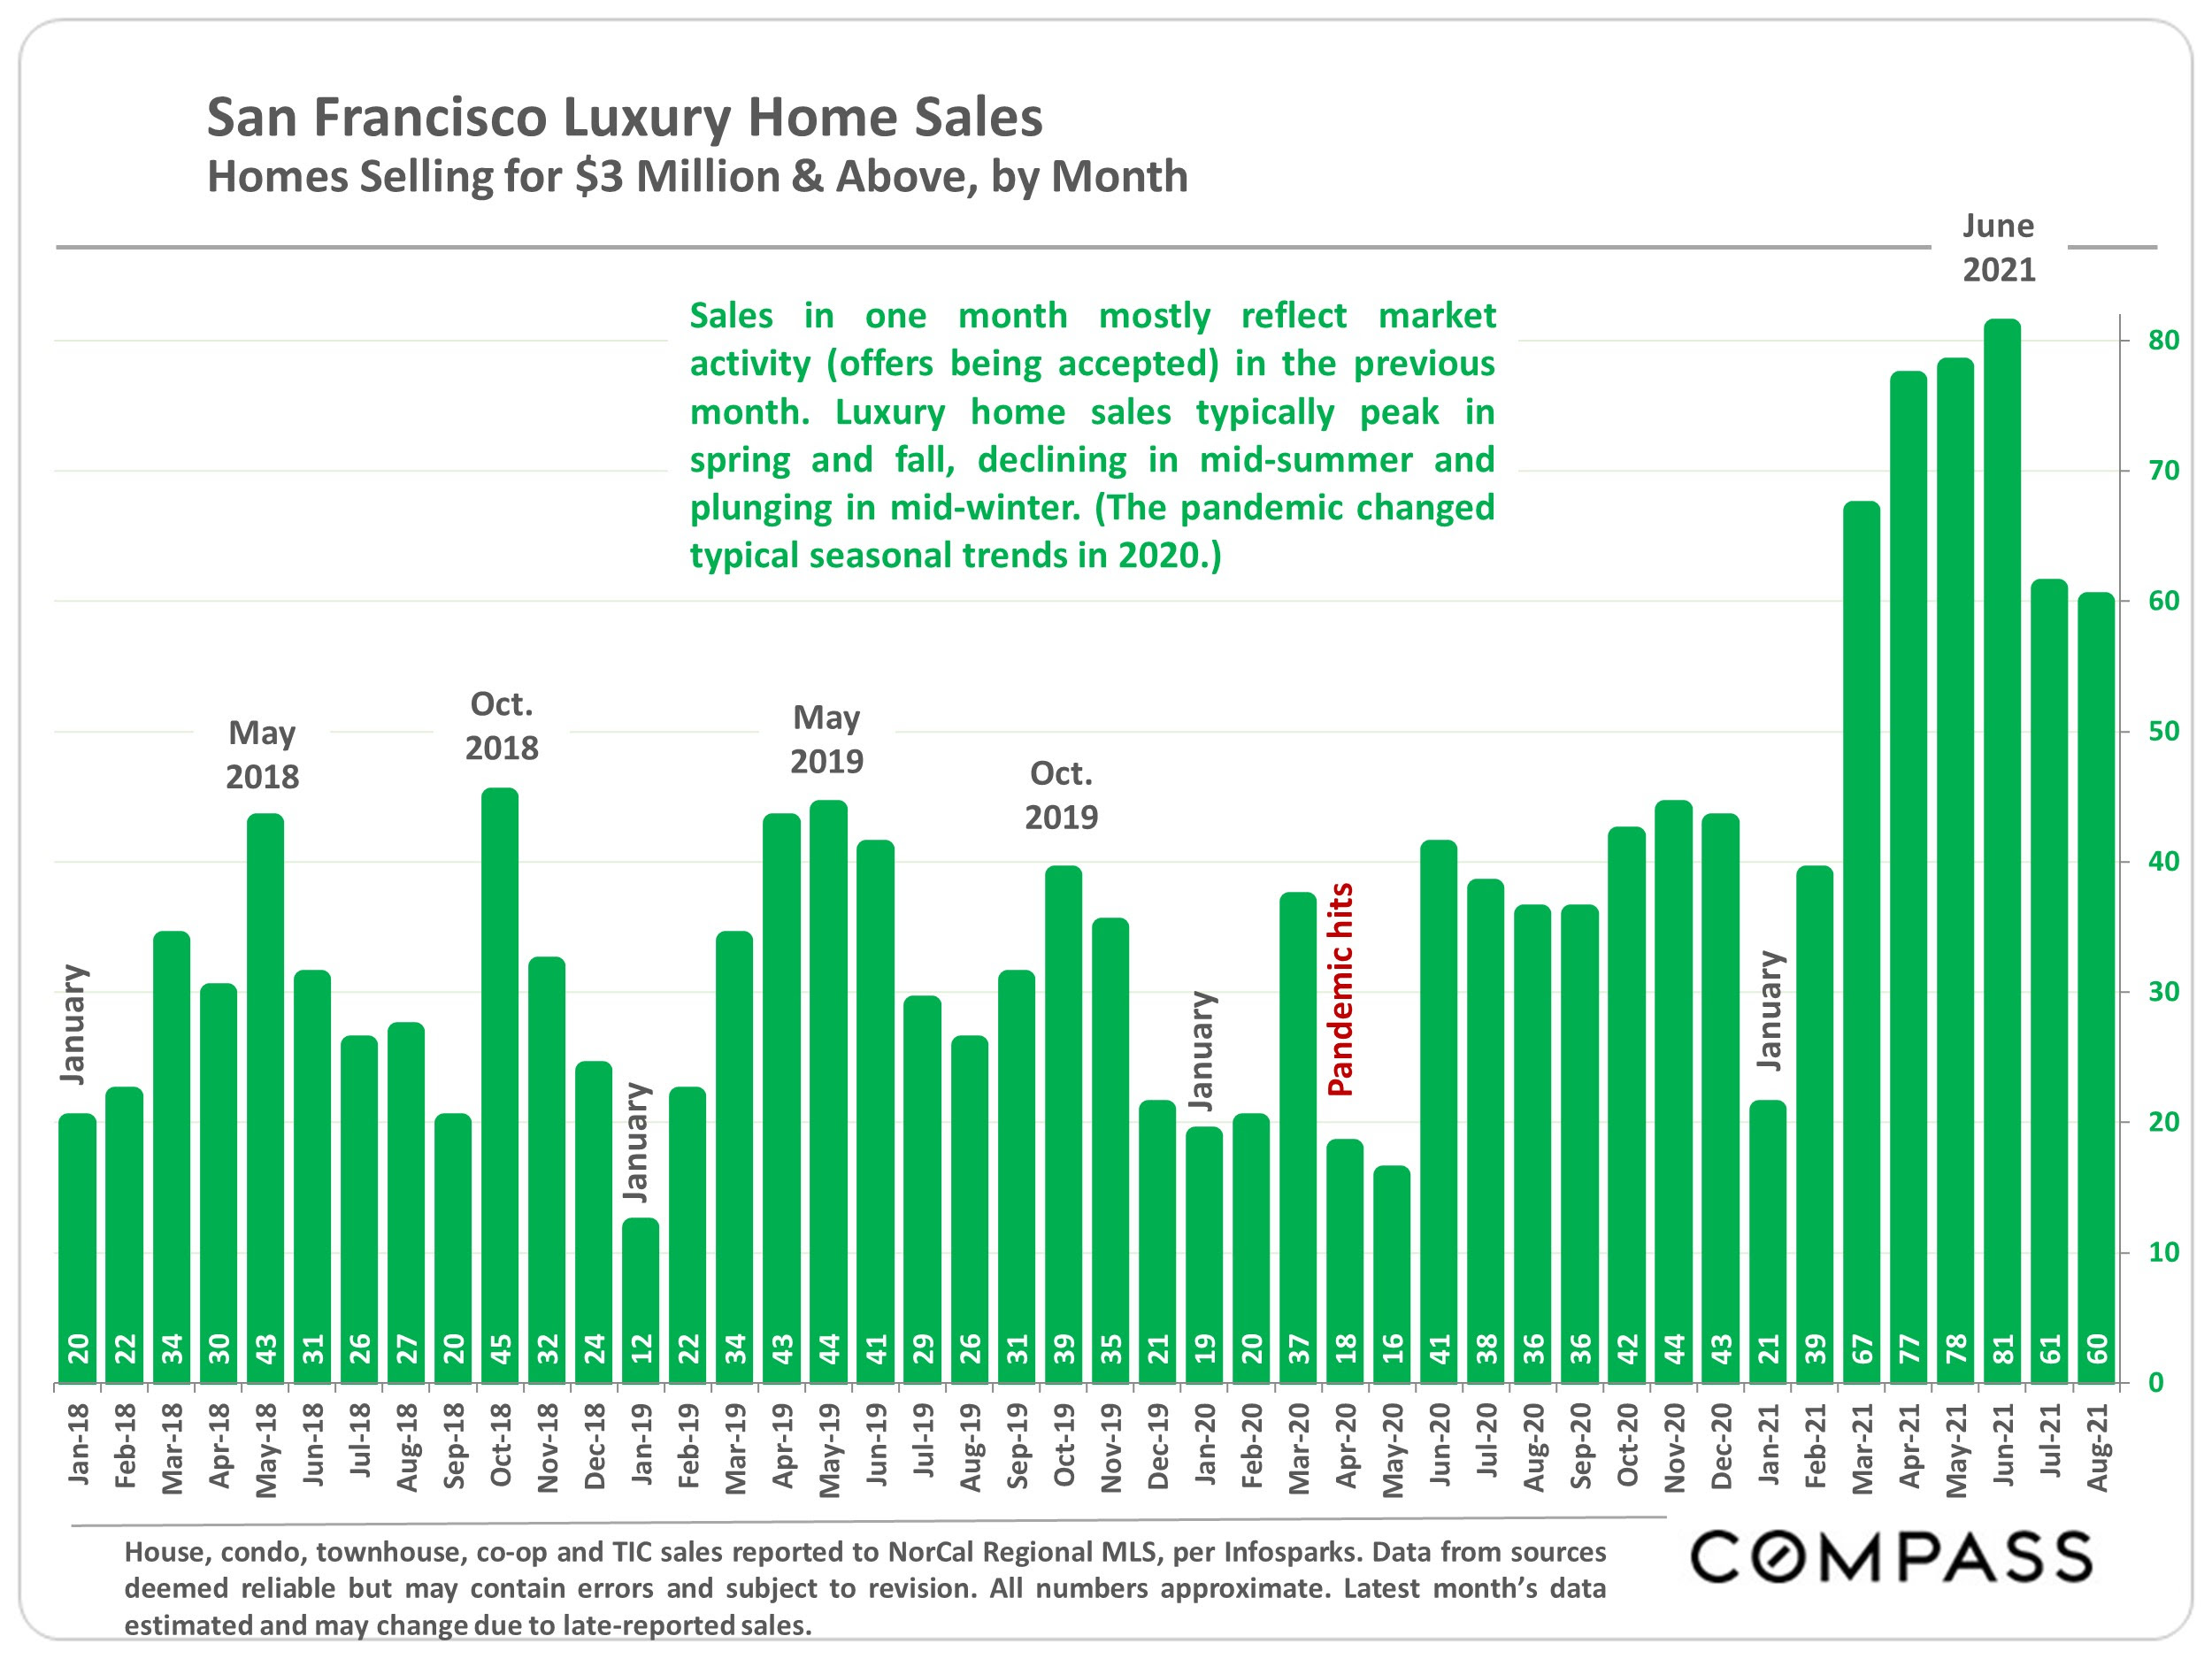
Bar chart of San Francisco sales above $3 million by month, showing a sharp rise in spring 2021.
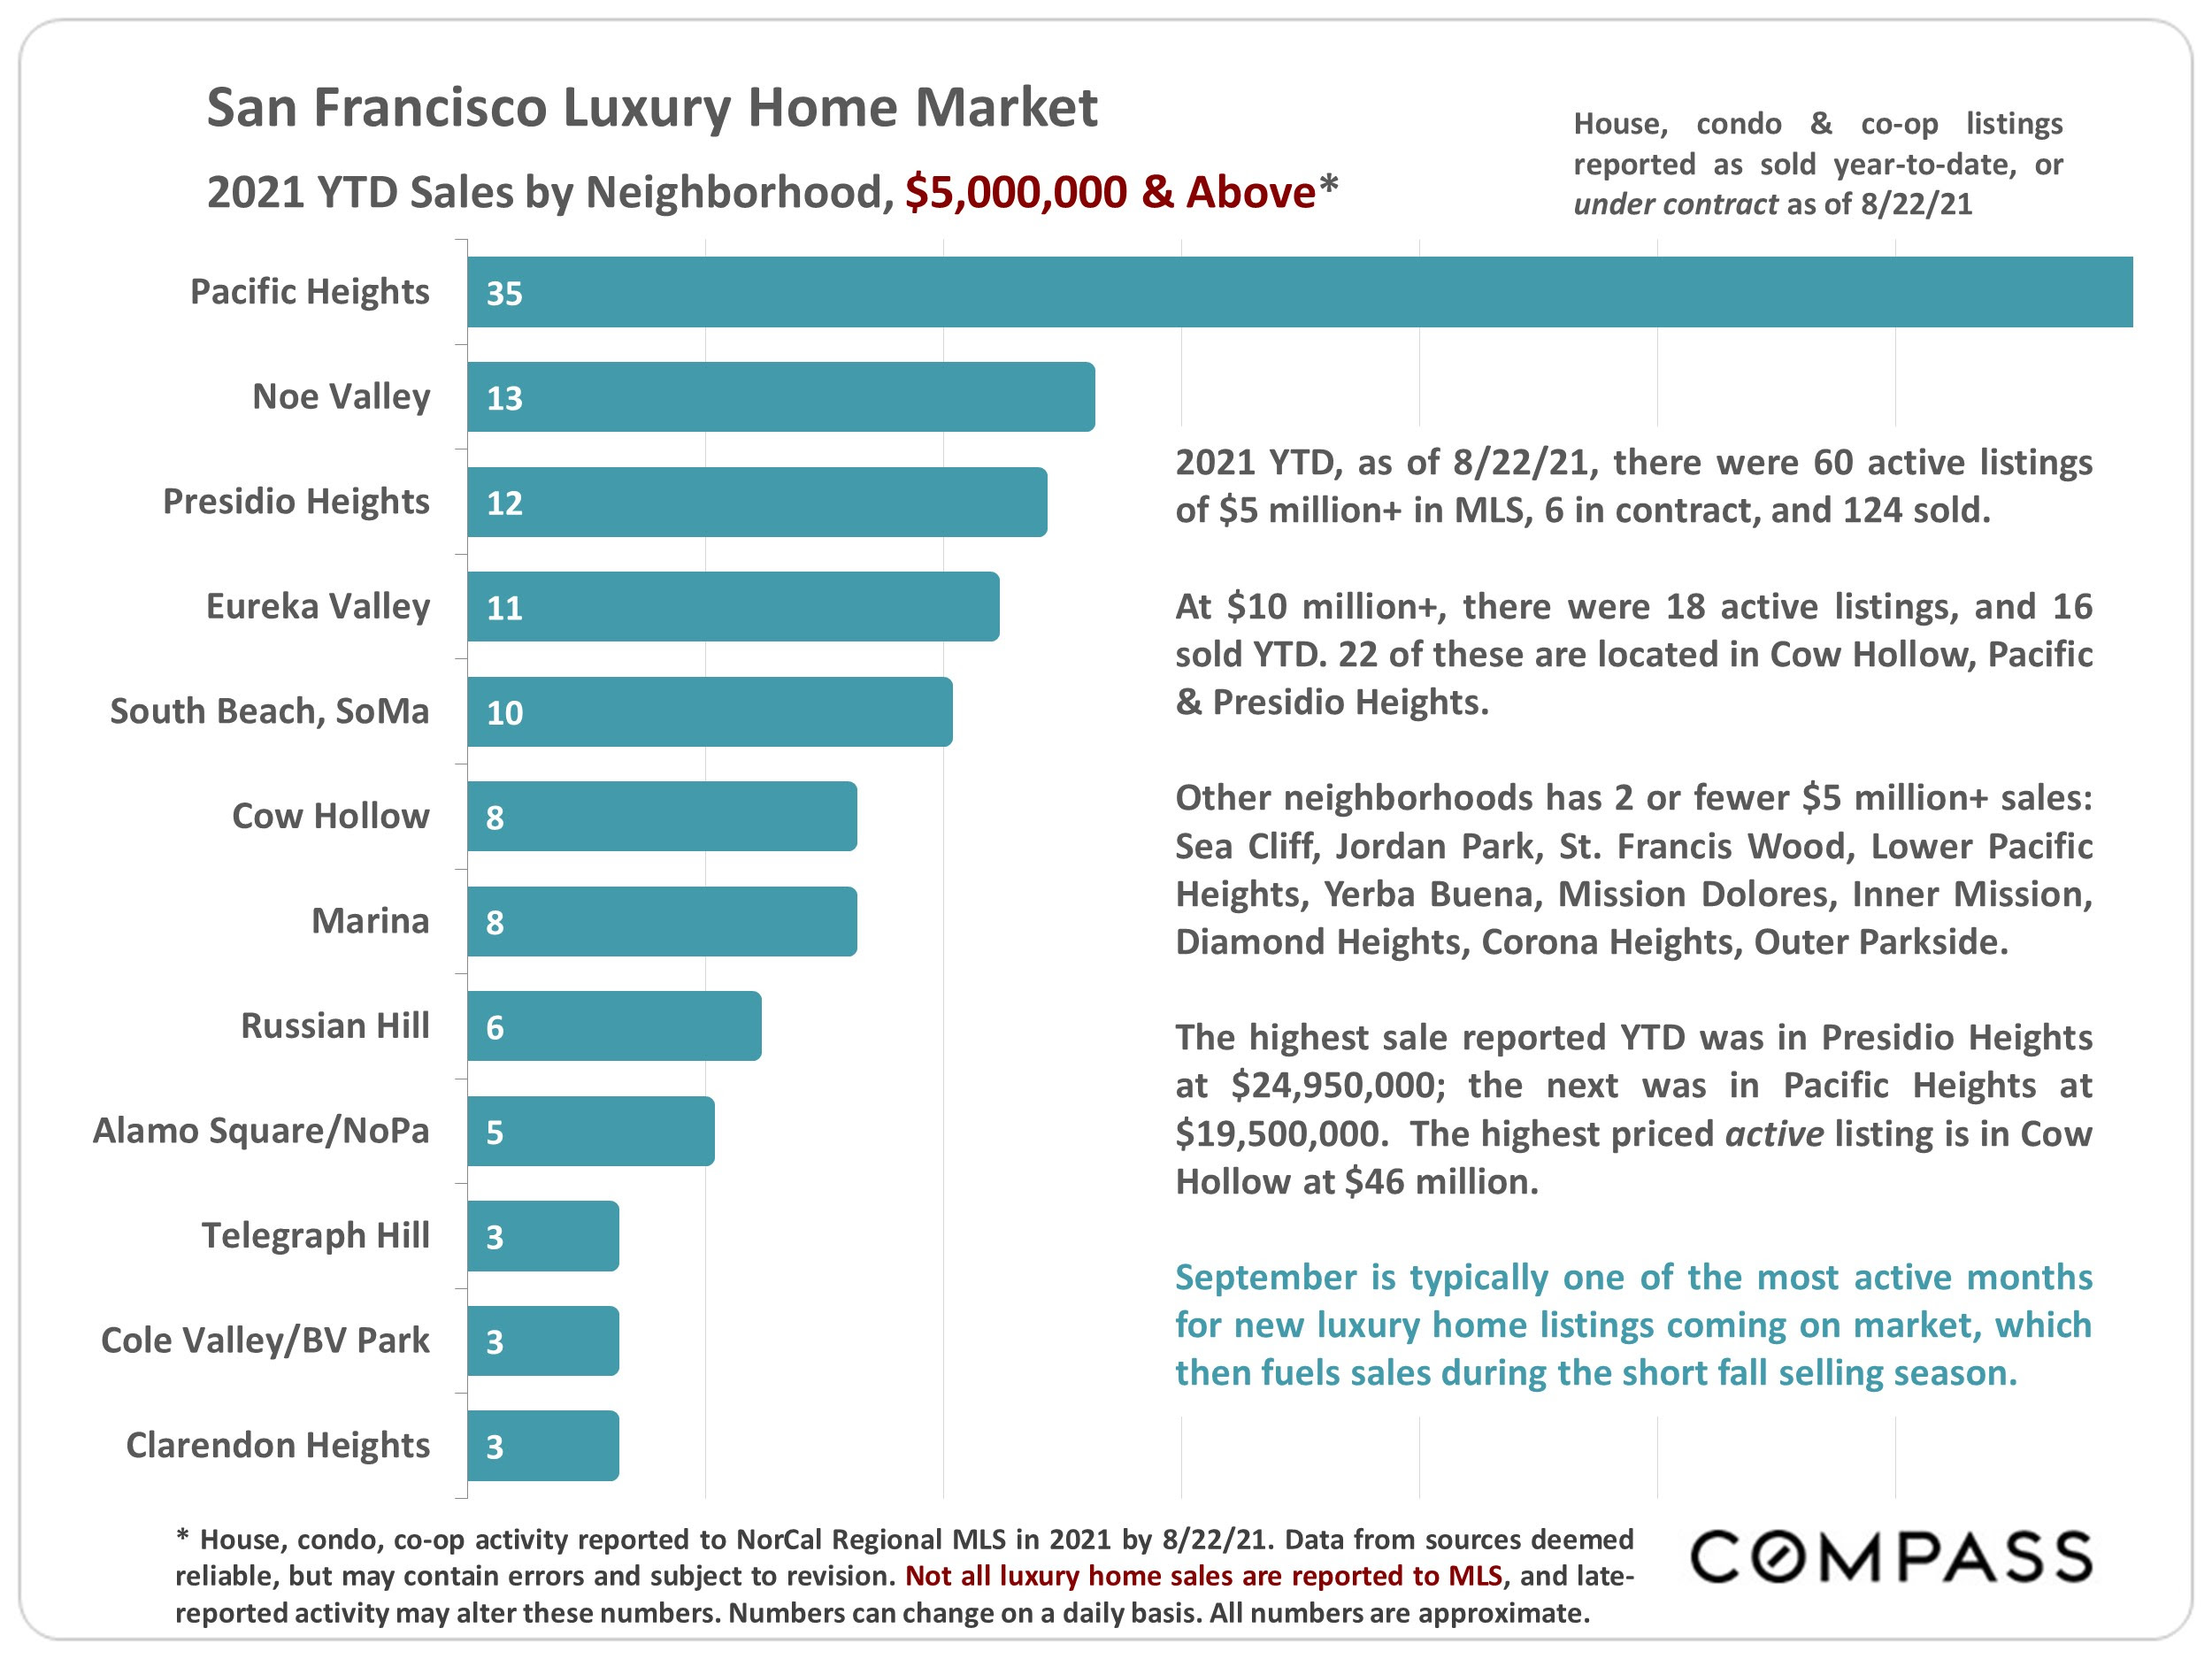
San Francisco luxury home sales chart showing 2021 year-to-date $5 million-plus sales by neighborhood.
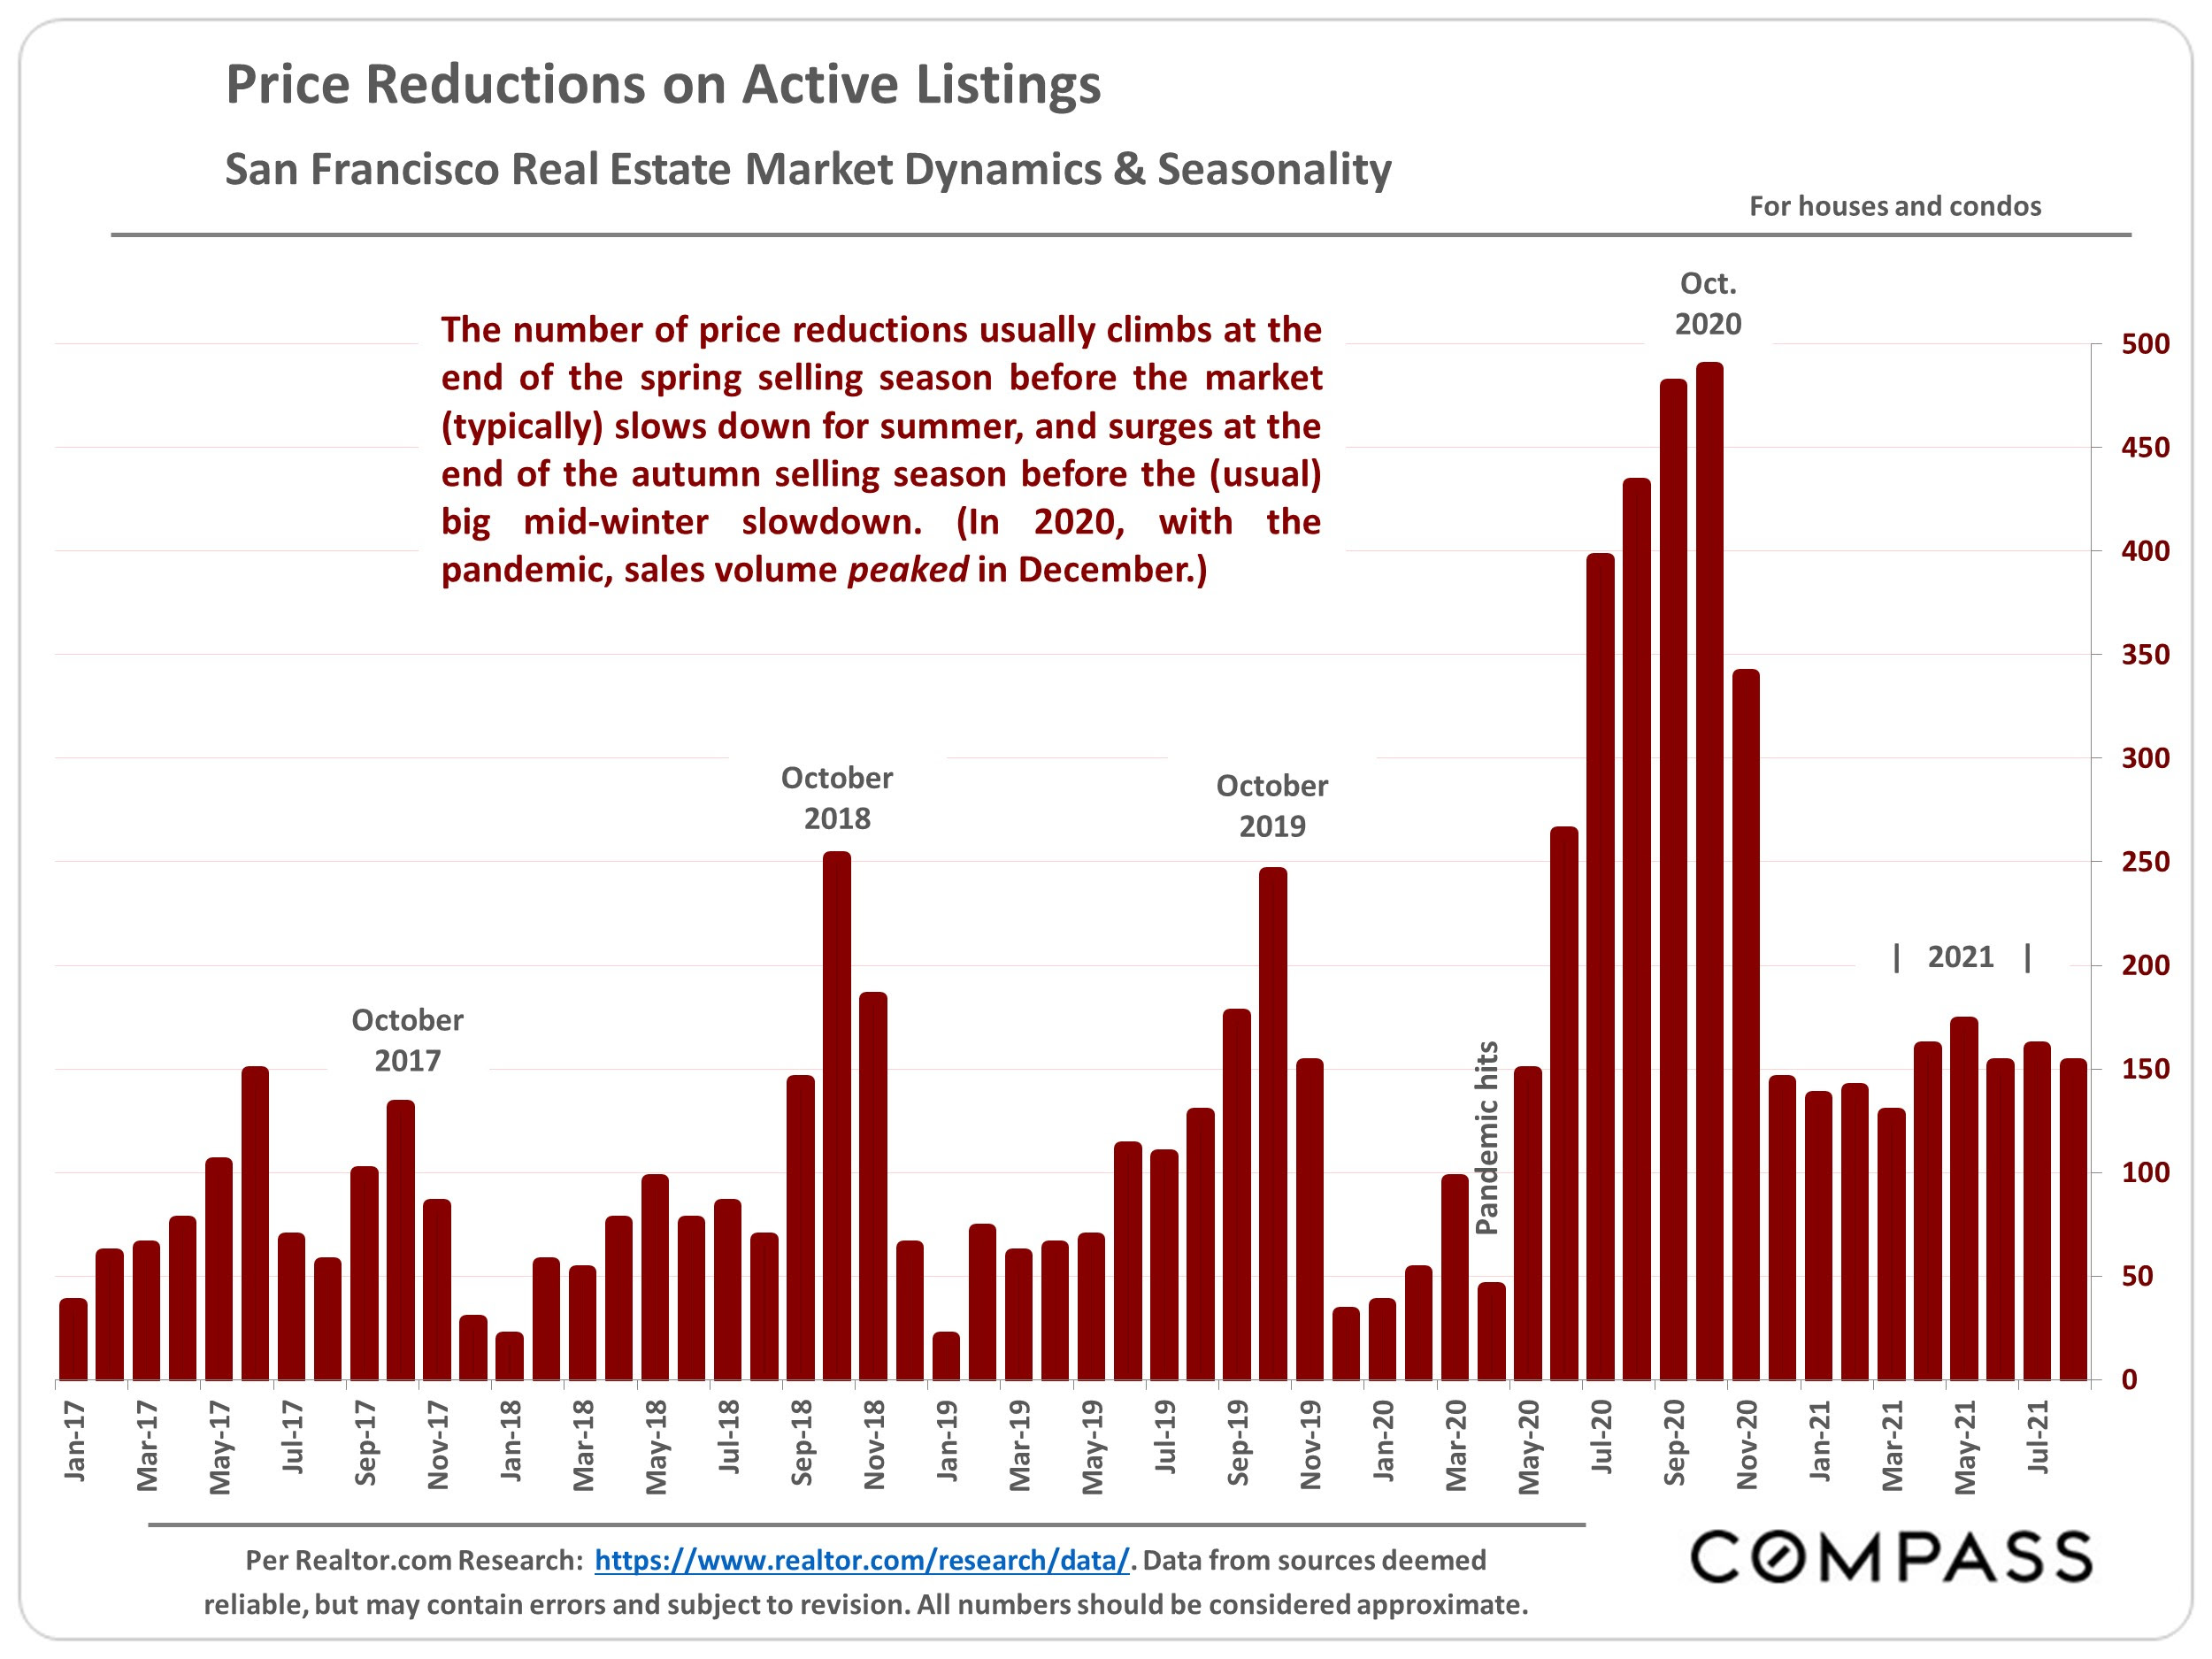
Chart of San Francisco listing price reductions, with a sharp surge in summer and autumn 2020.
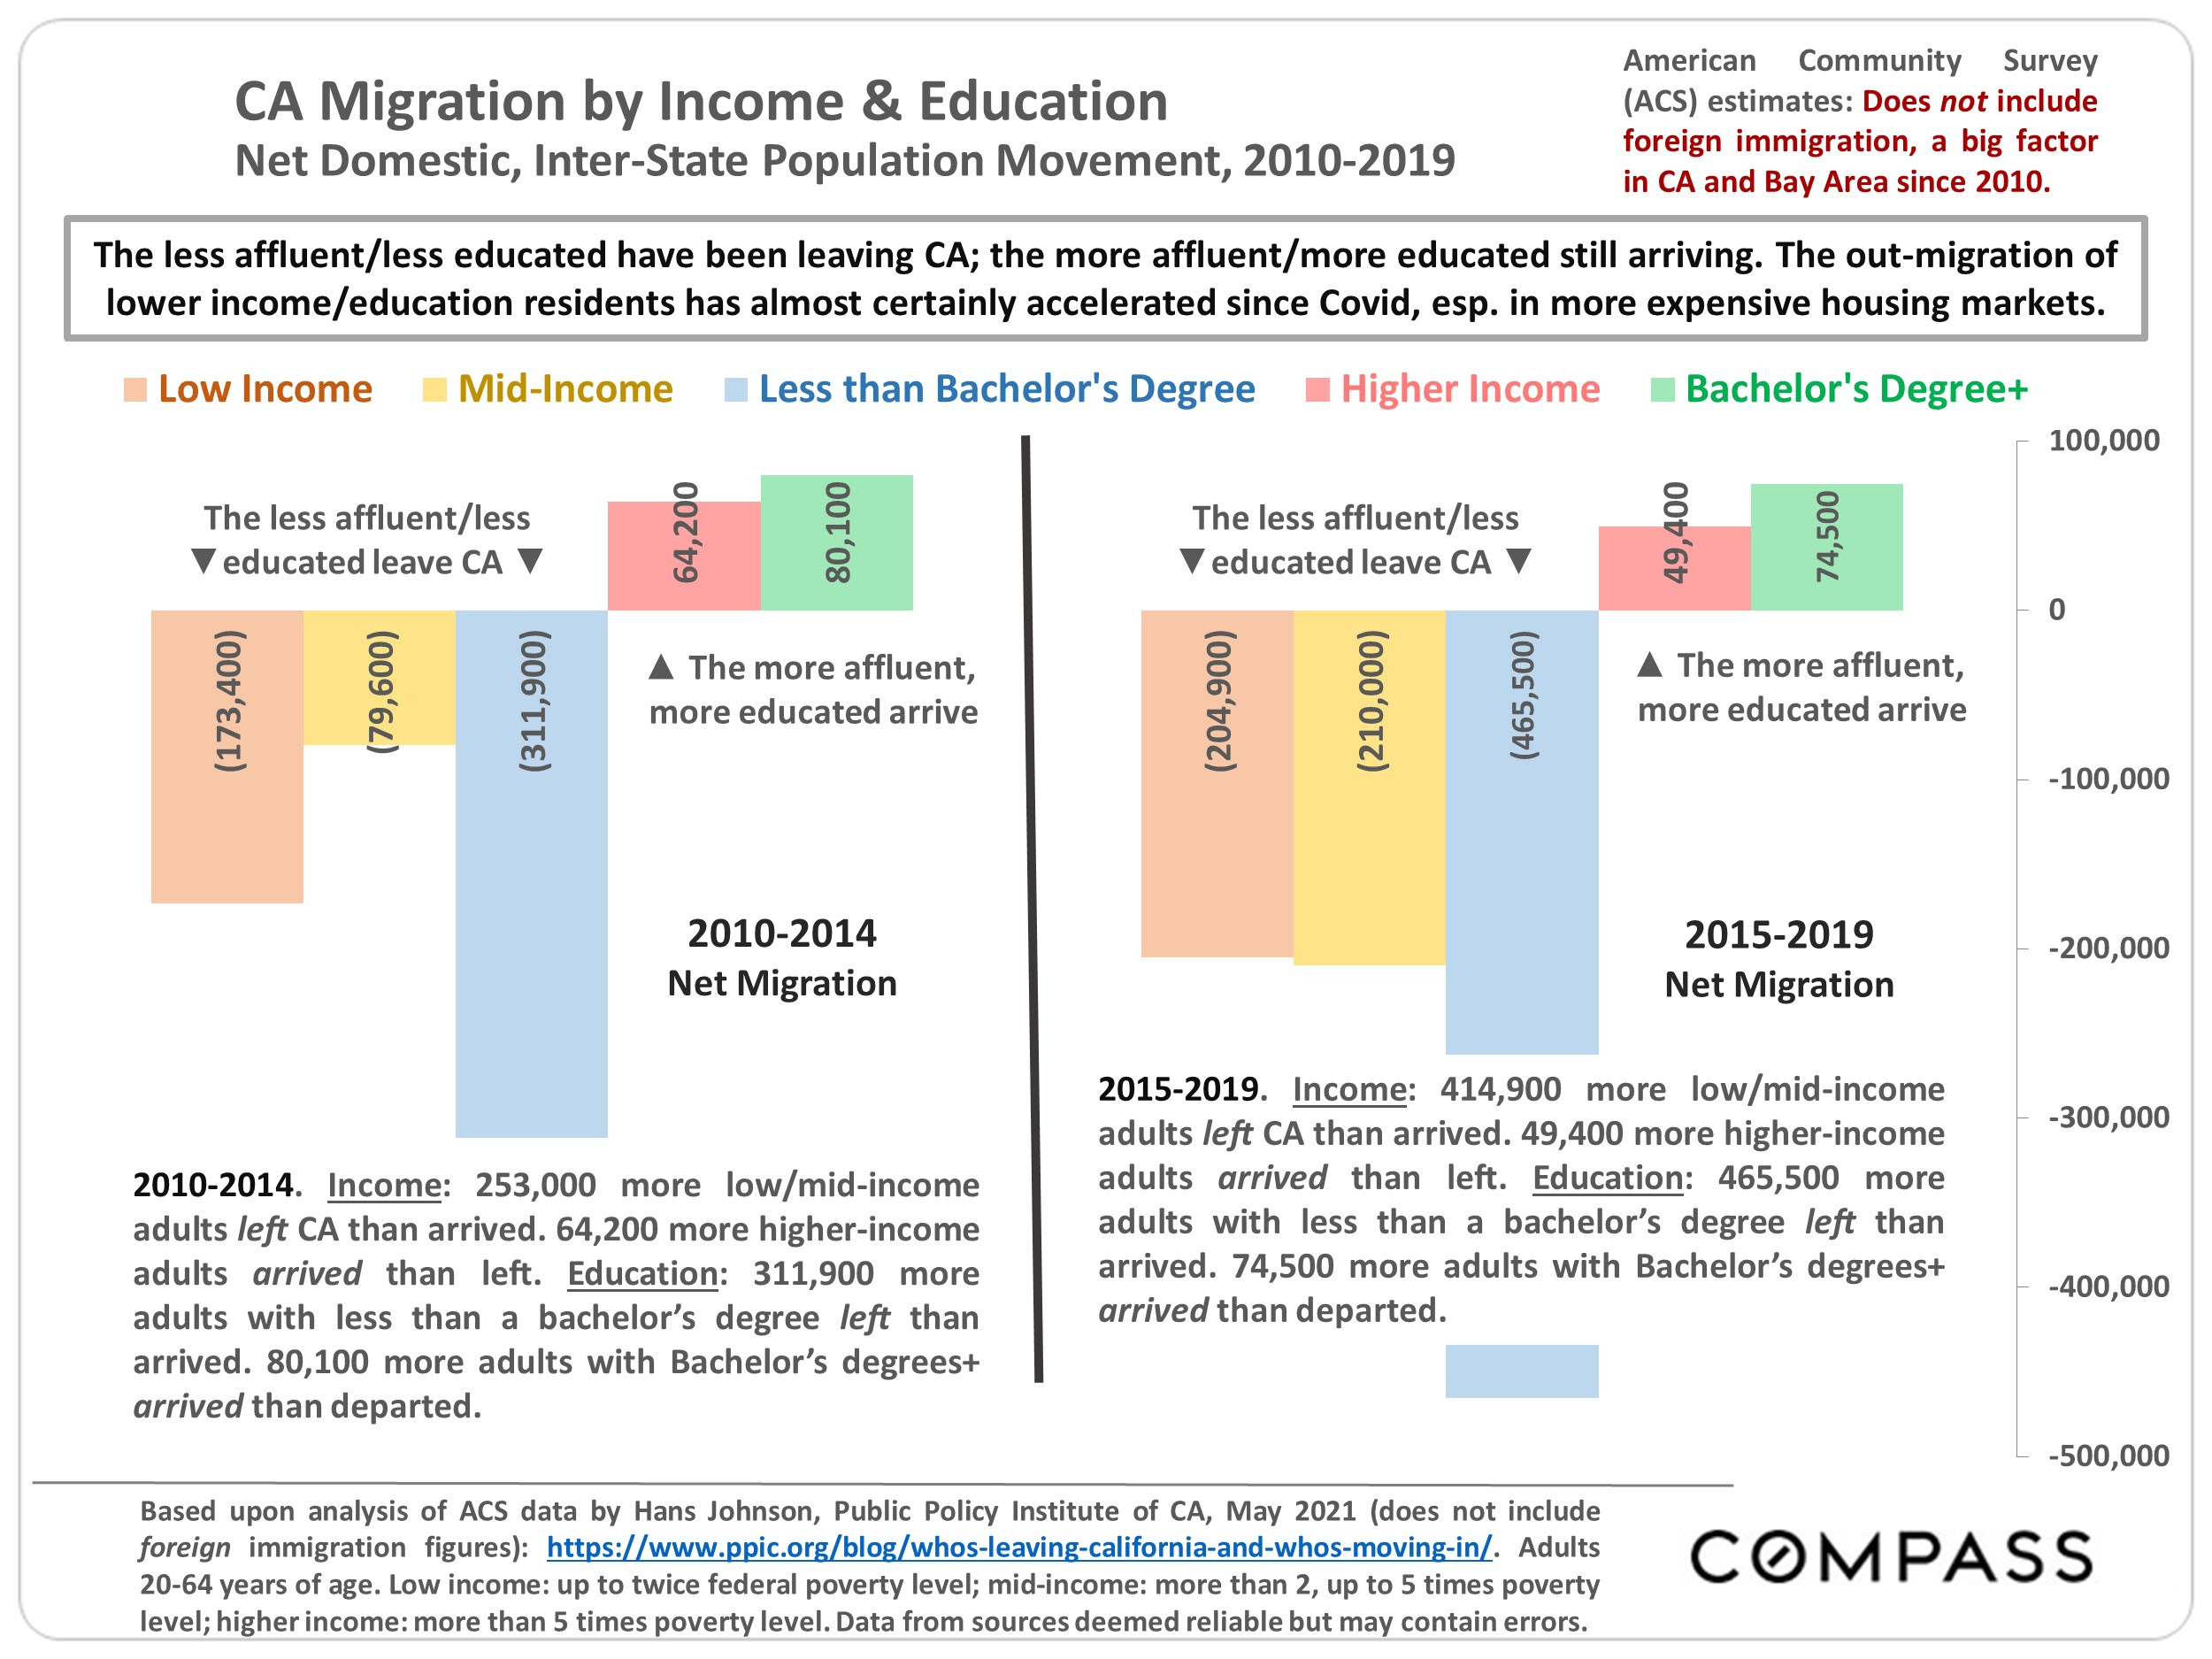
Infographic comparing California migration by income and education for 2010–2014 and 2015–2019.
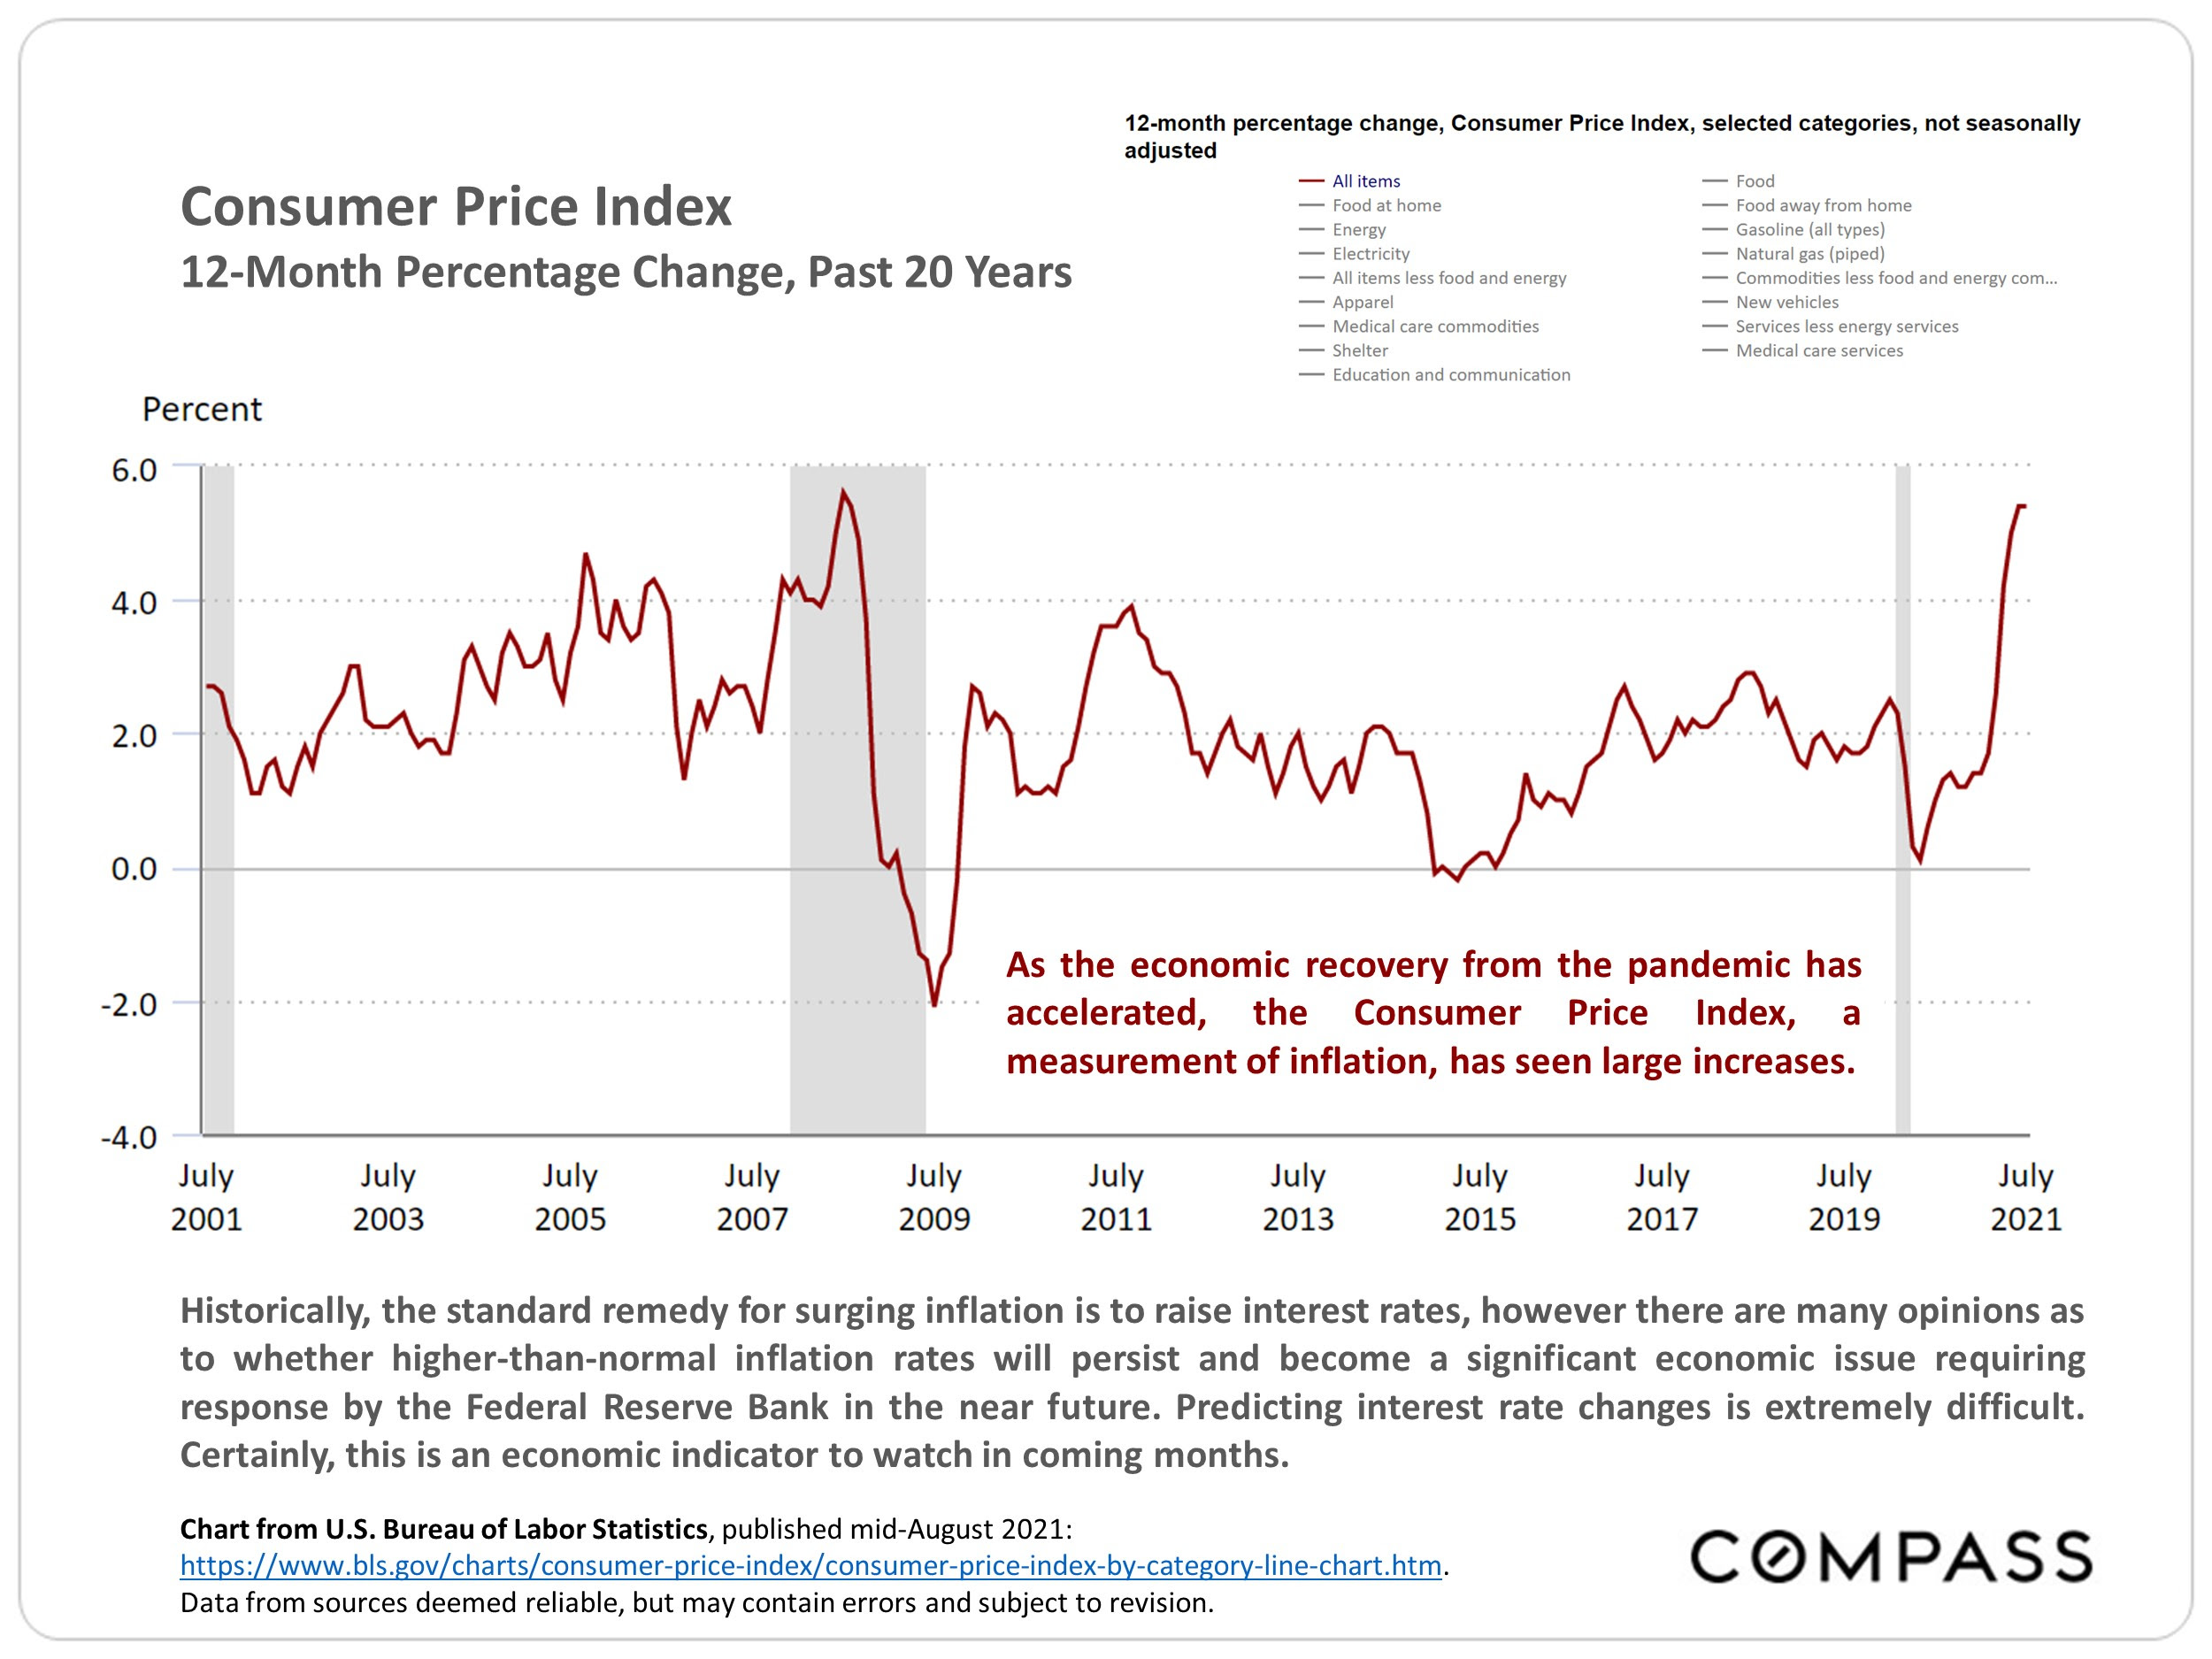
Consumer Price Index chart, 2001–2021, shows inflation rising sharply to about 5.5% by July 2021.

Enjoy The Weekend!

Follow Us On Instagram