Max Armour
San Francisco rooftops with the bay and distant hills beyond.

San Francisco Residential Market Report

October 2021
compass
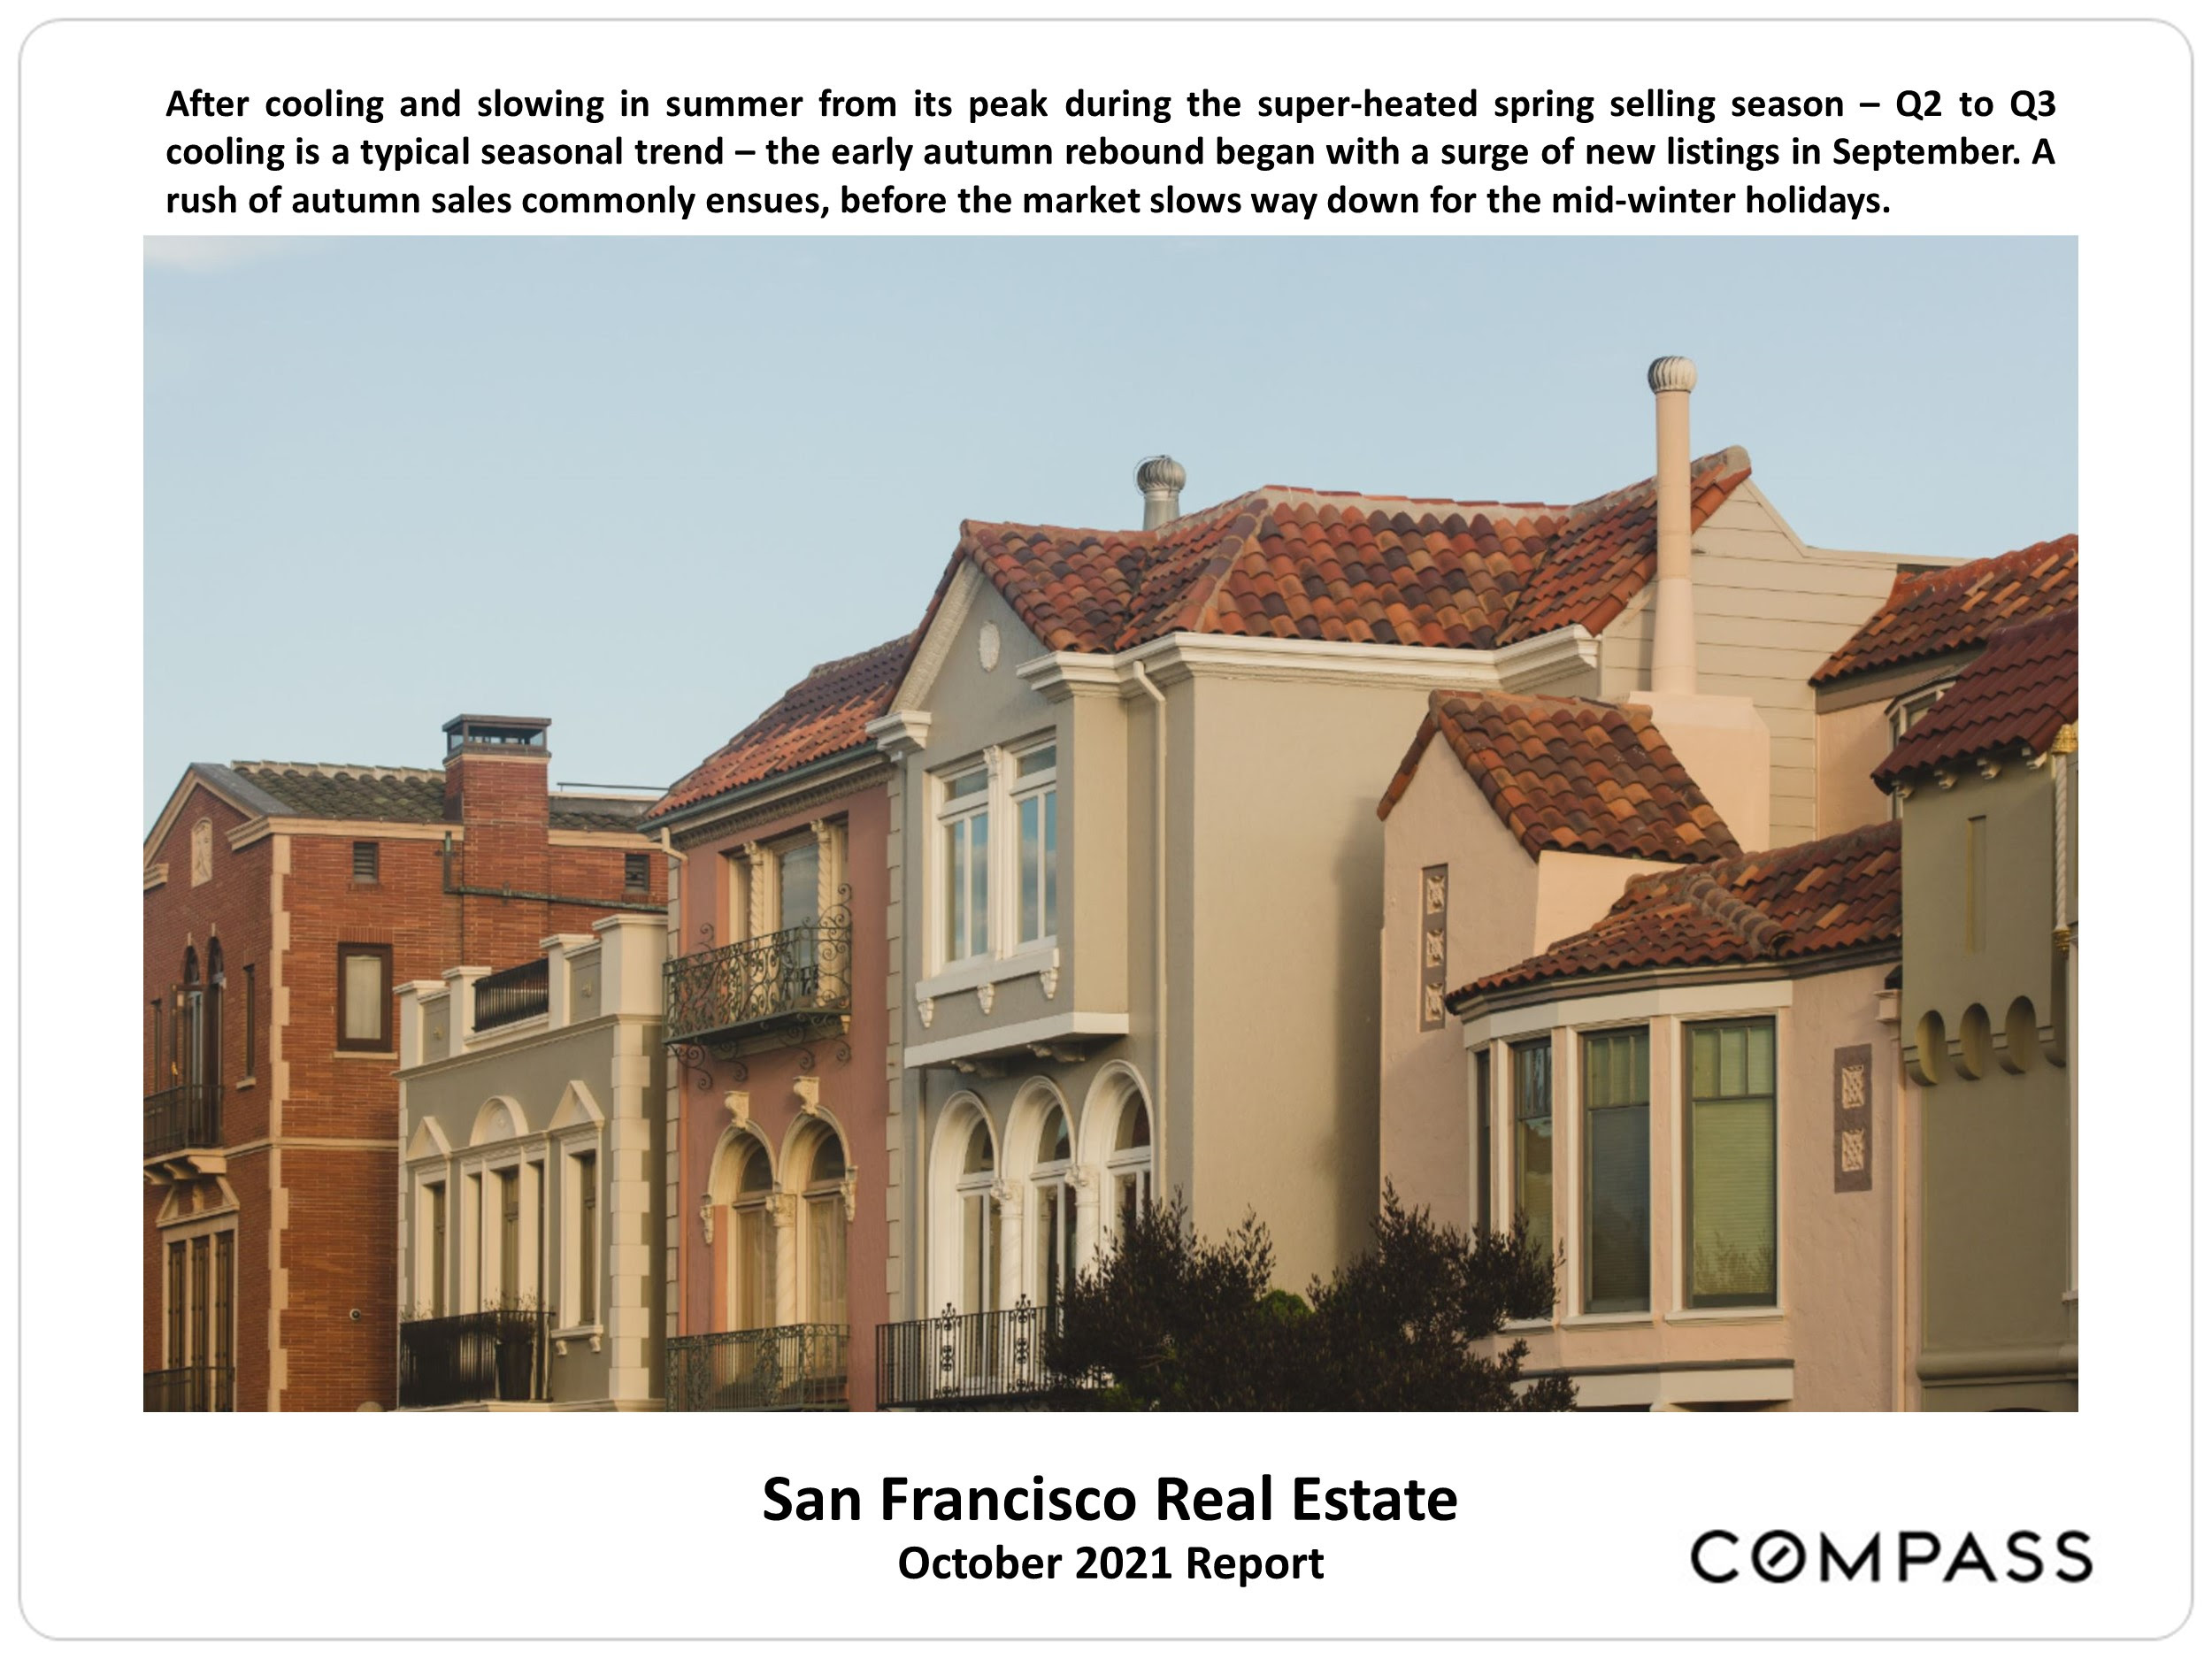
San Francisco Real Estate October 2021 Report, with a row of tile-roofed homes and Compass branding.
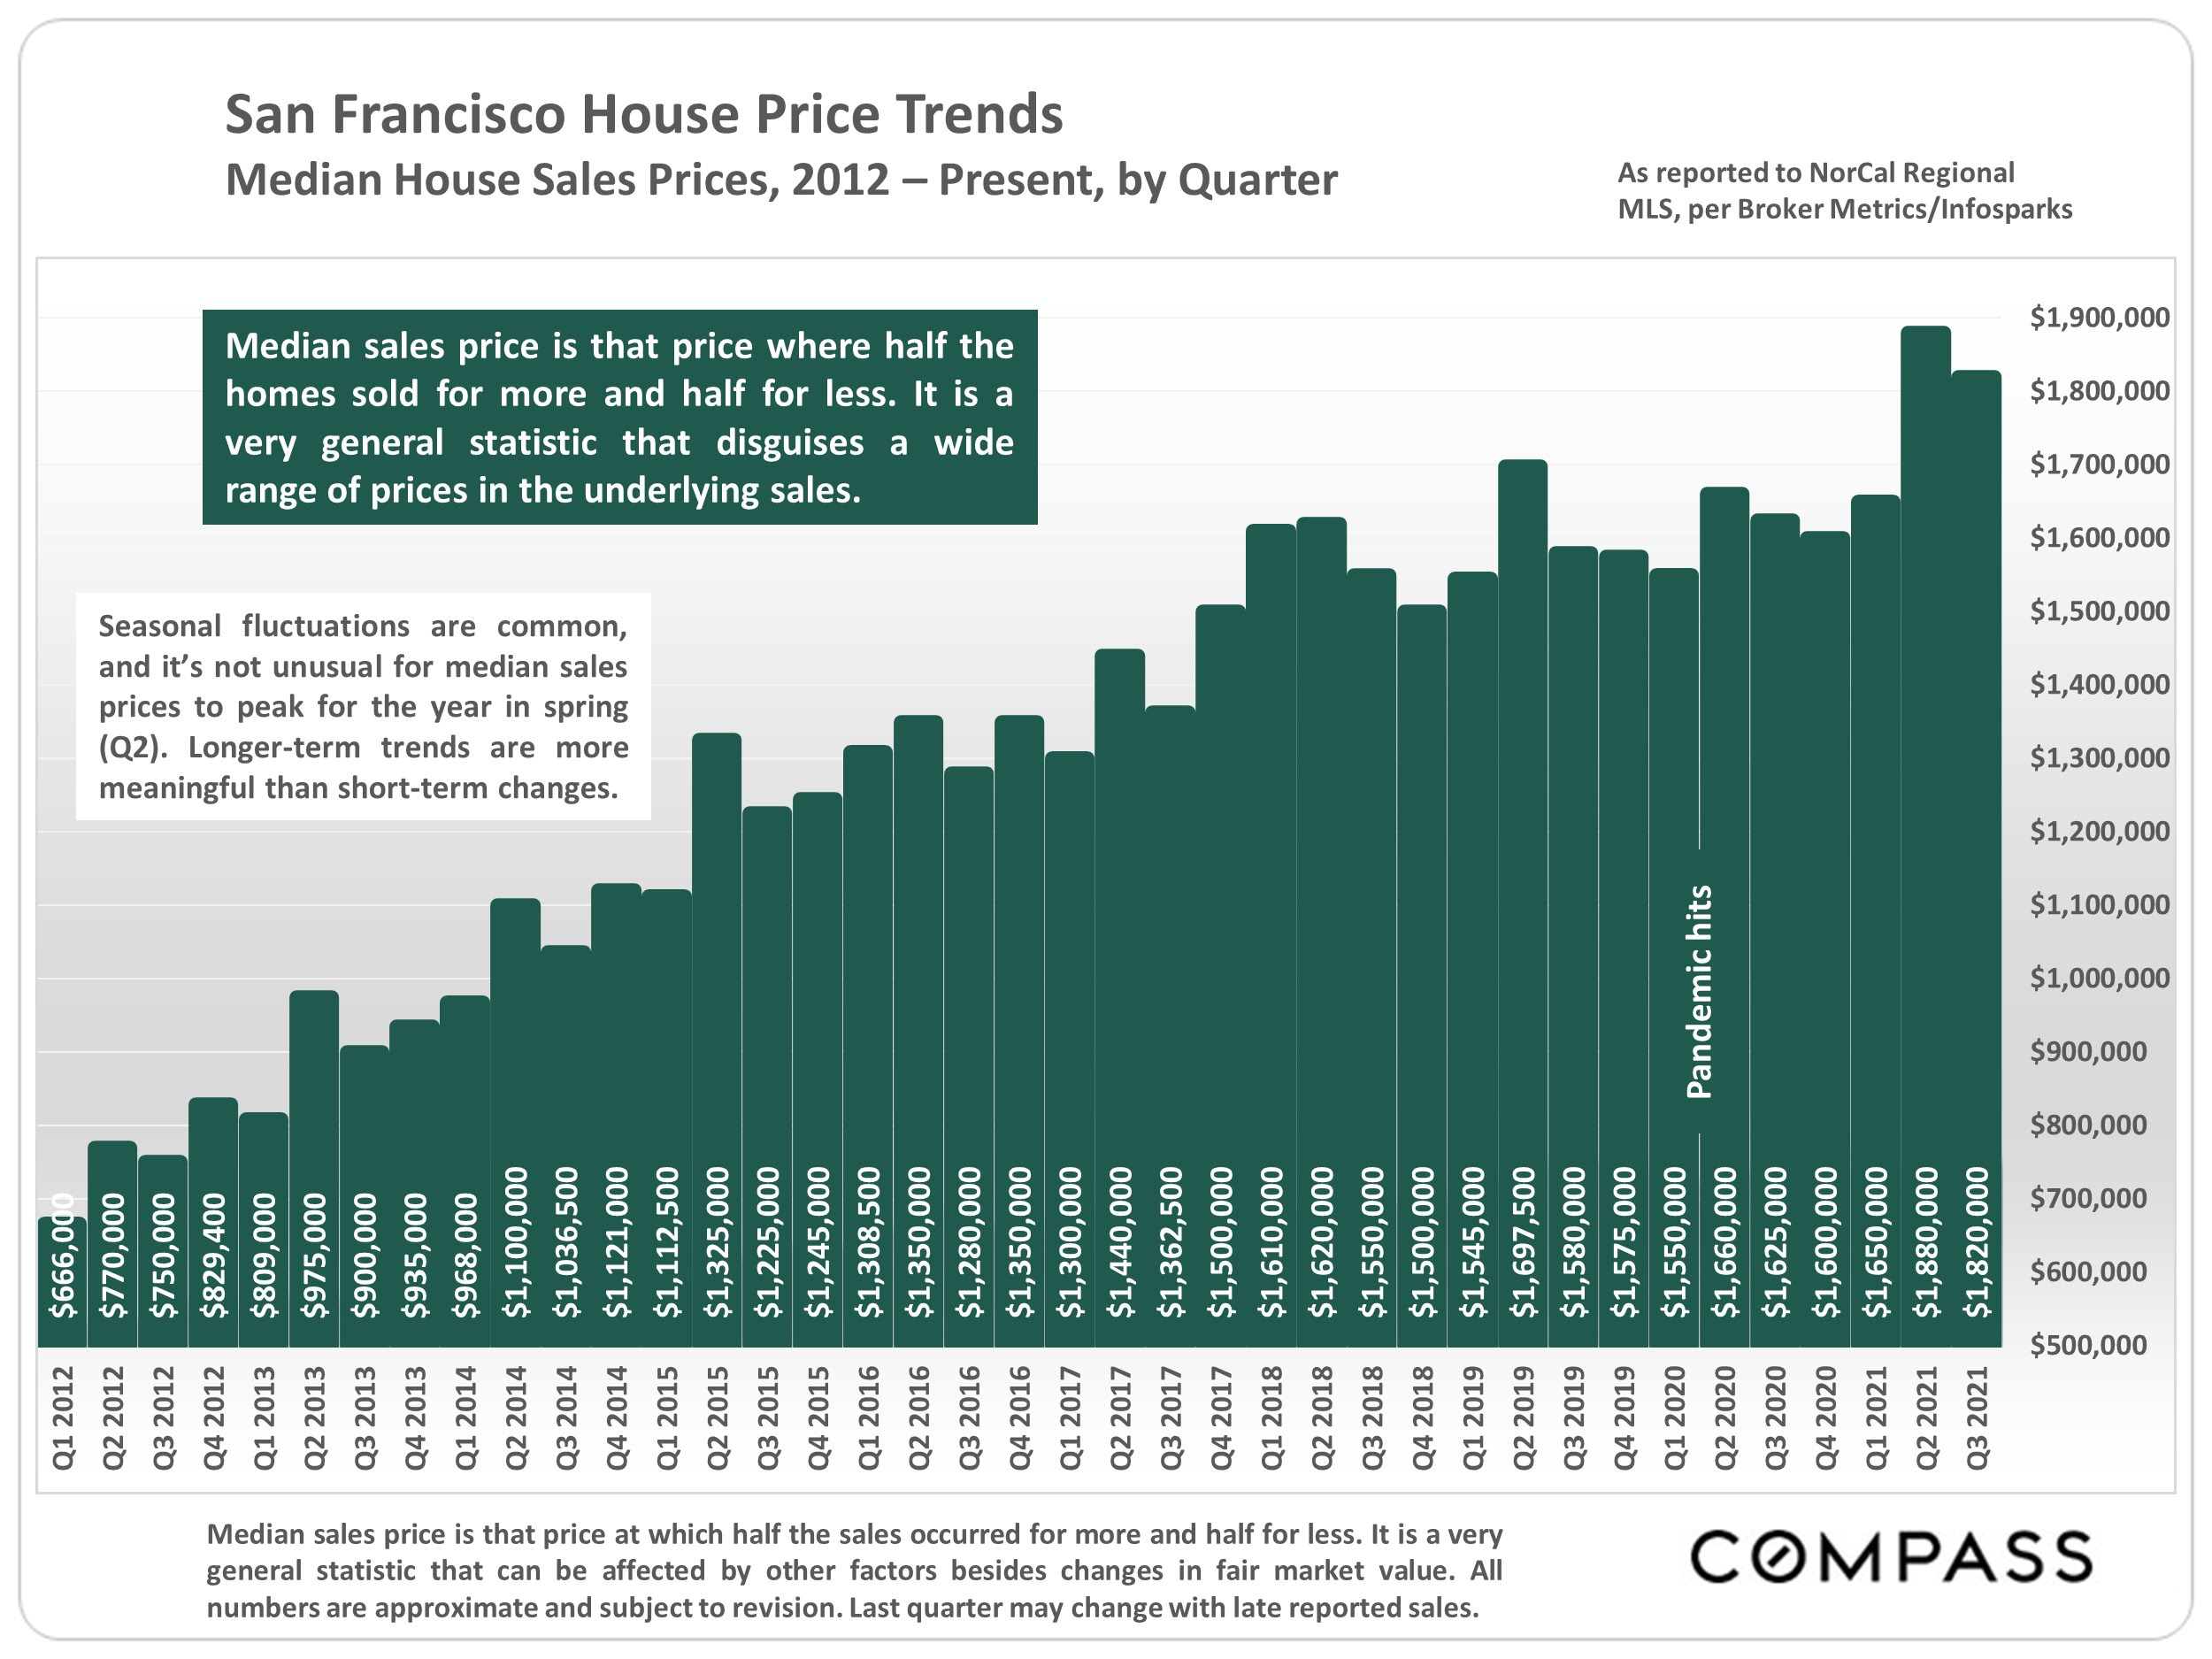
Bar chart of San Francisco quarterly median house prices, rising from $666,000 in 2012 to $1,820,000 in 2021.
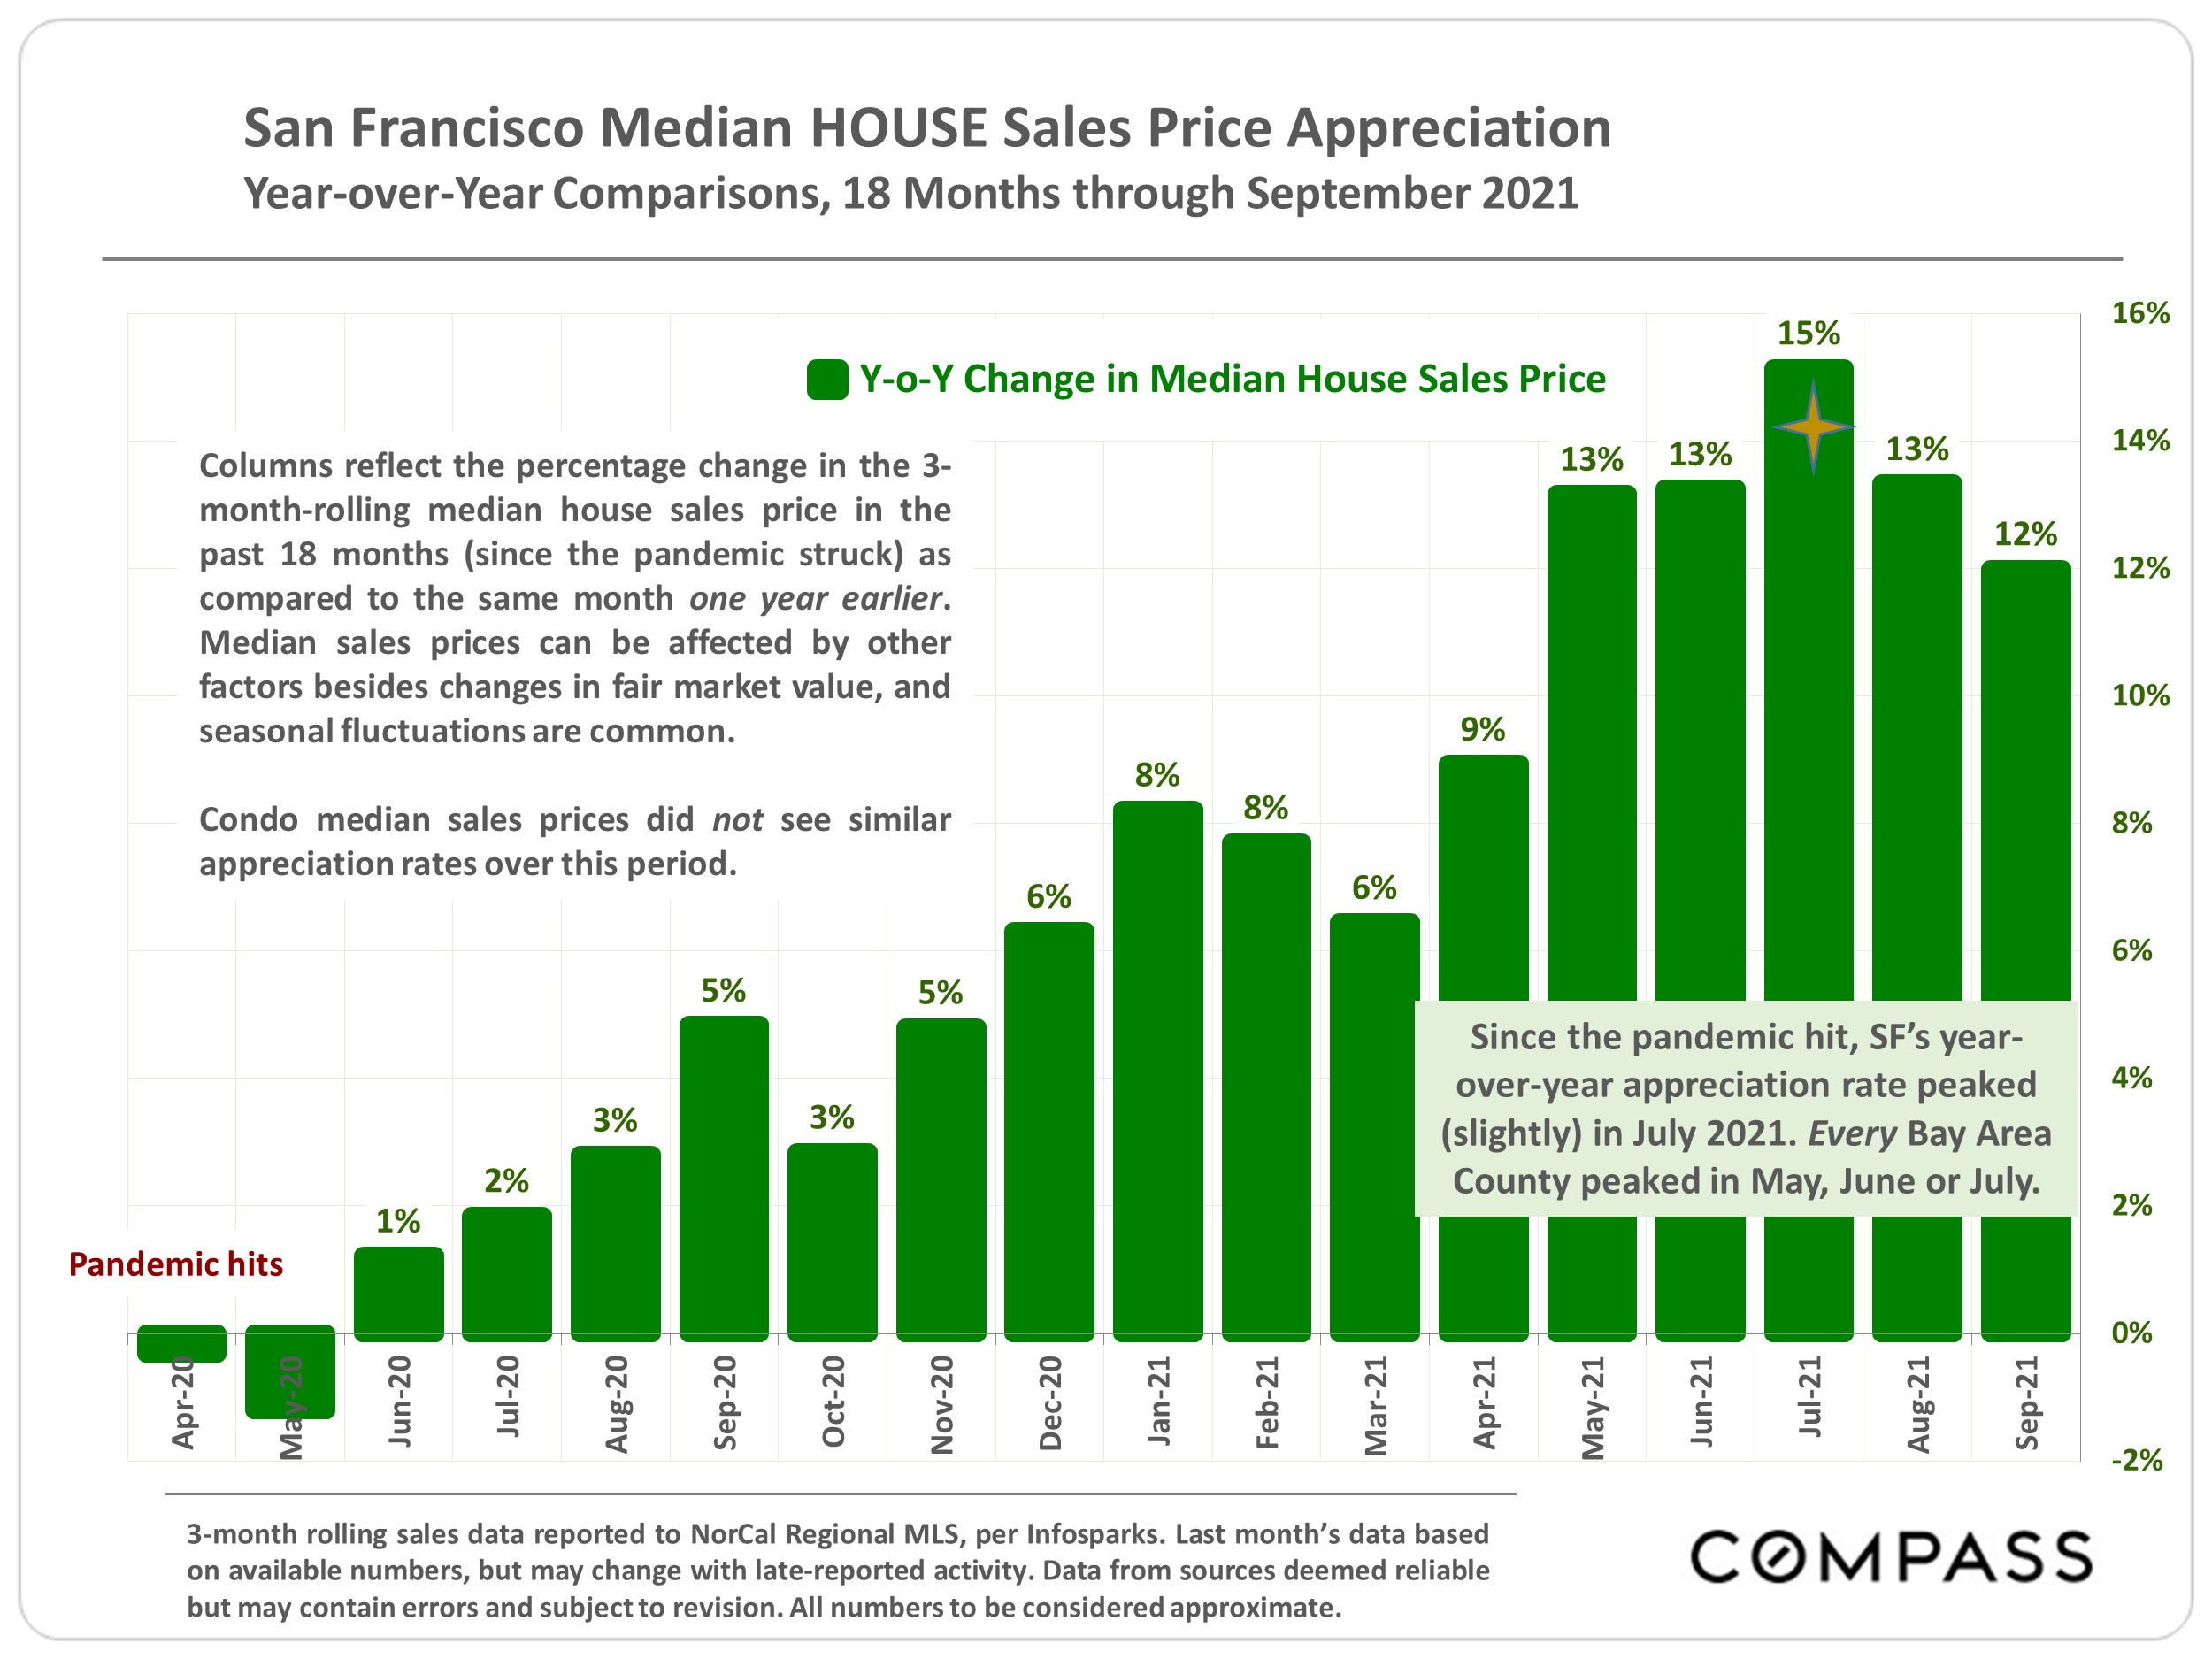
Chart of San Francisco year-over-year median house price appreciation from April 2020 to September 2021.
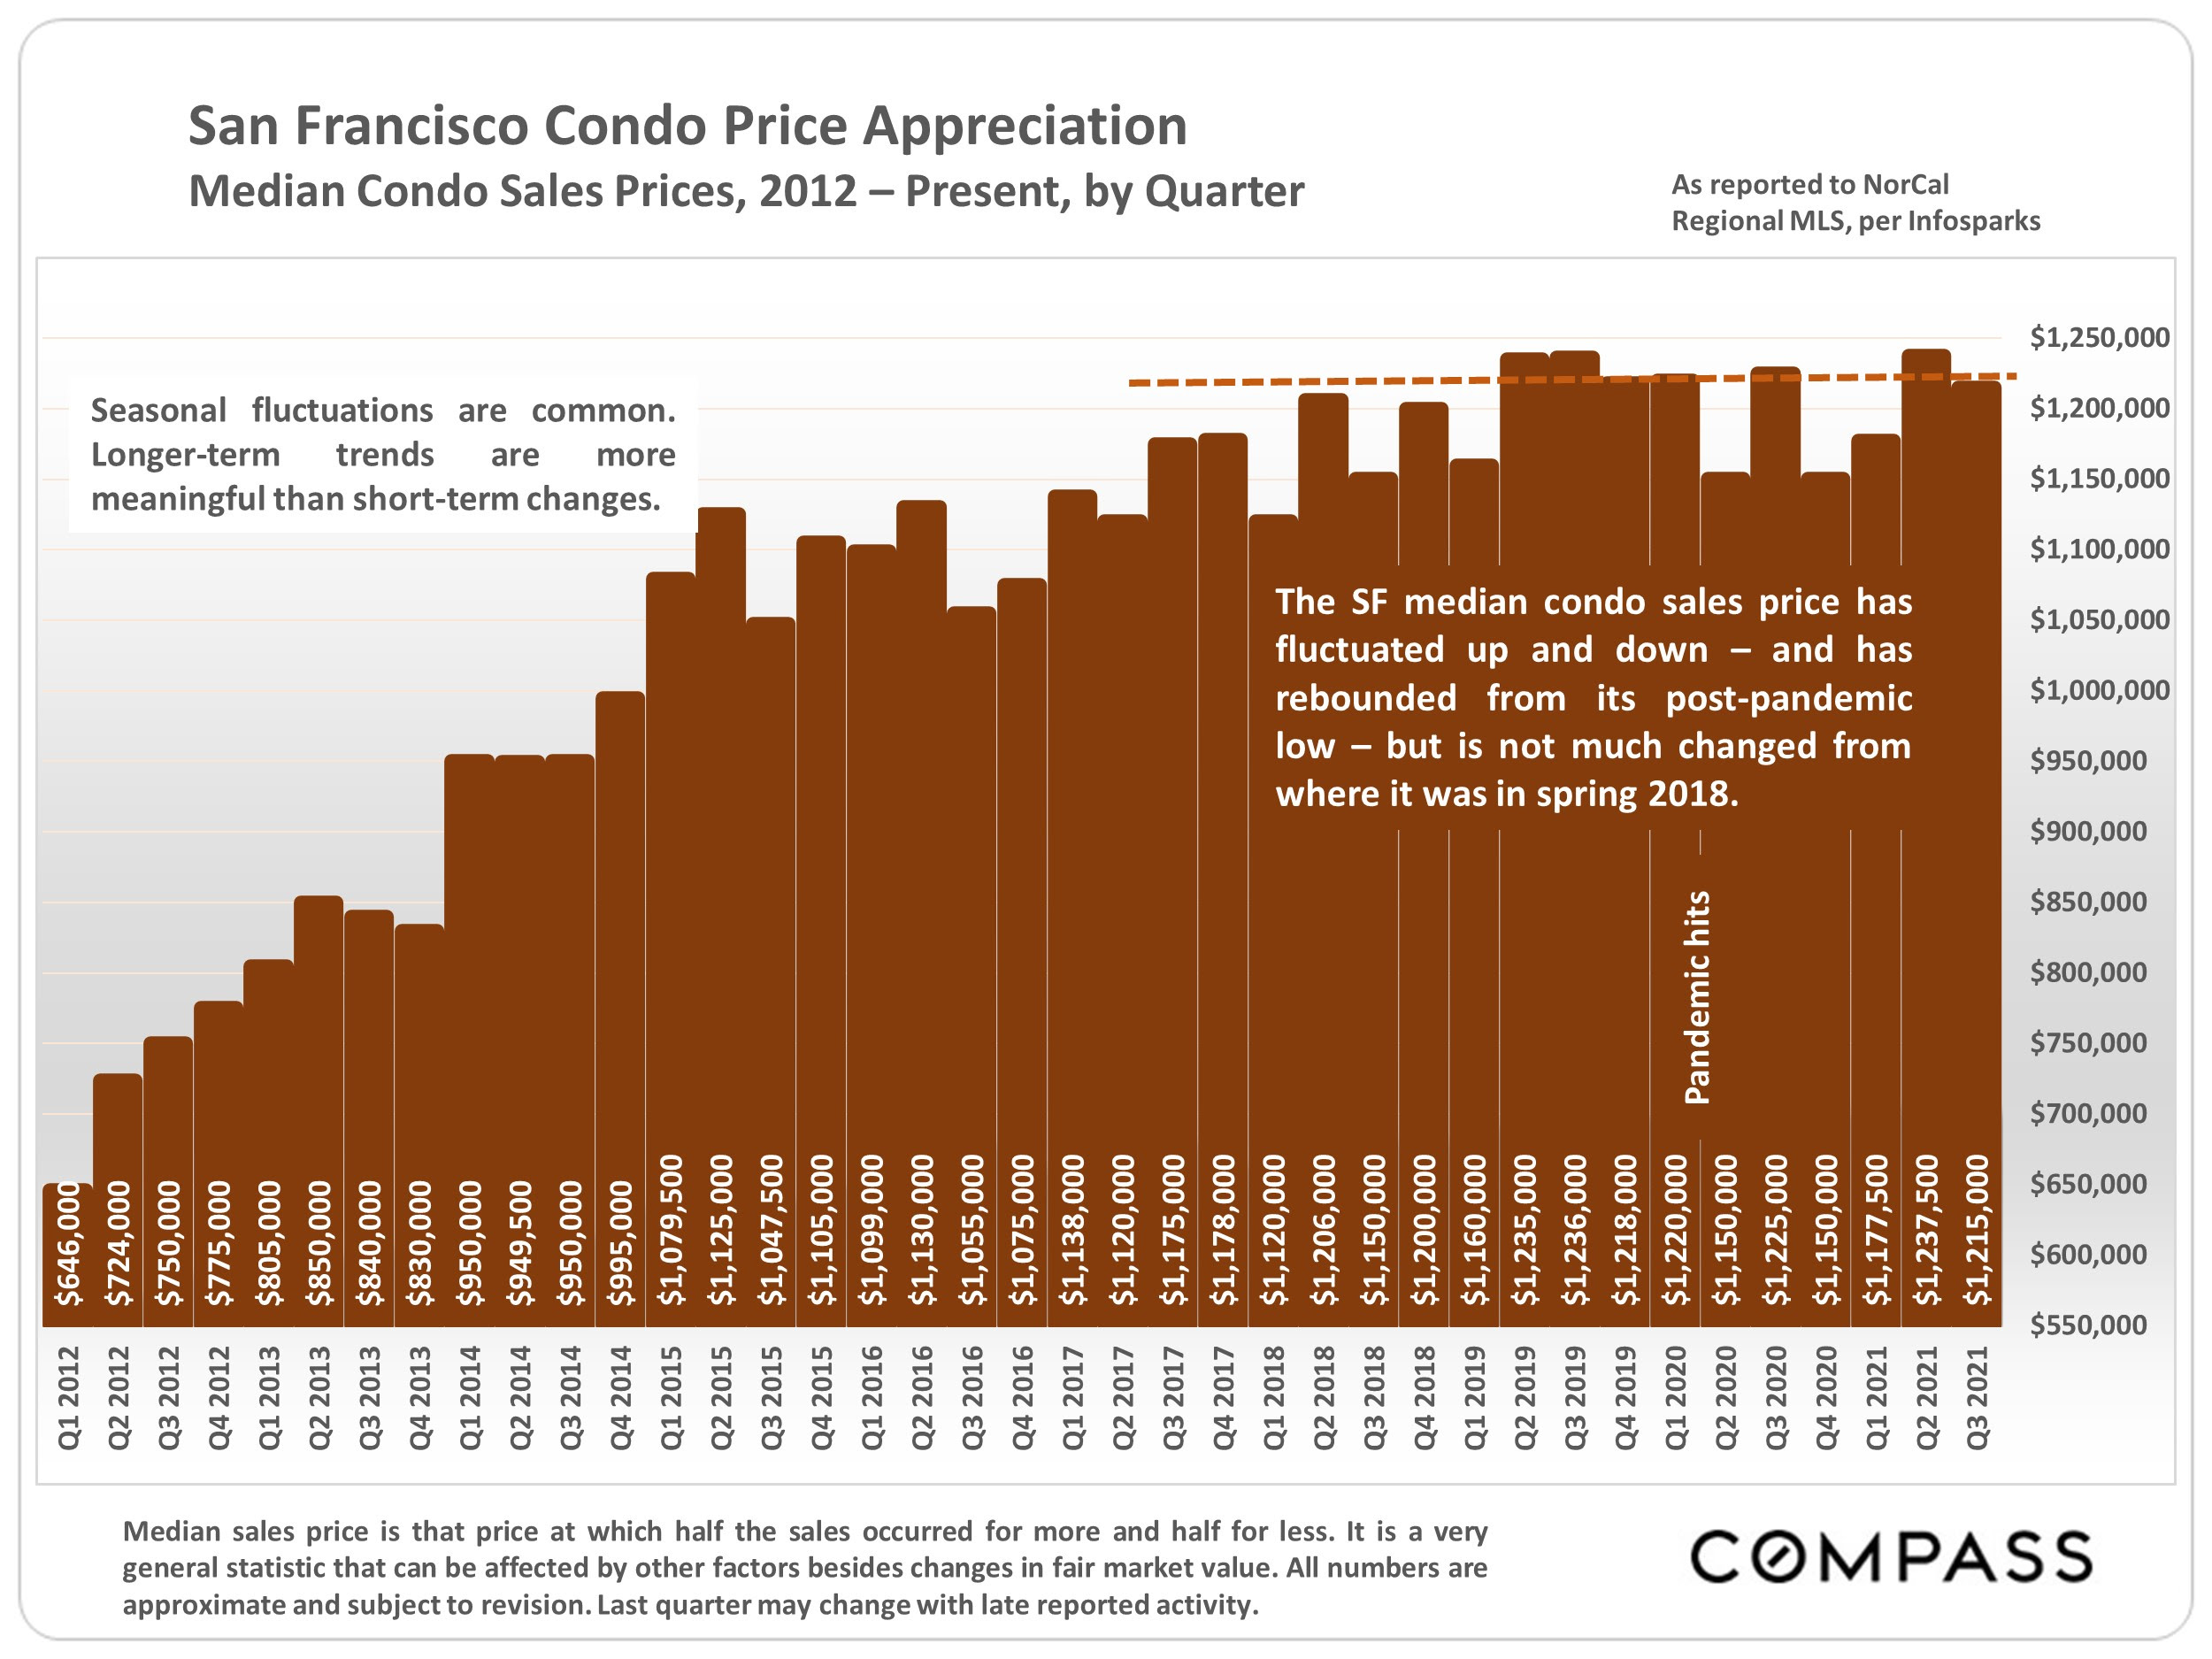
Chart of quarterly San Francisco condo median sale prices, 2012–2021, with a dashed trend line and pandemic marker.
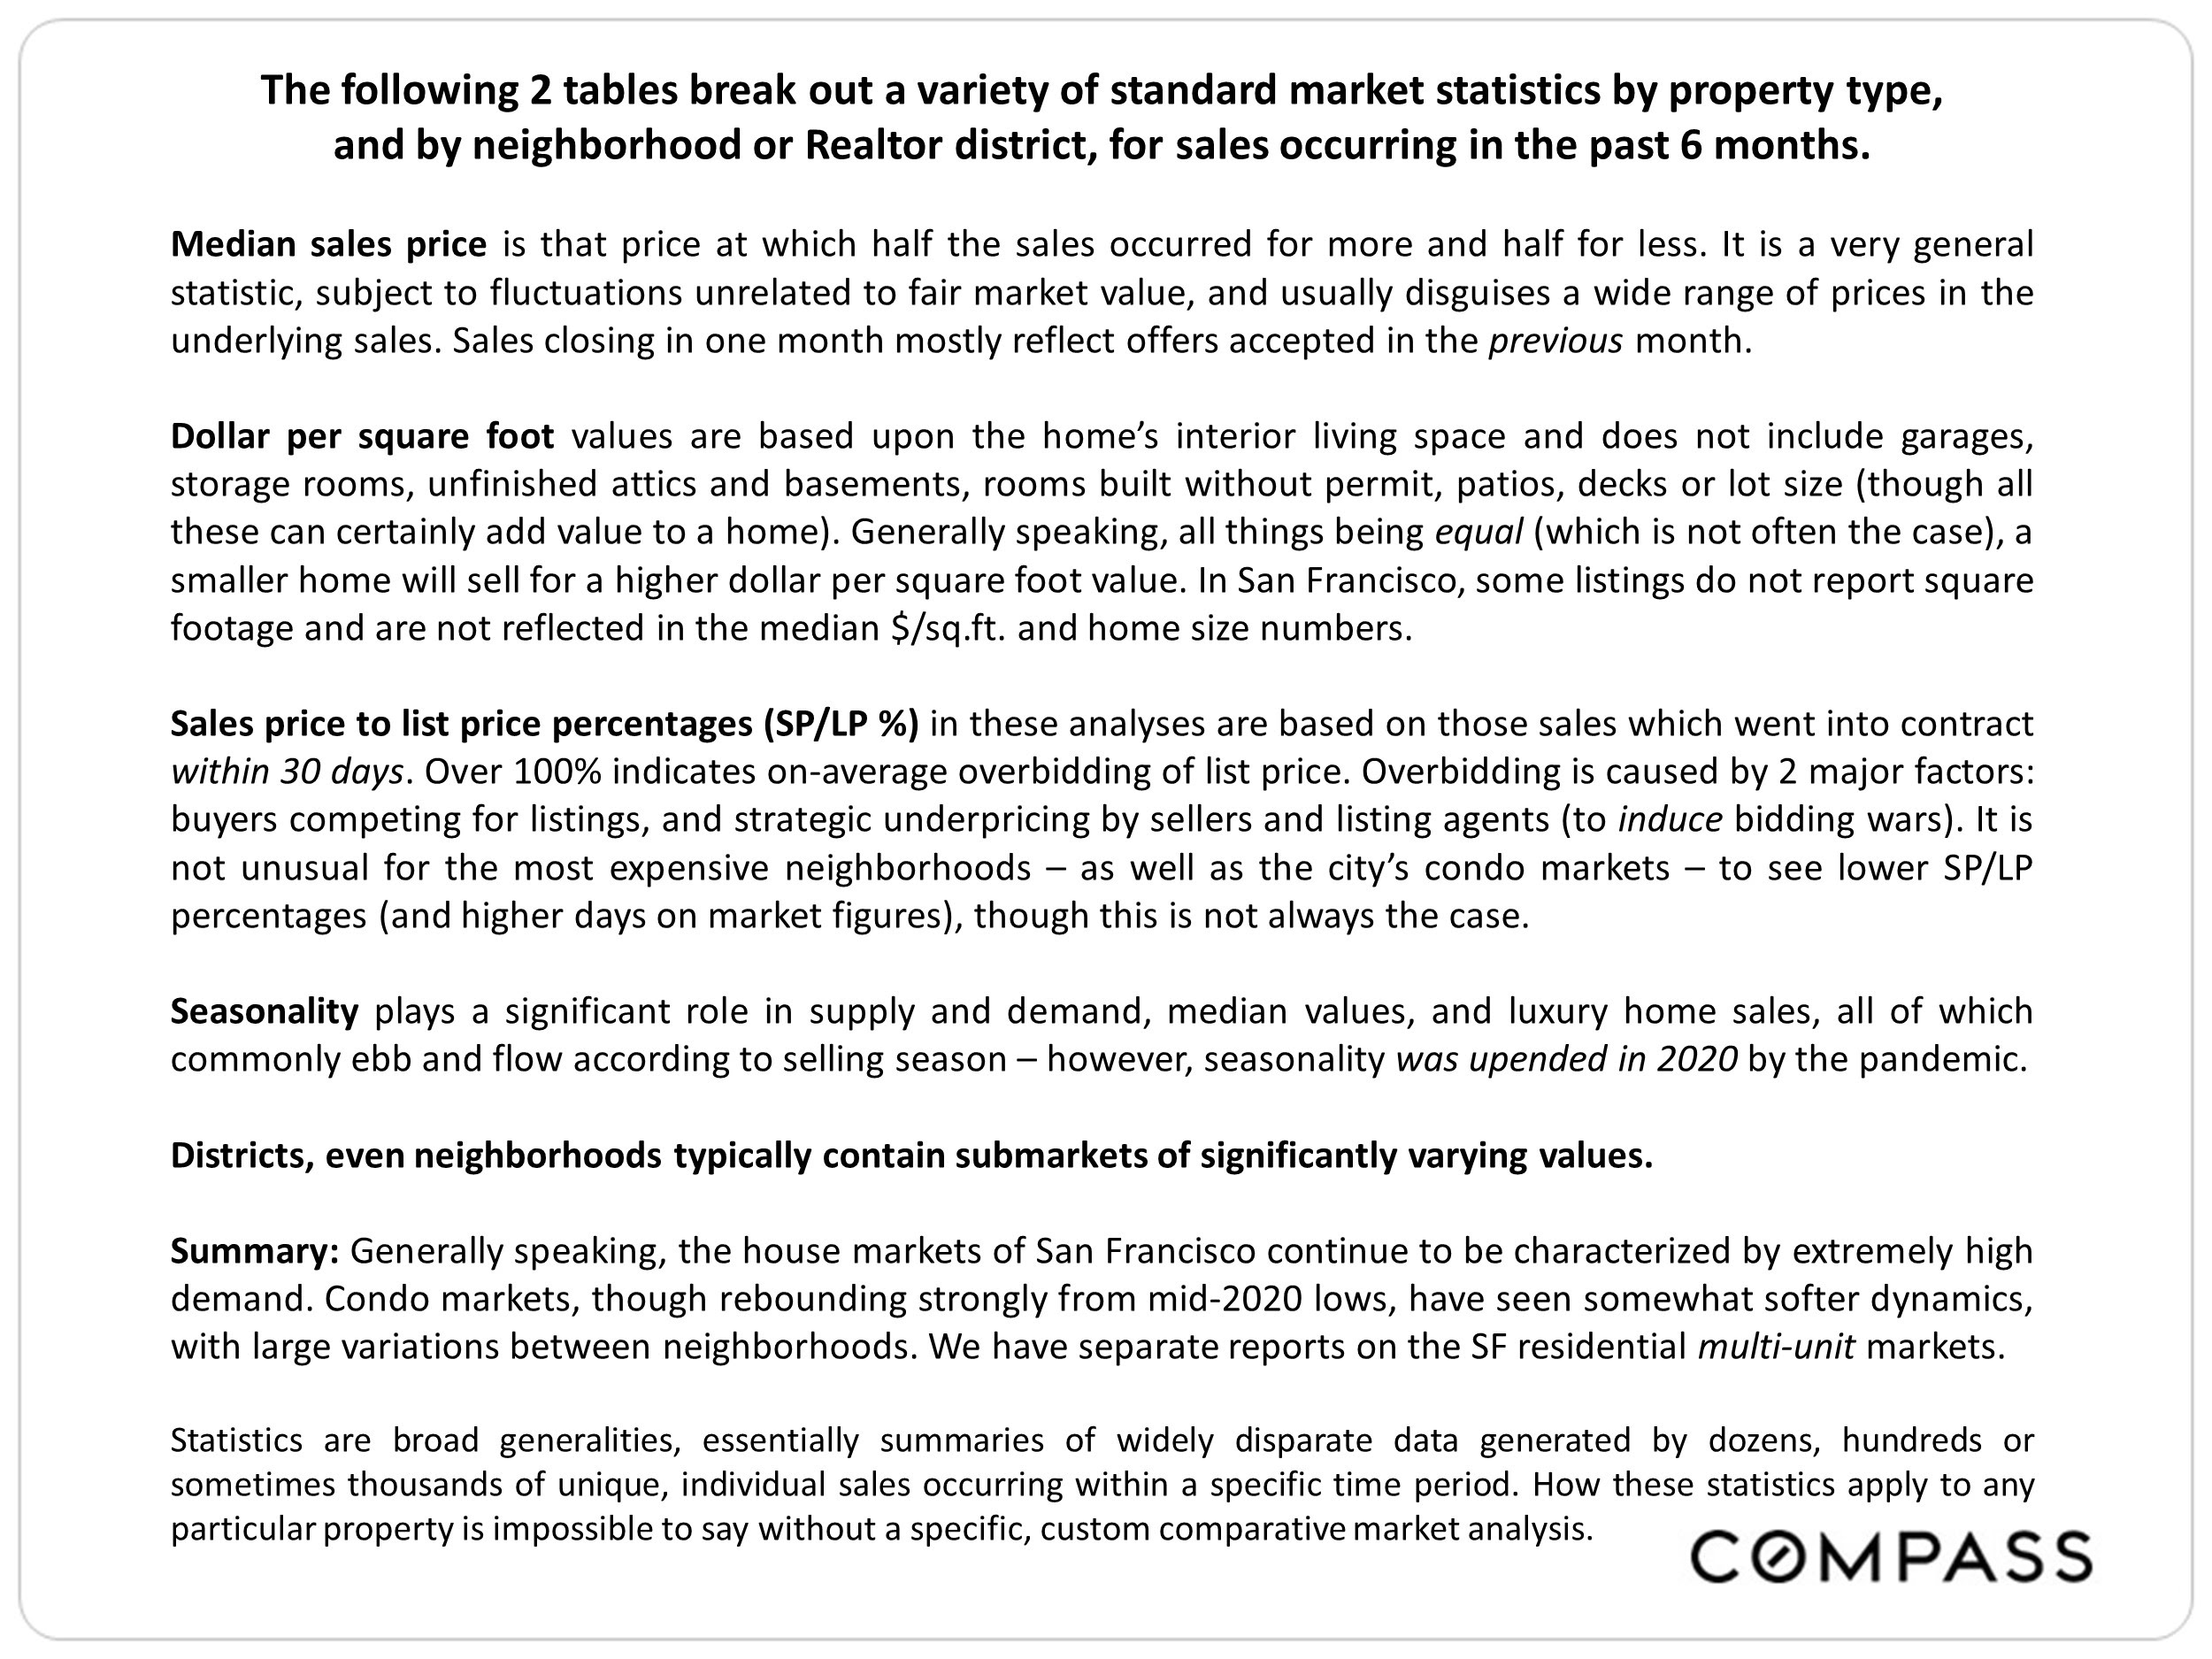
San Francisco residential market report explaining sales statistics, seasonality, neighborhood variation, and market trends.
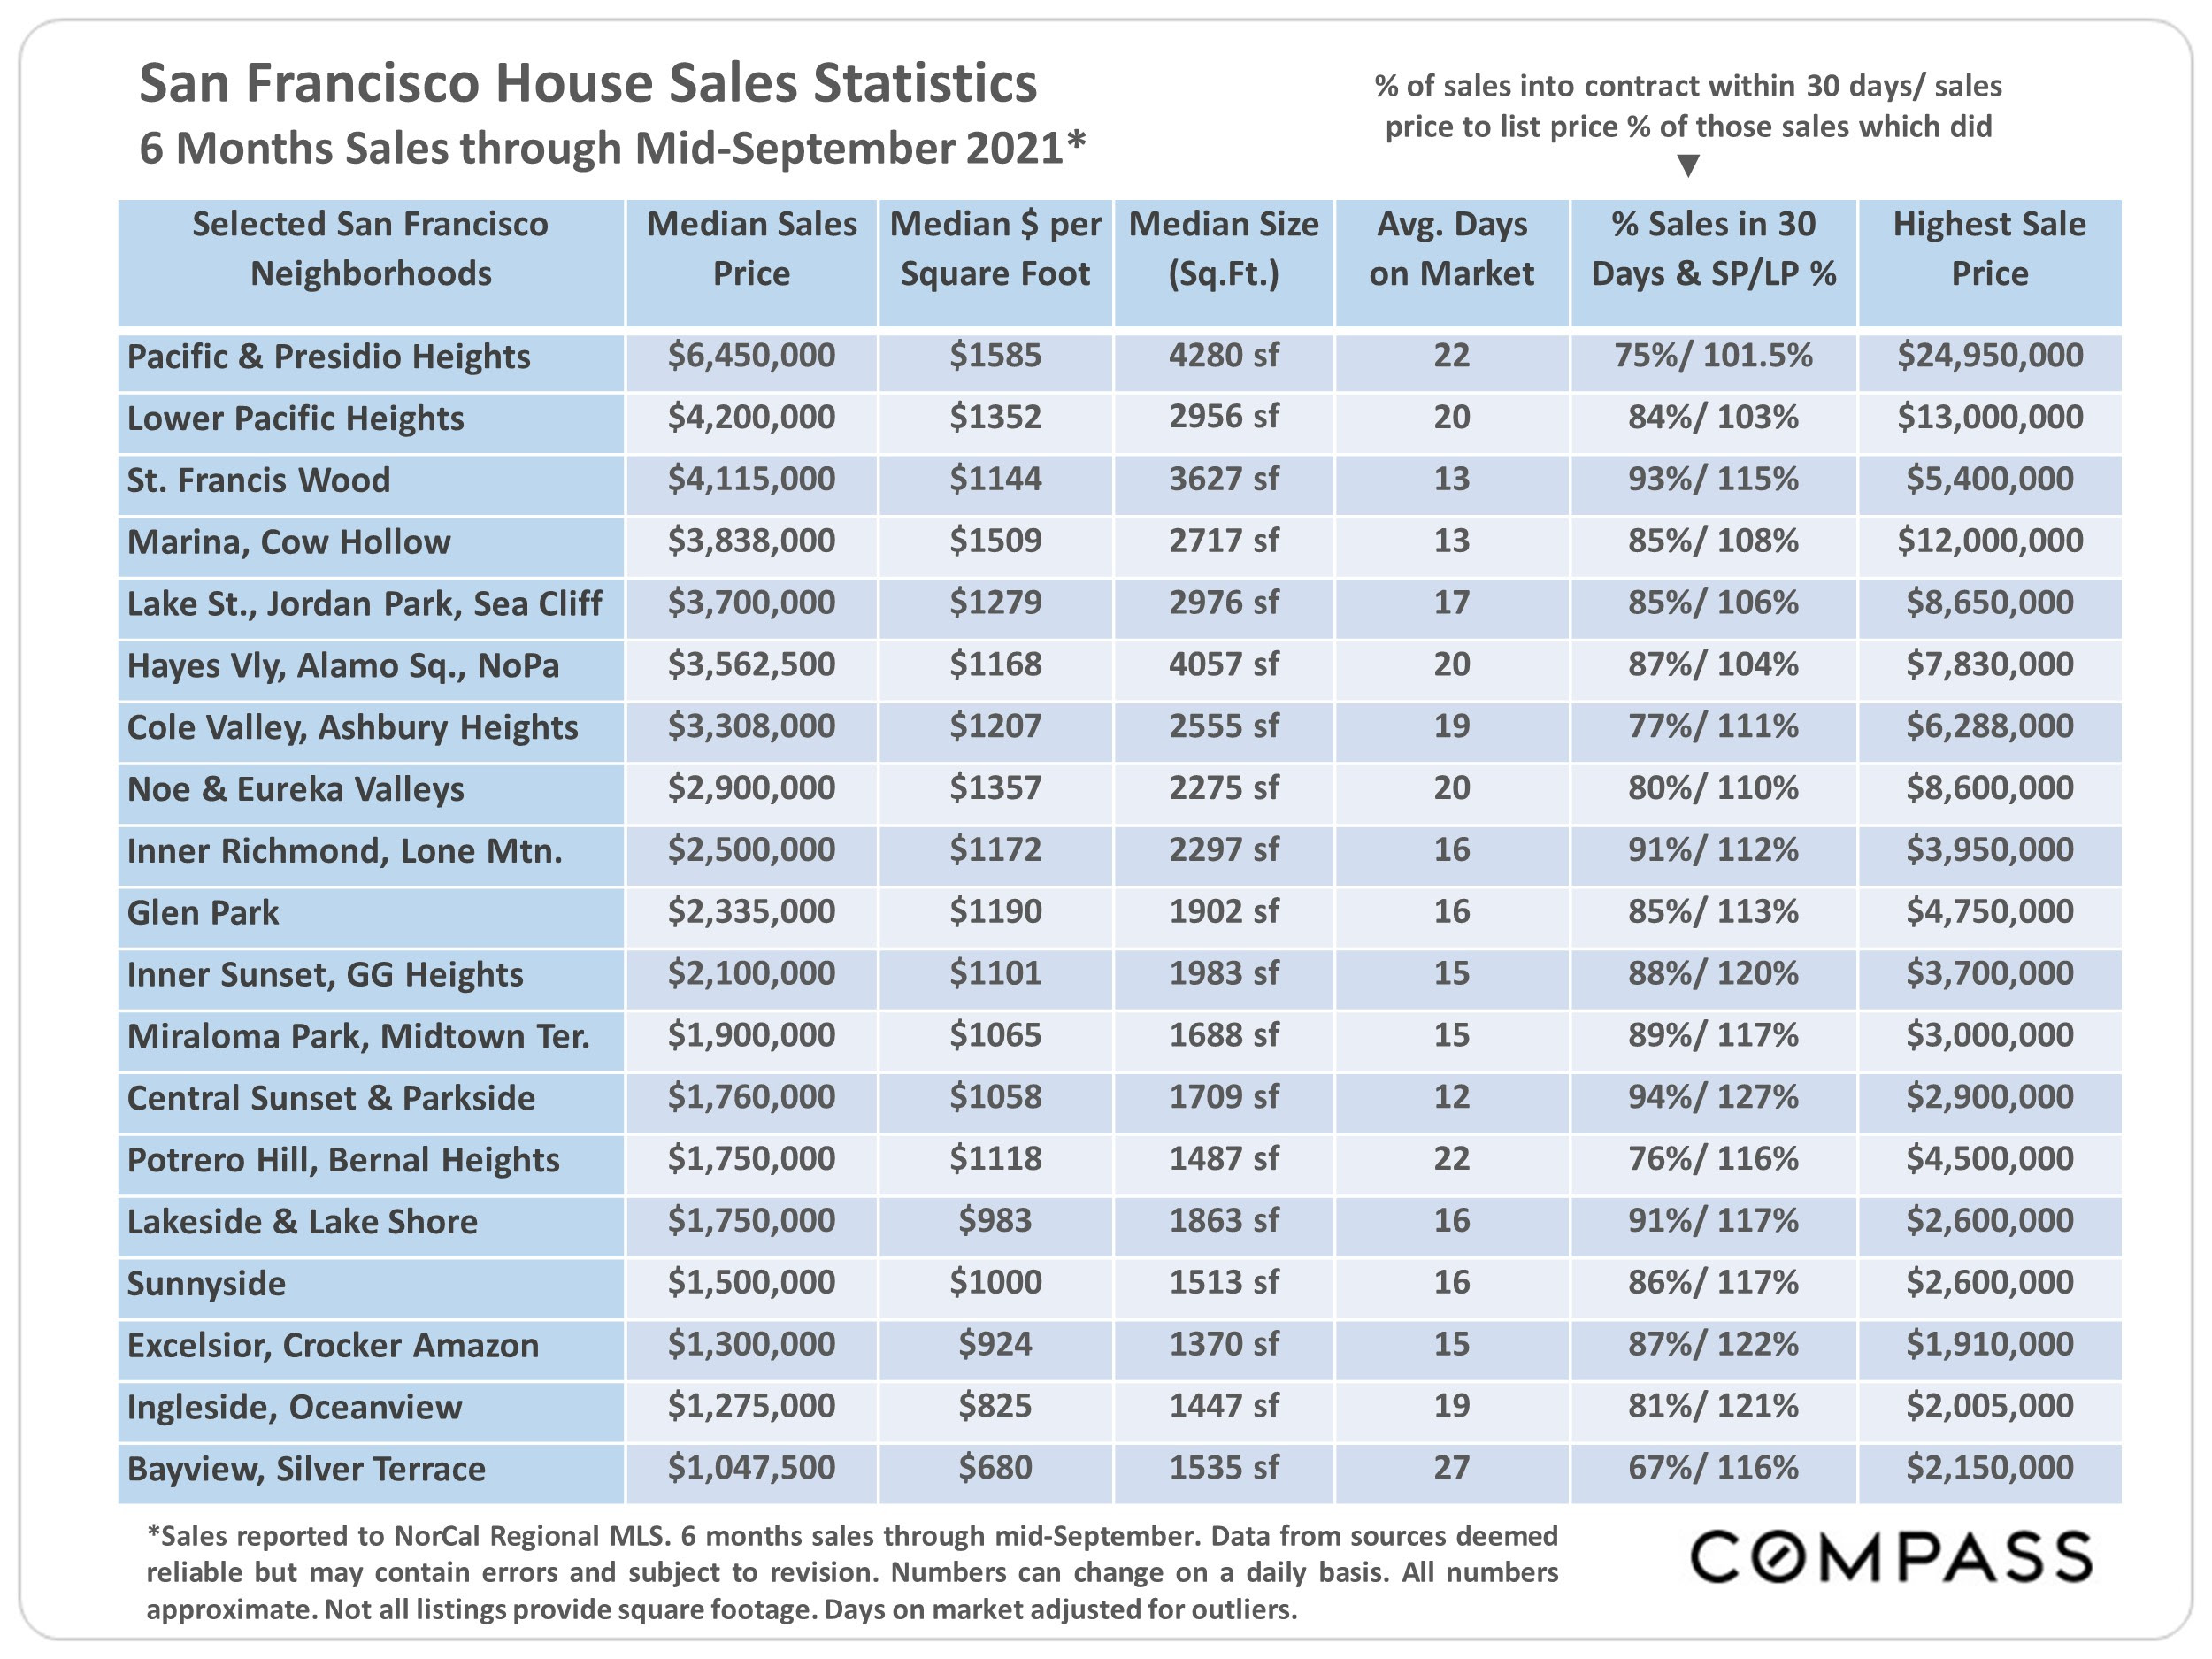
San Francisco home sales statistics table comparing prices, sizes, days on market, and sale-to-list ratios by neighborhood.
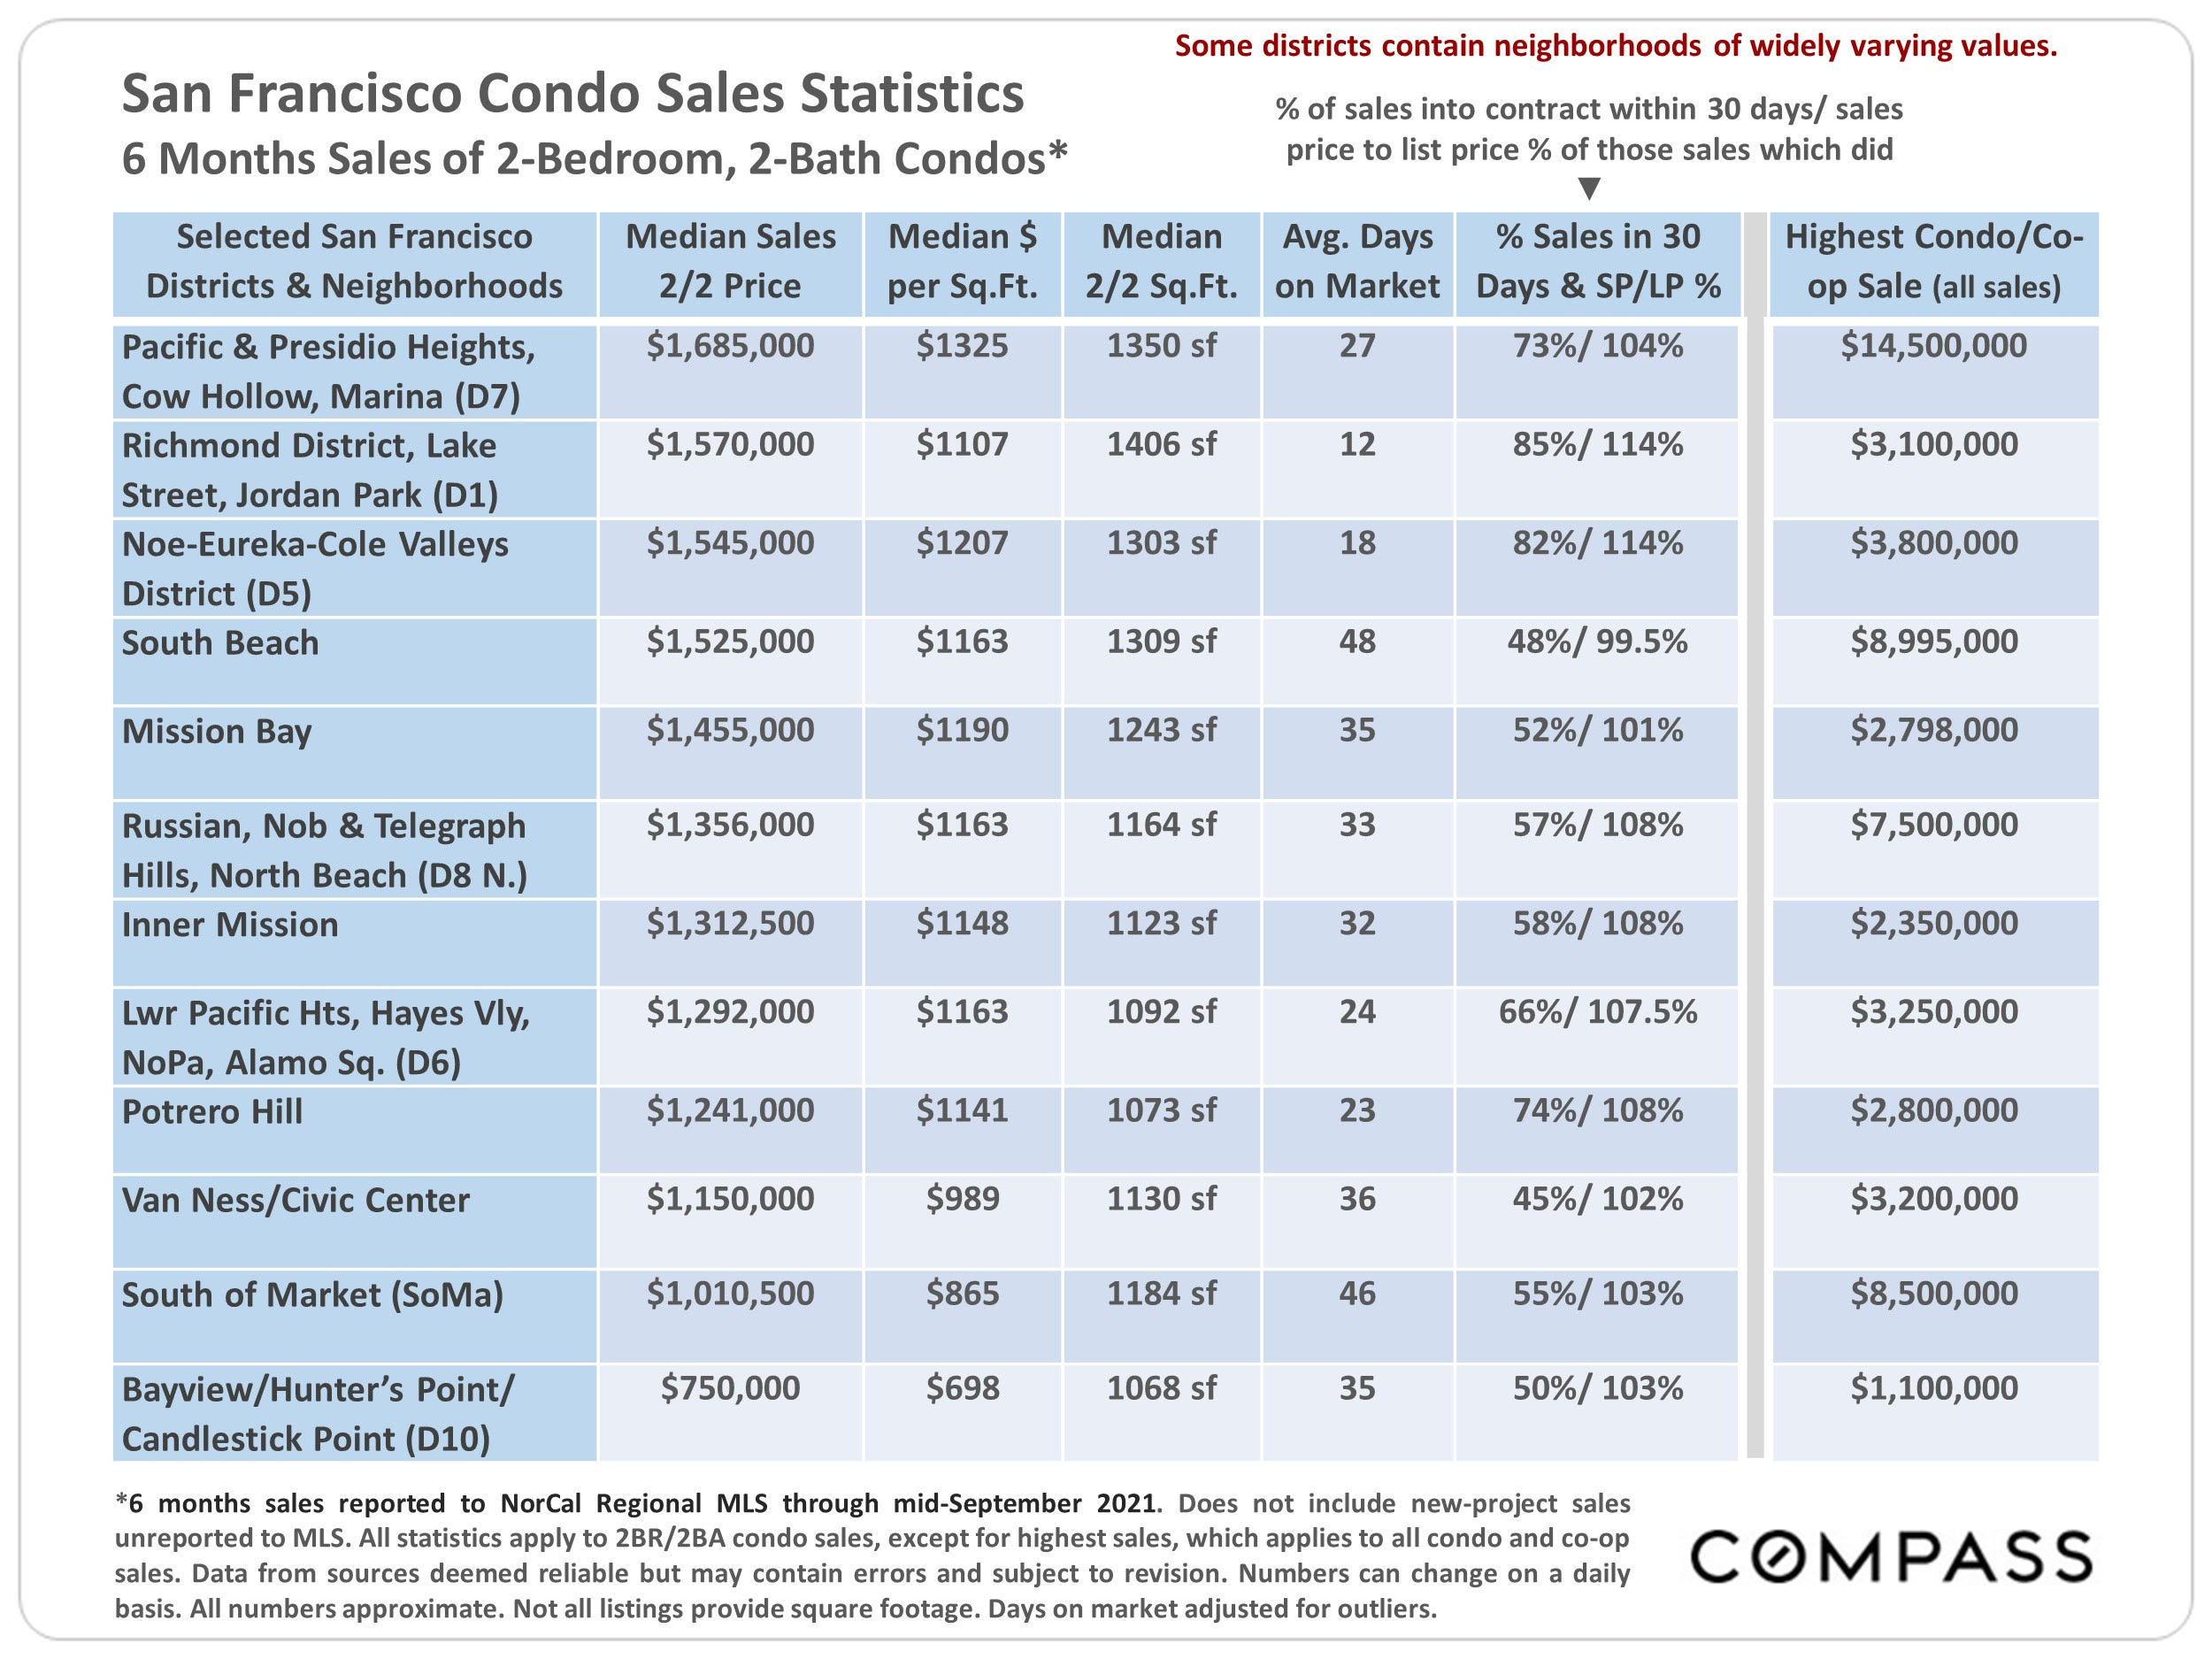
Table comparing San Francisco two-bedroom condo sales statistics by district and neighborhood.
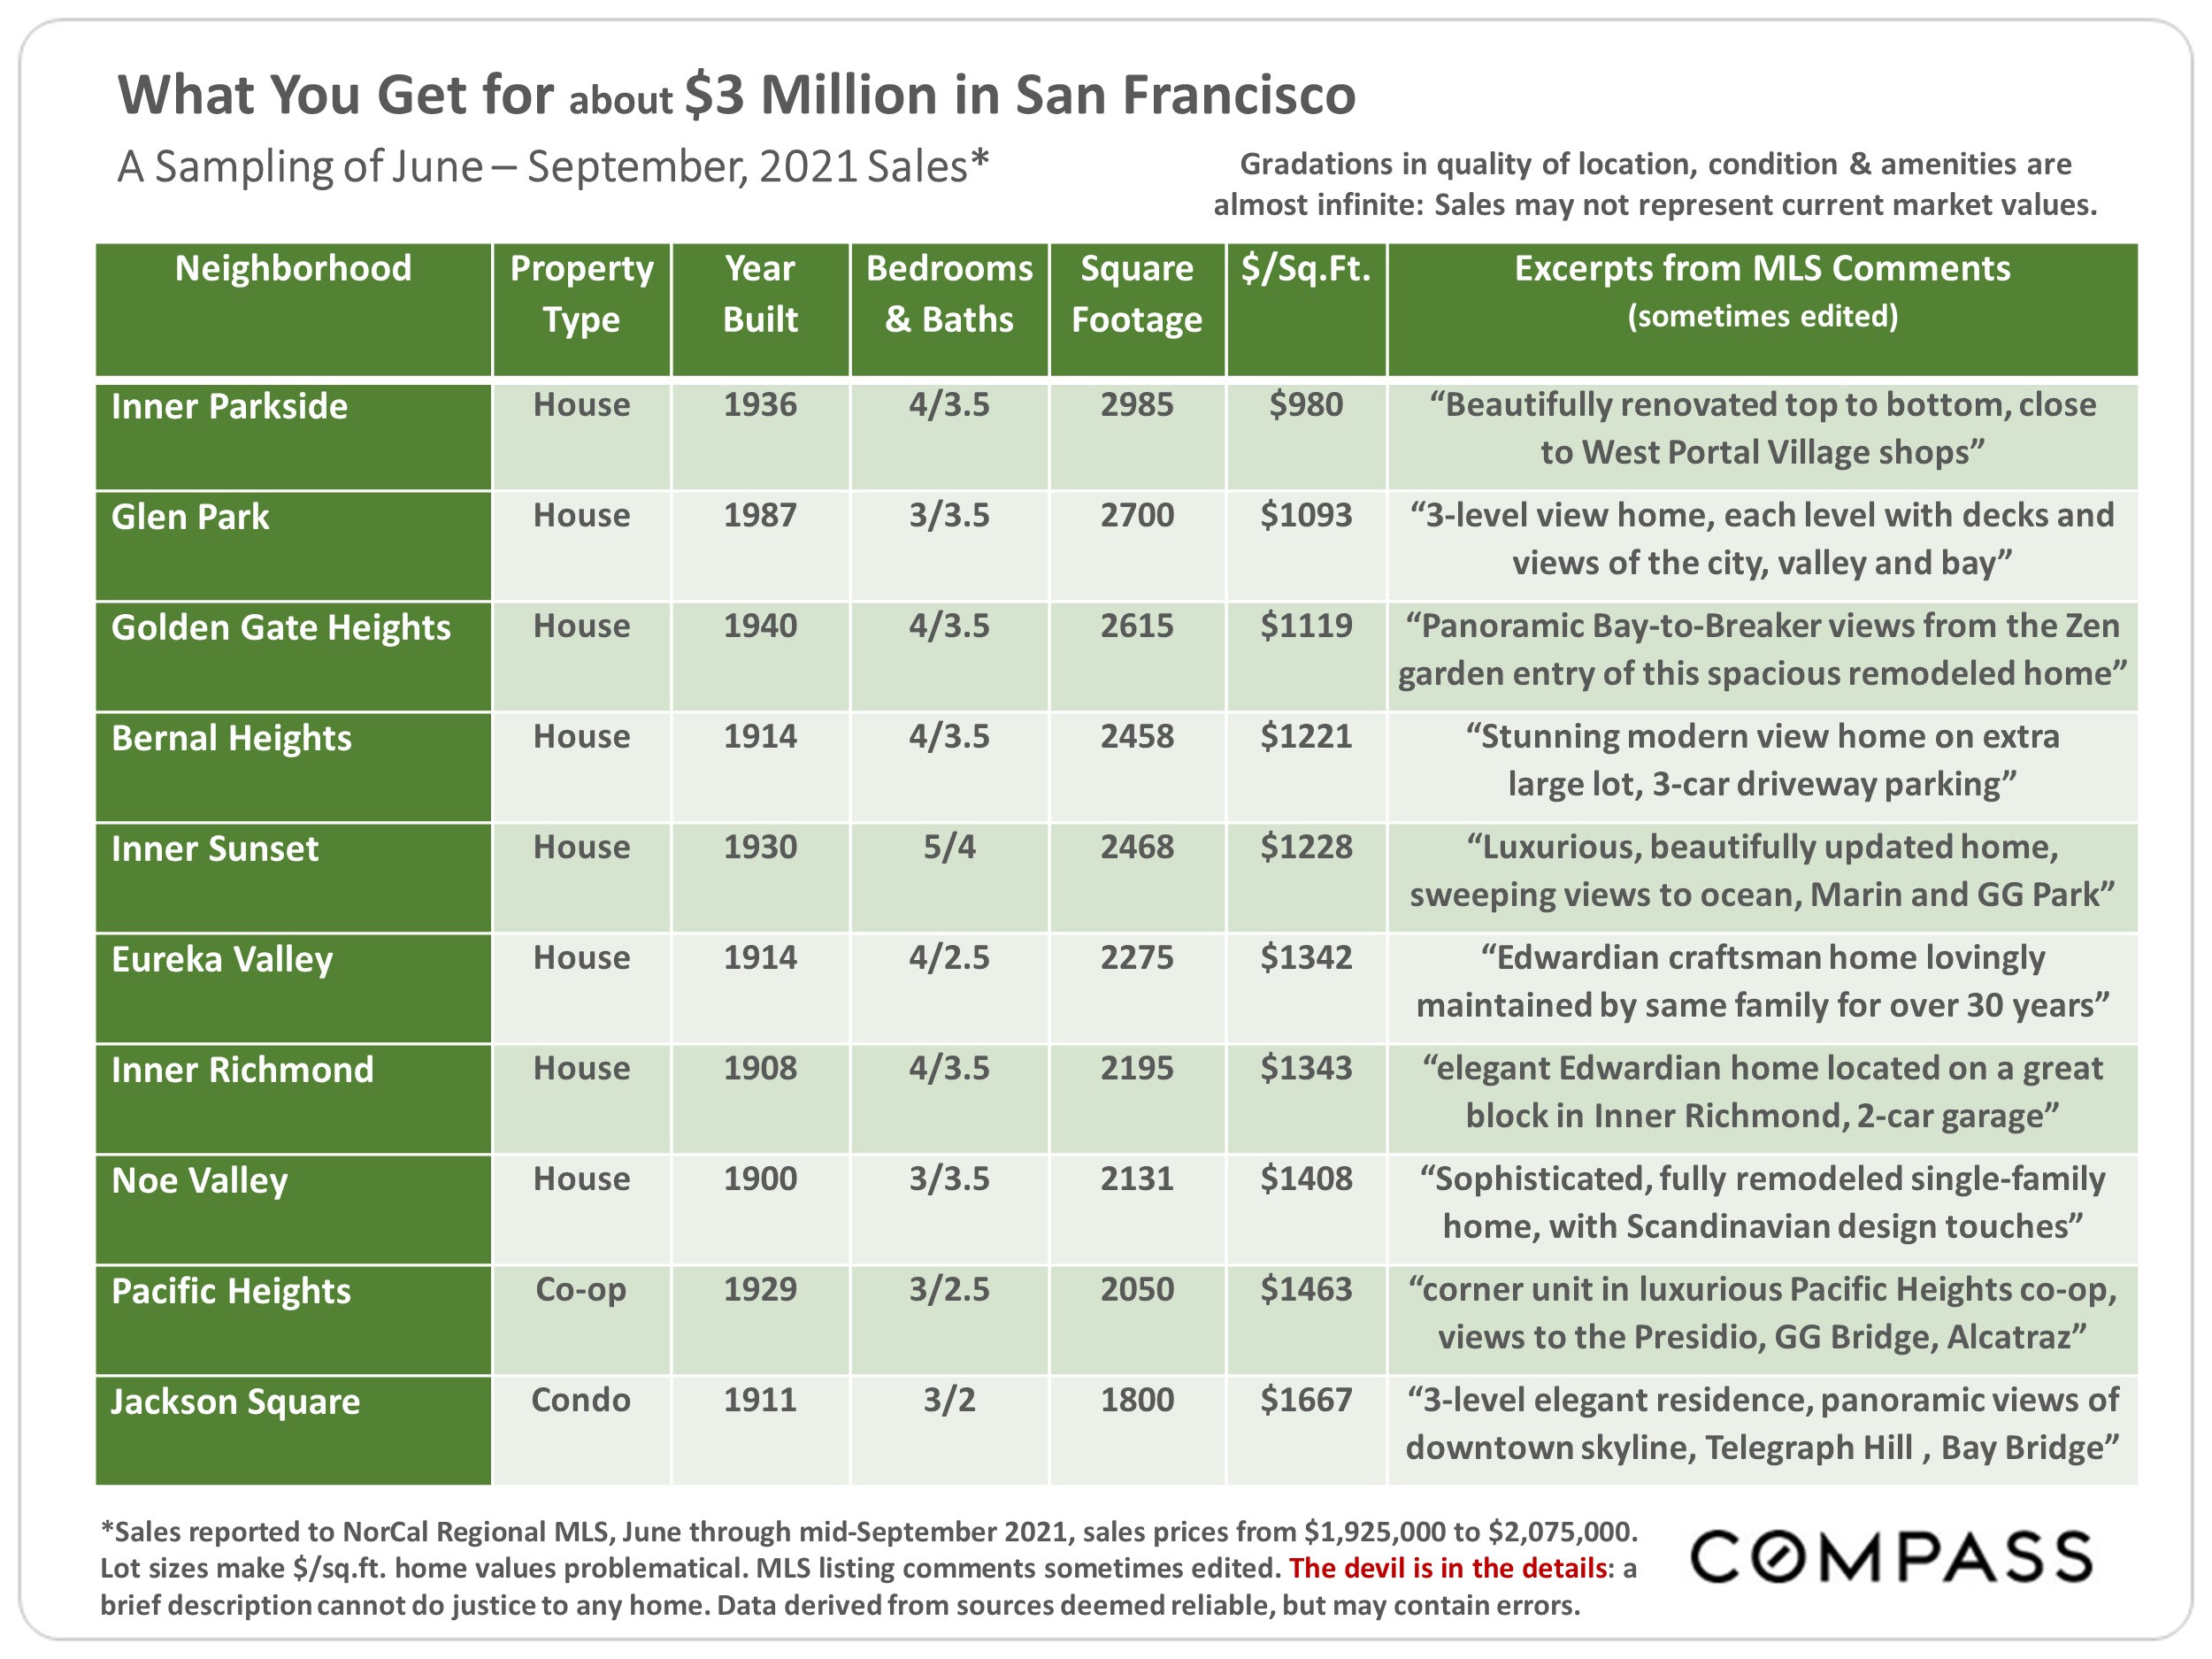
San Francisco home sales infographic comparing ten neighborhoods, property details, prices per square foot, and listing comments.
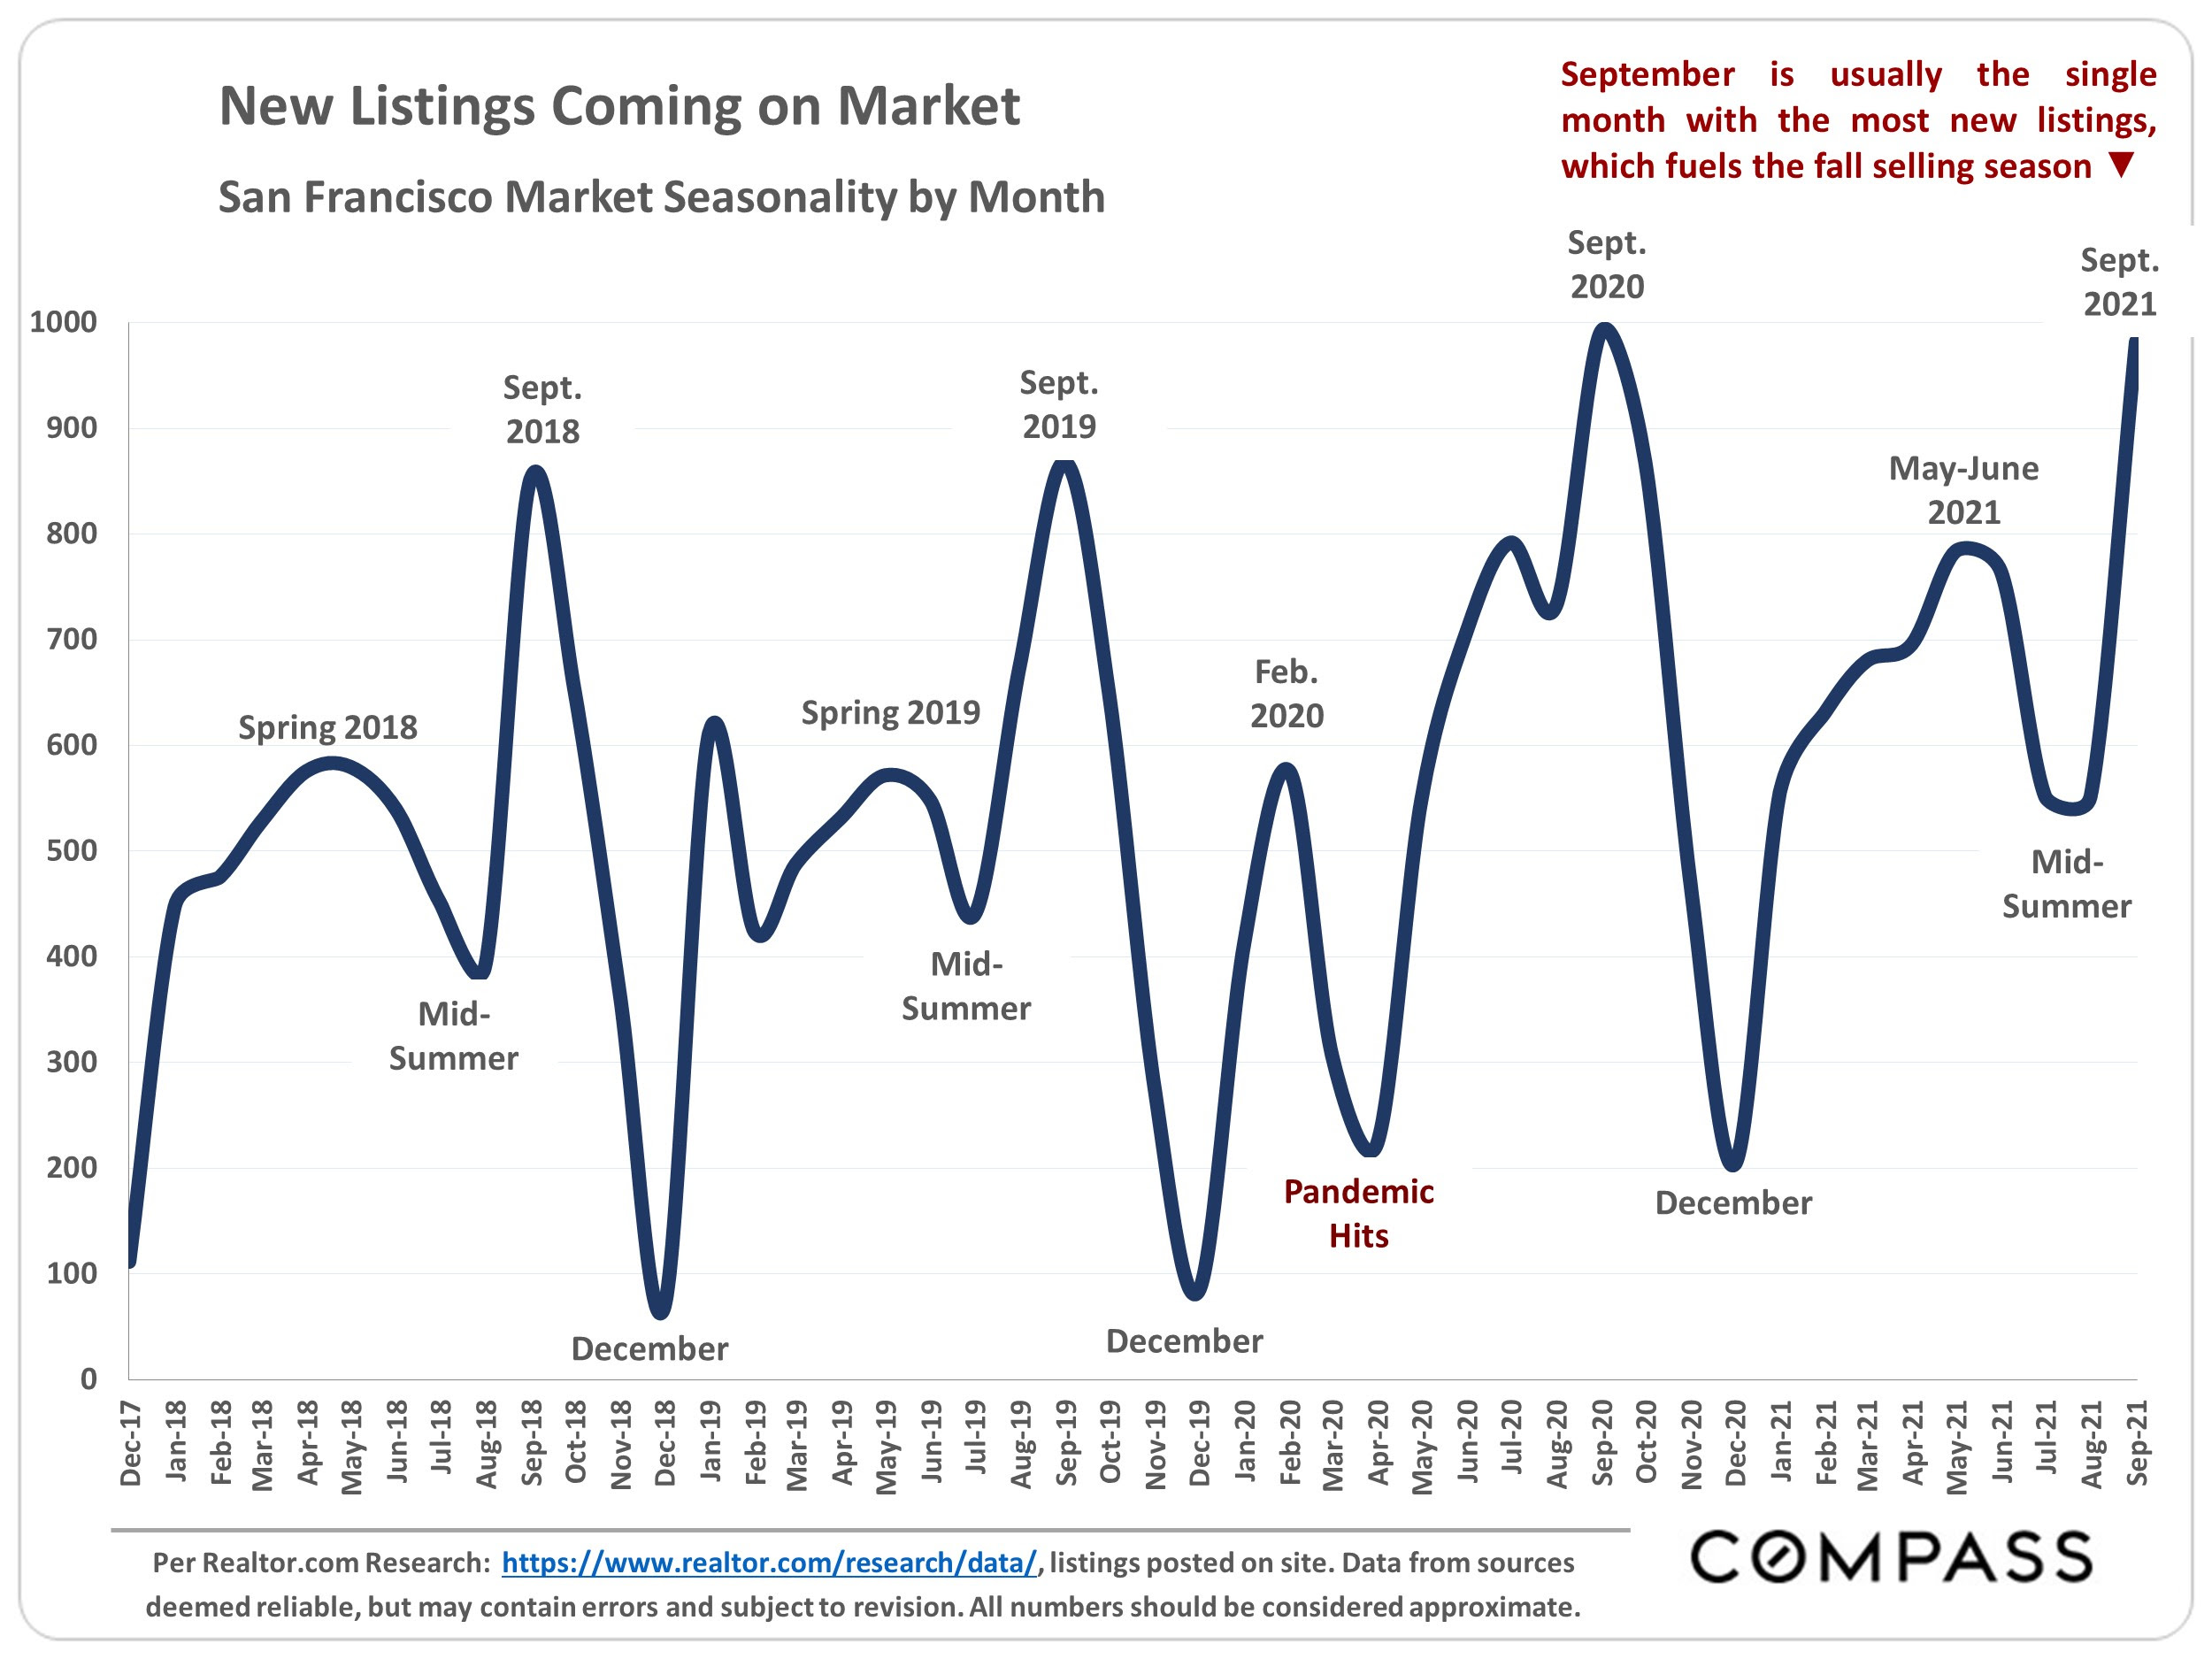
Chart of San Francisco new listings, showing recurring September peaks and December dips from 2017 to 2021.
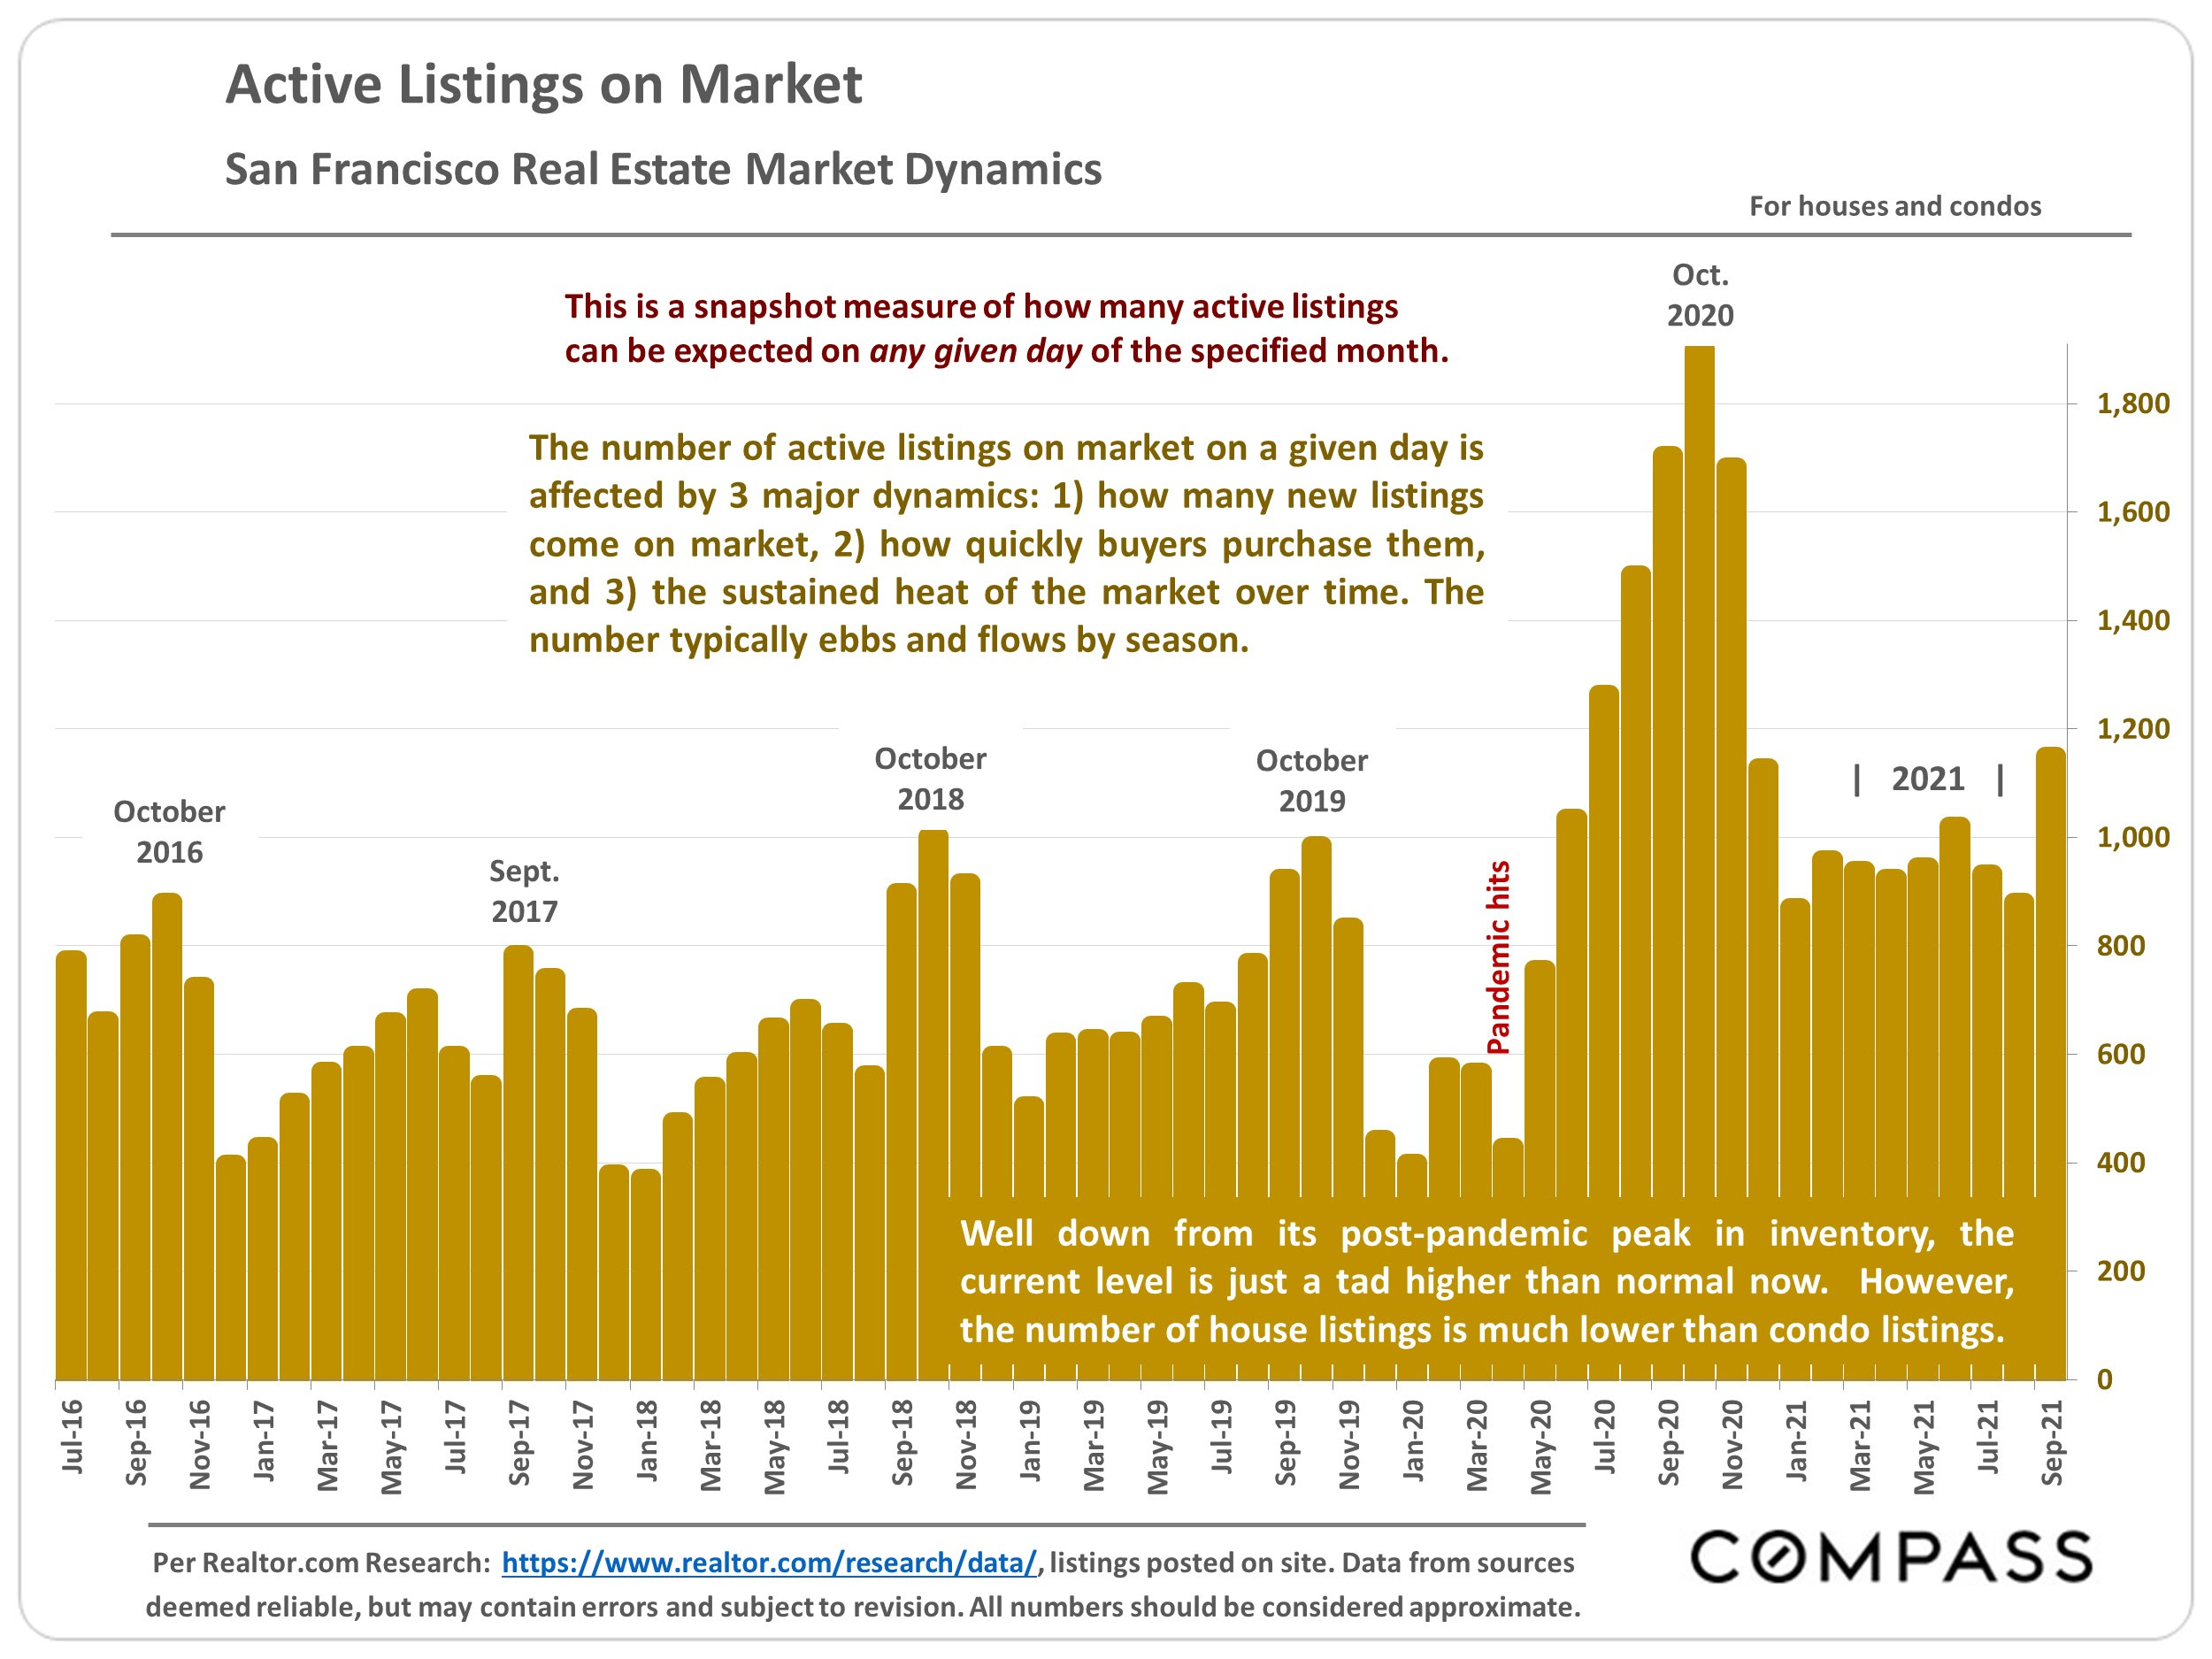
Bar chart of San Francisco active listings, July 2016–September 2021, peaking in October 2020.
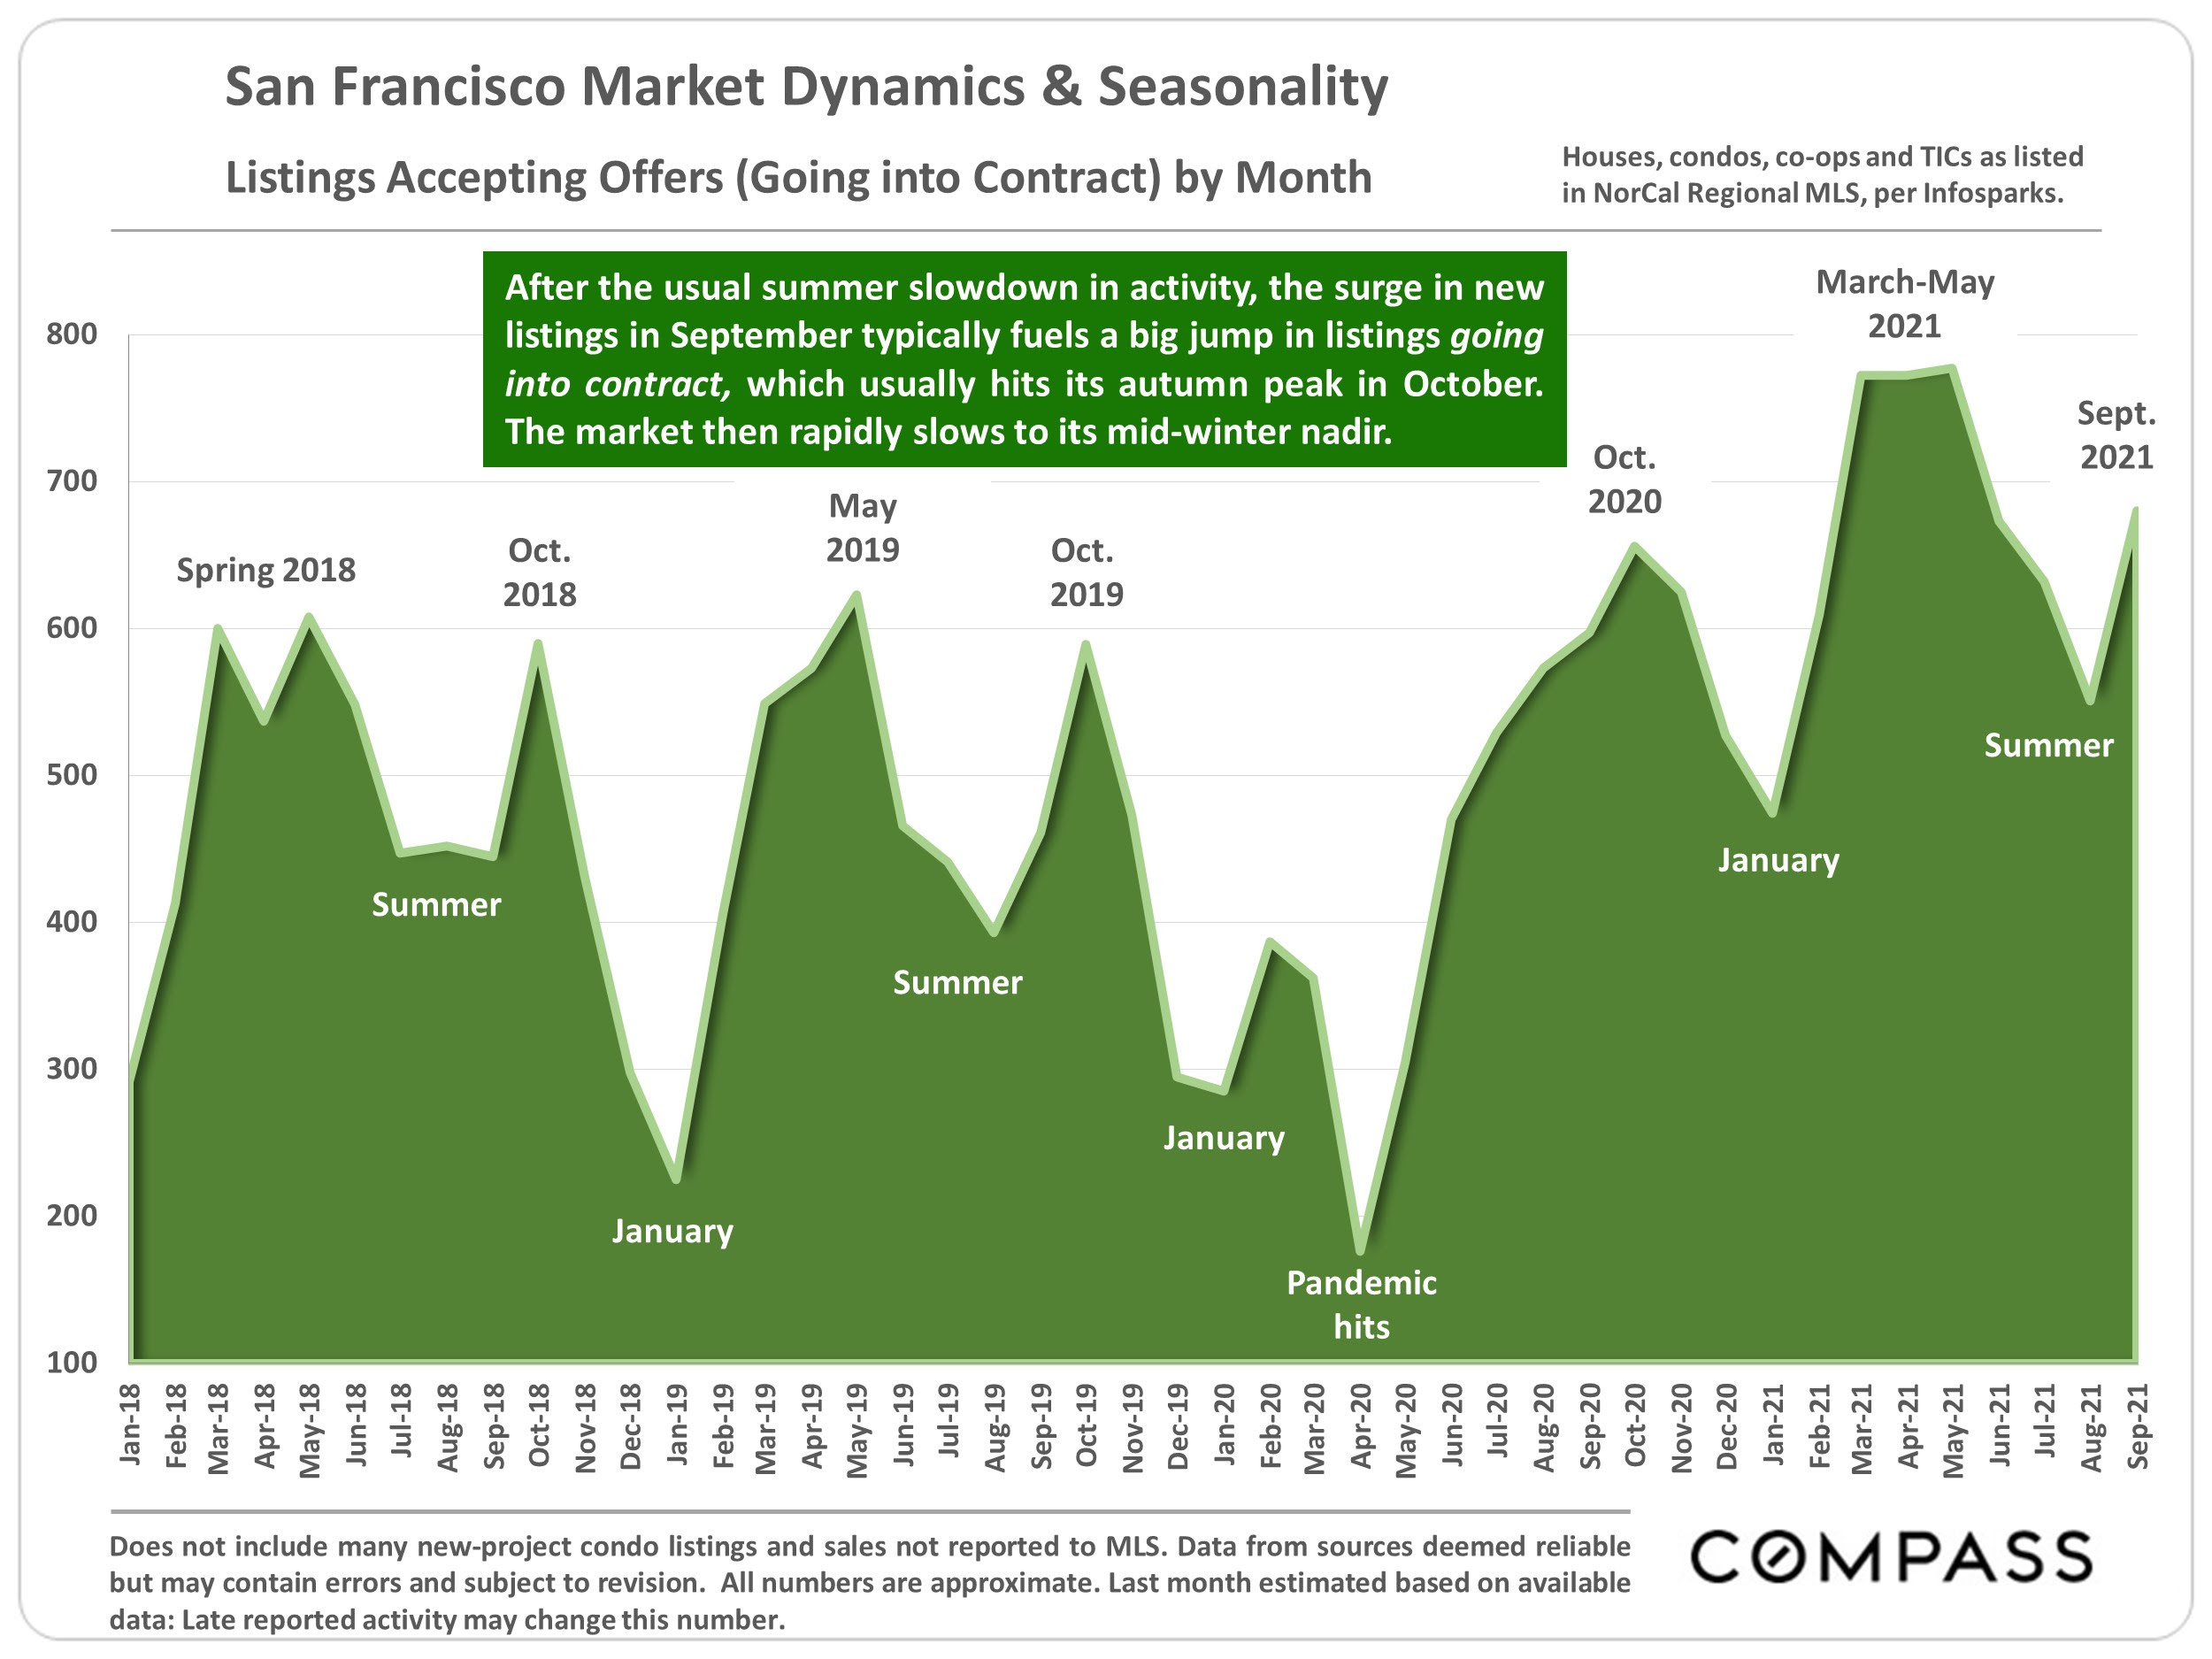
Chart of San Francisco listings going under contract, showing seasonal patterns from January 2018 to September 2021.
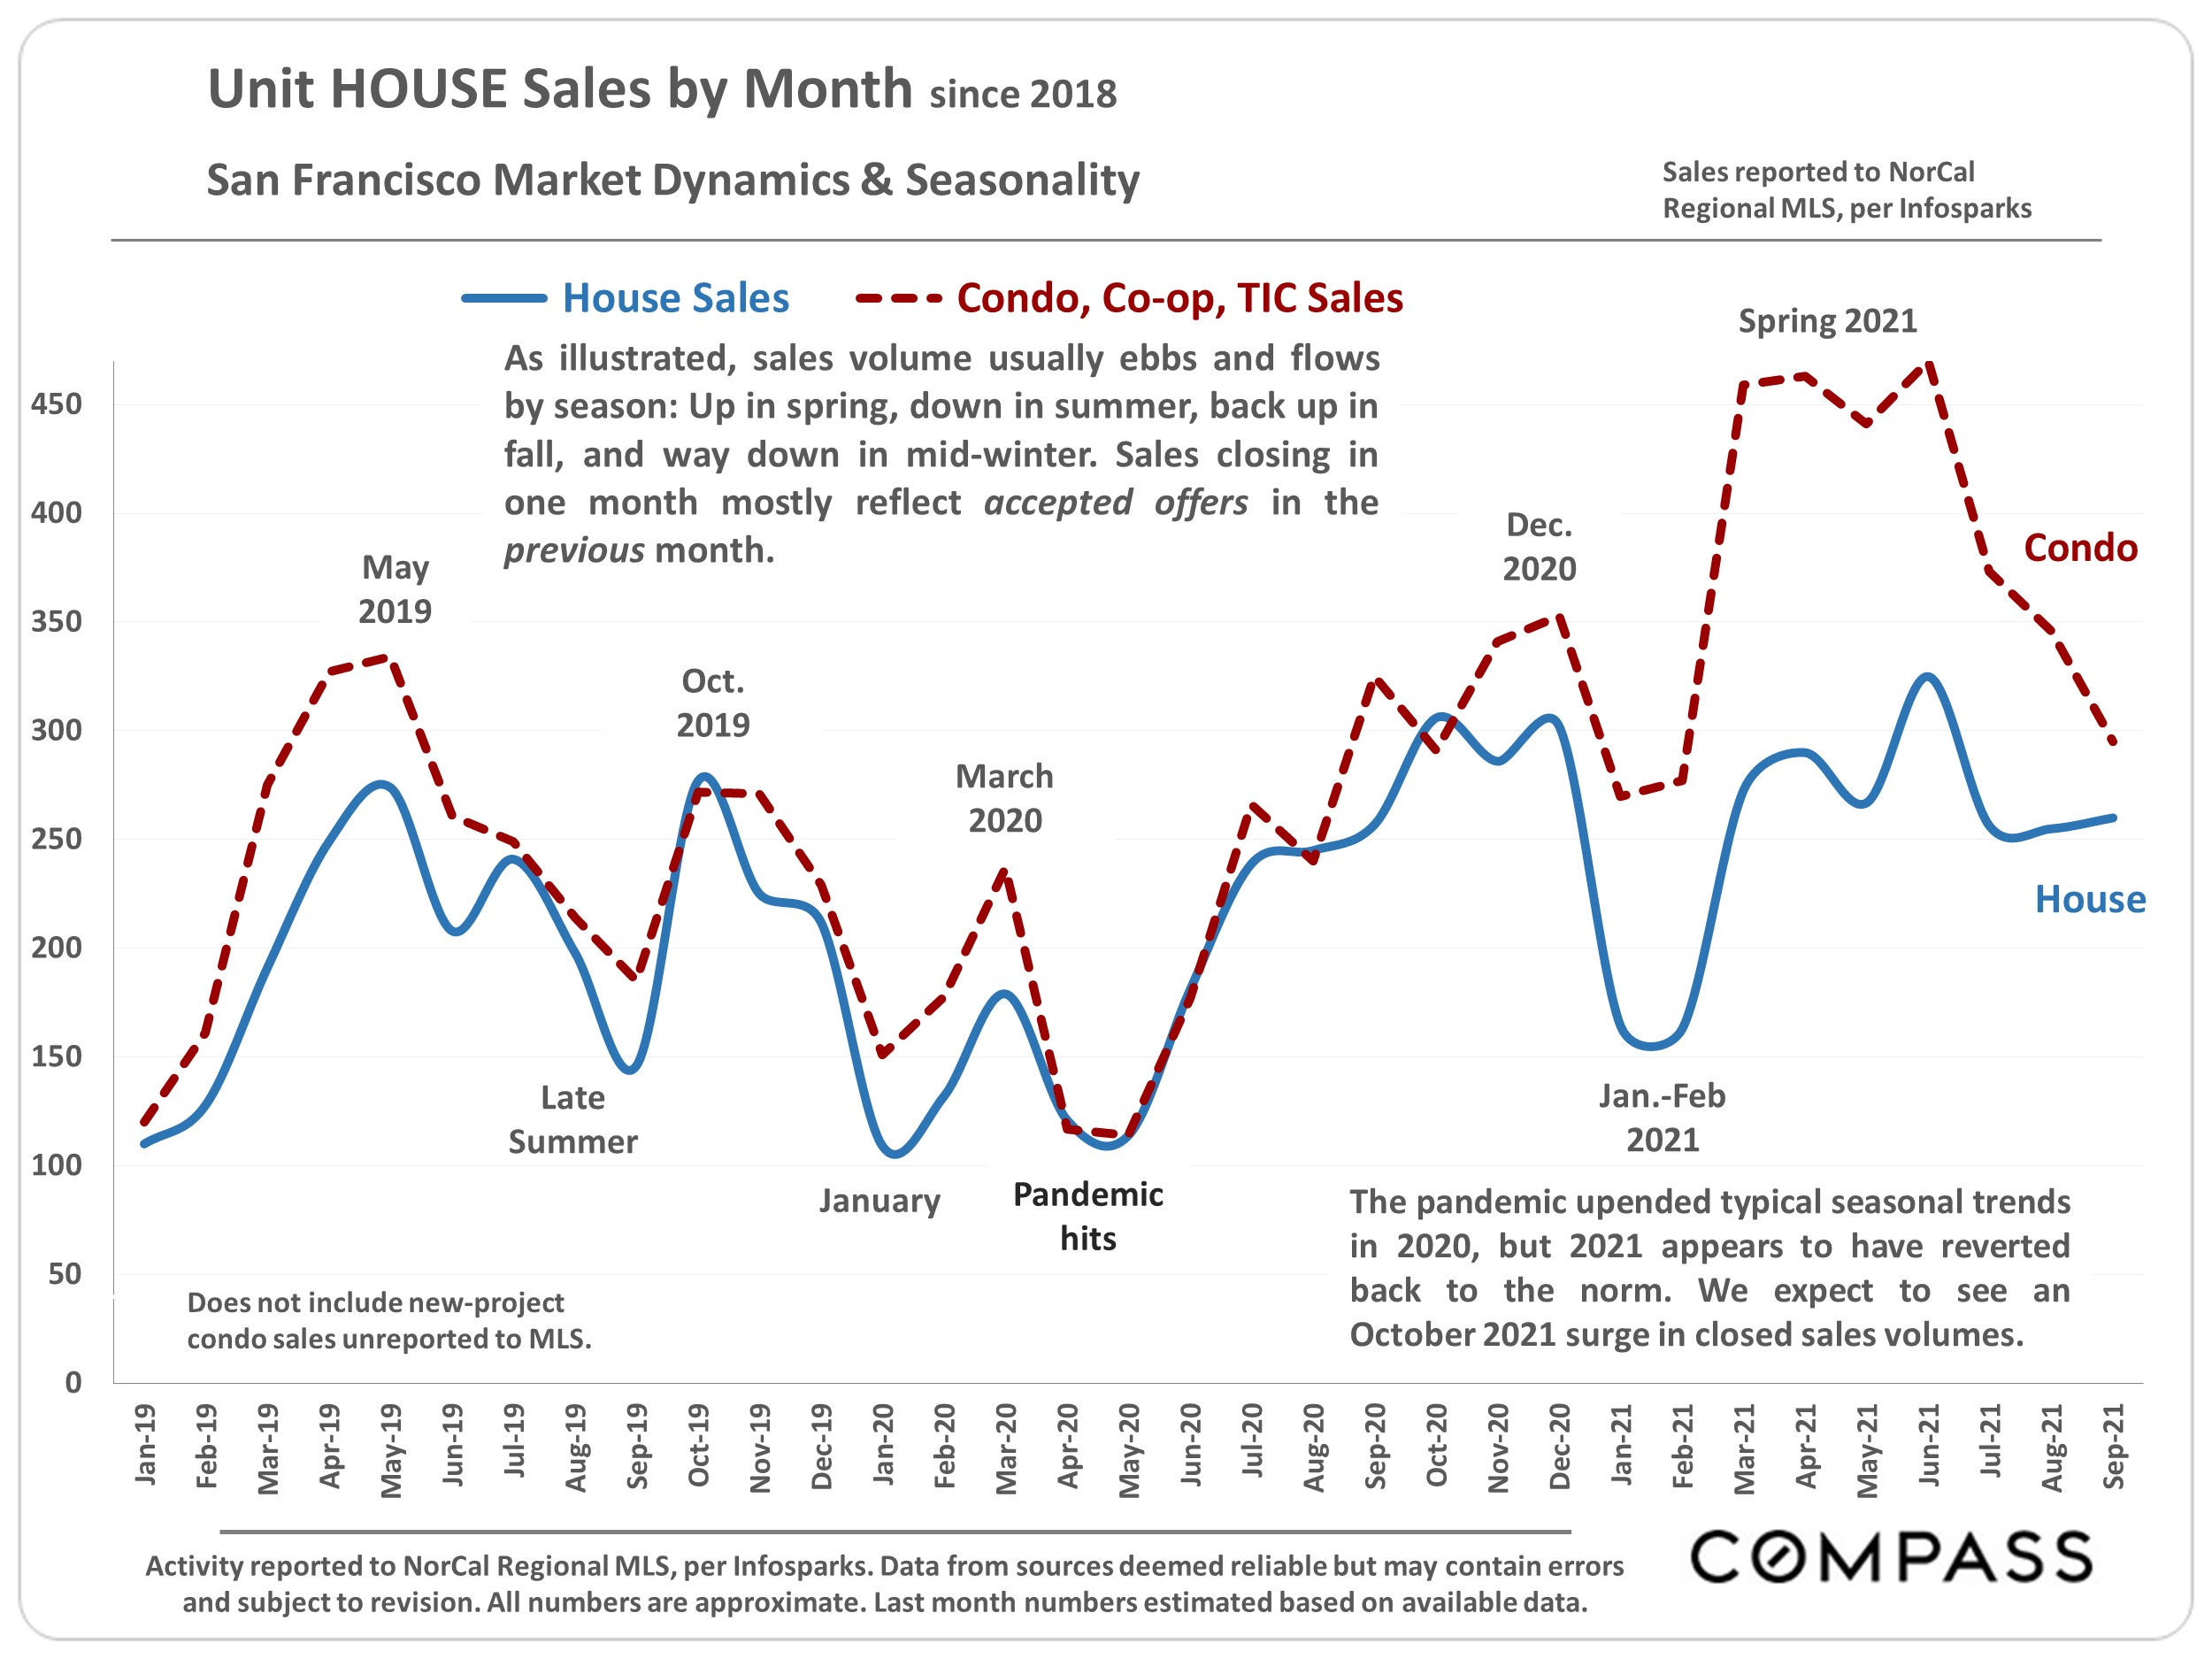
San Francisco monthly house and condo sales chart, January 2019–September 2021, with pandemic and seasonal annotations.
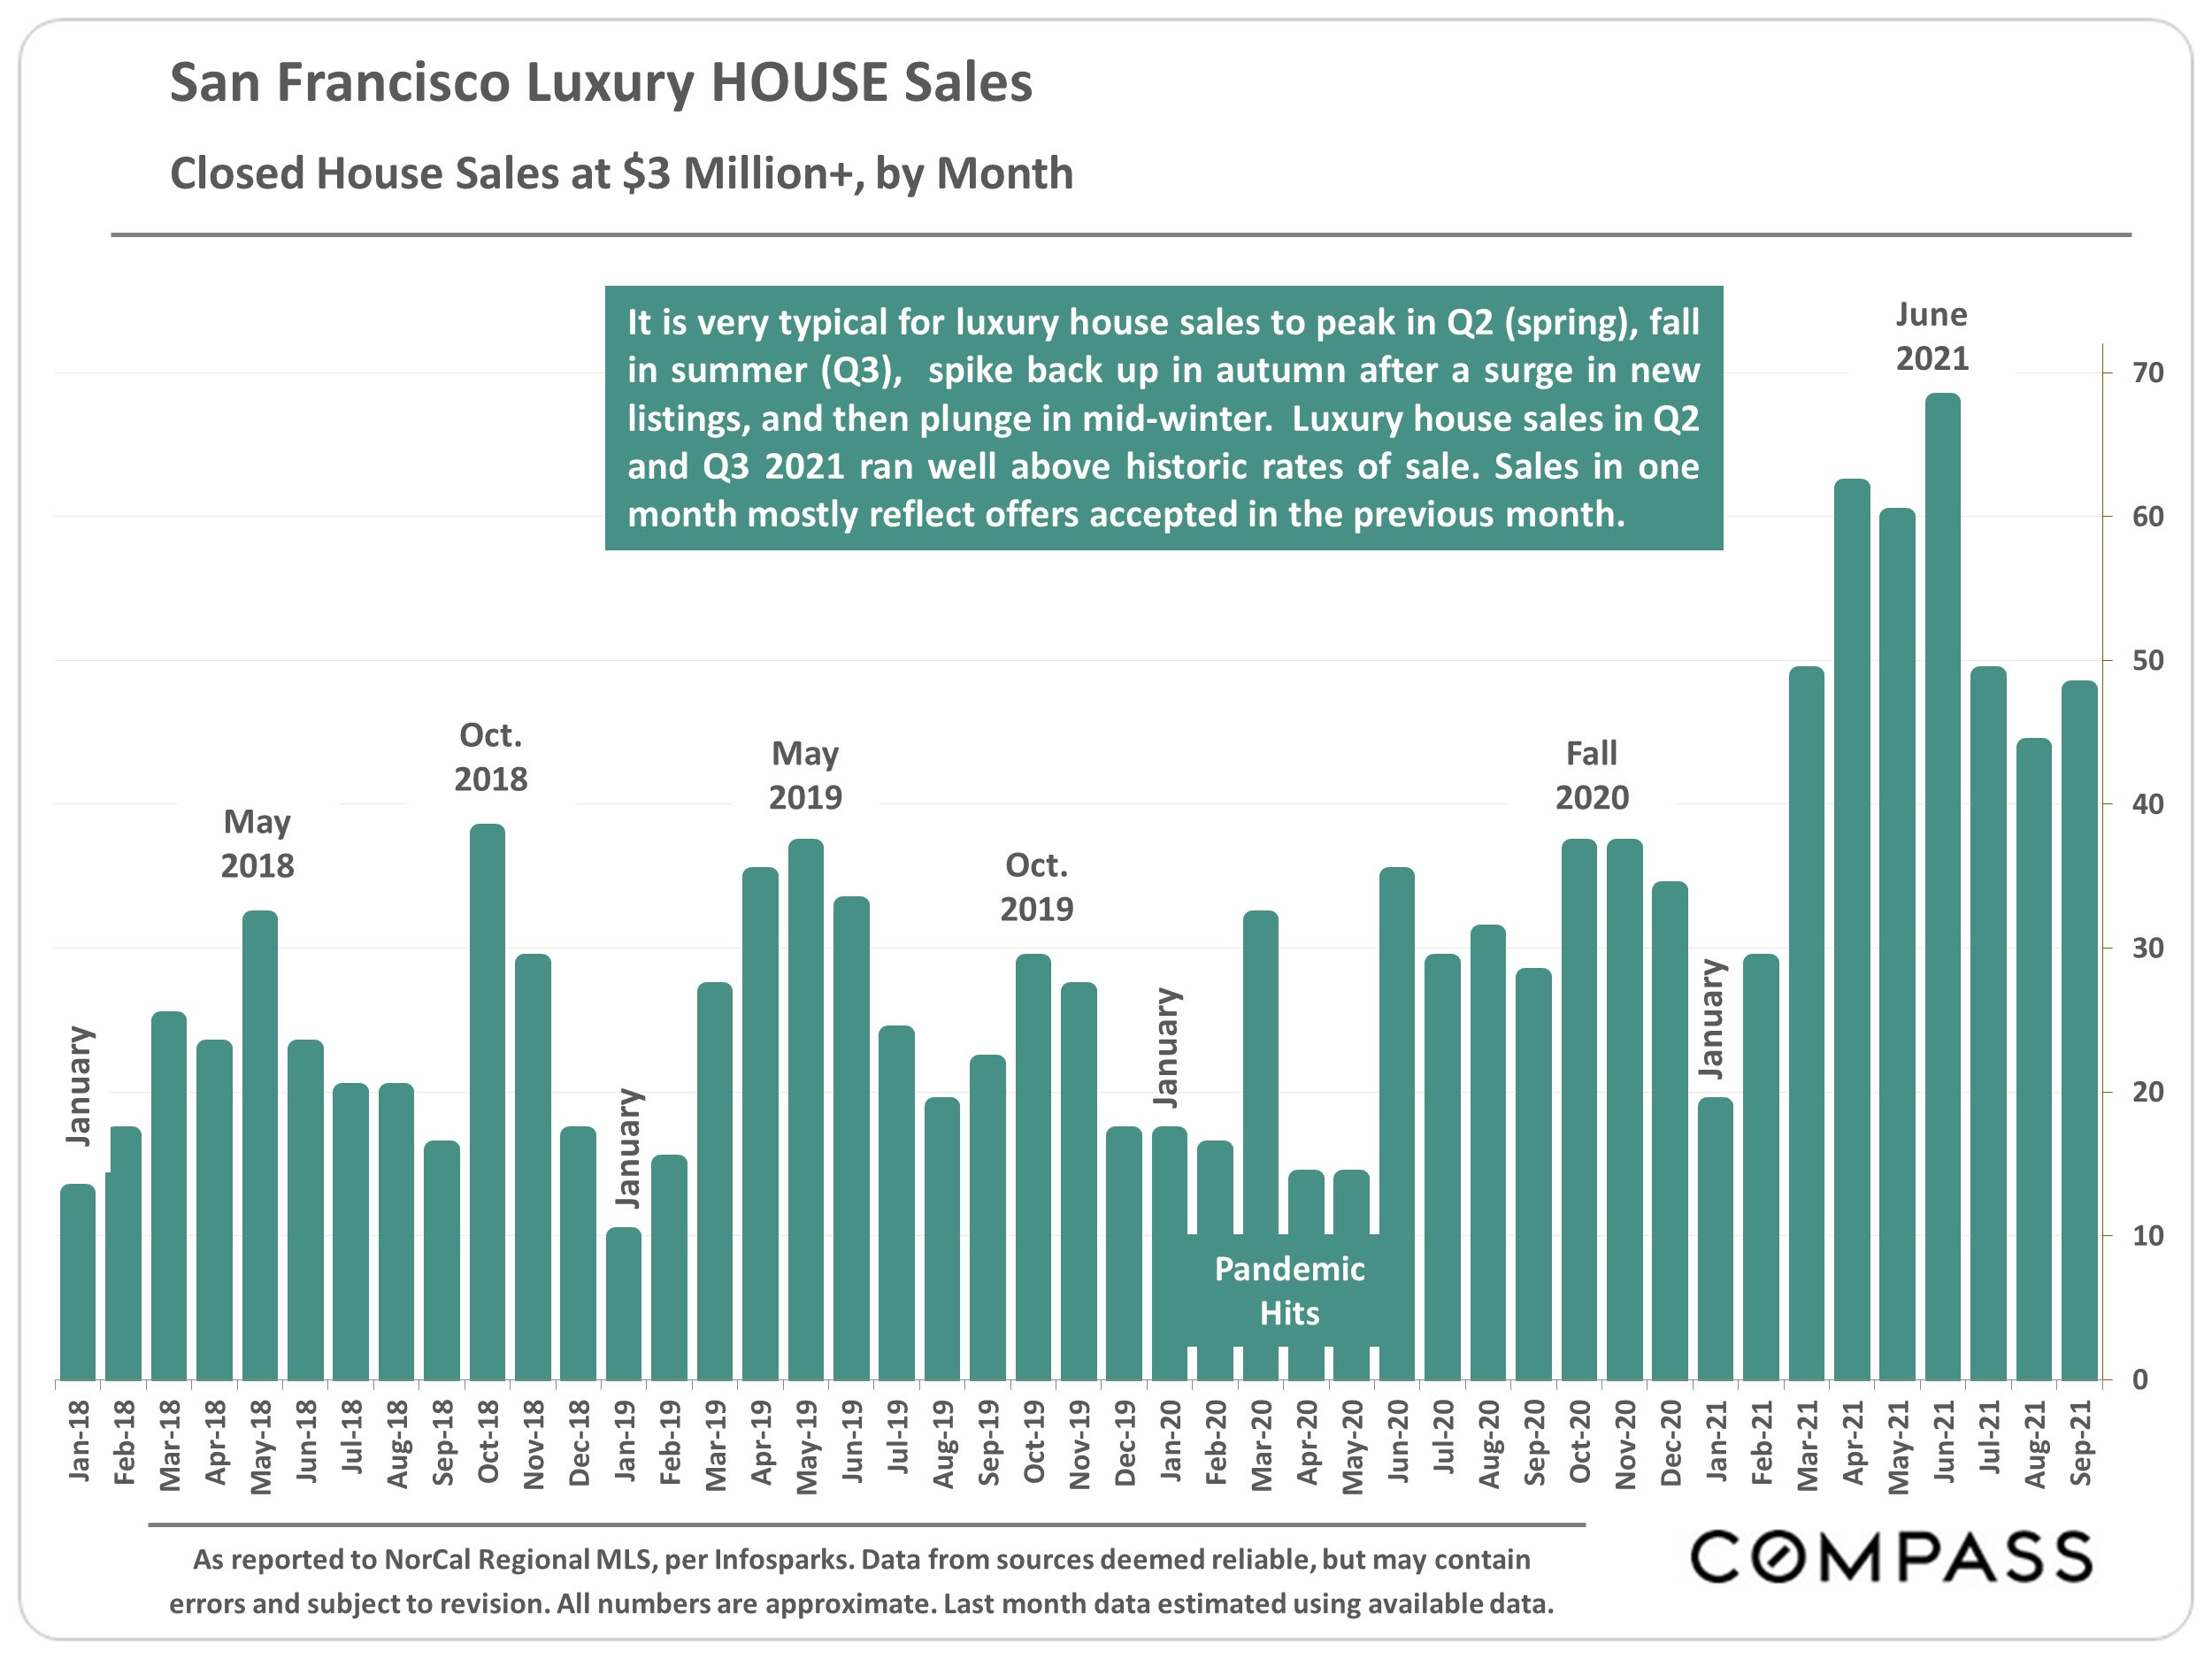
Bar chart of San Francisco luxury home sales over $3 million, January 2018–September 2021, with a 2021 surge.
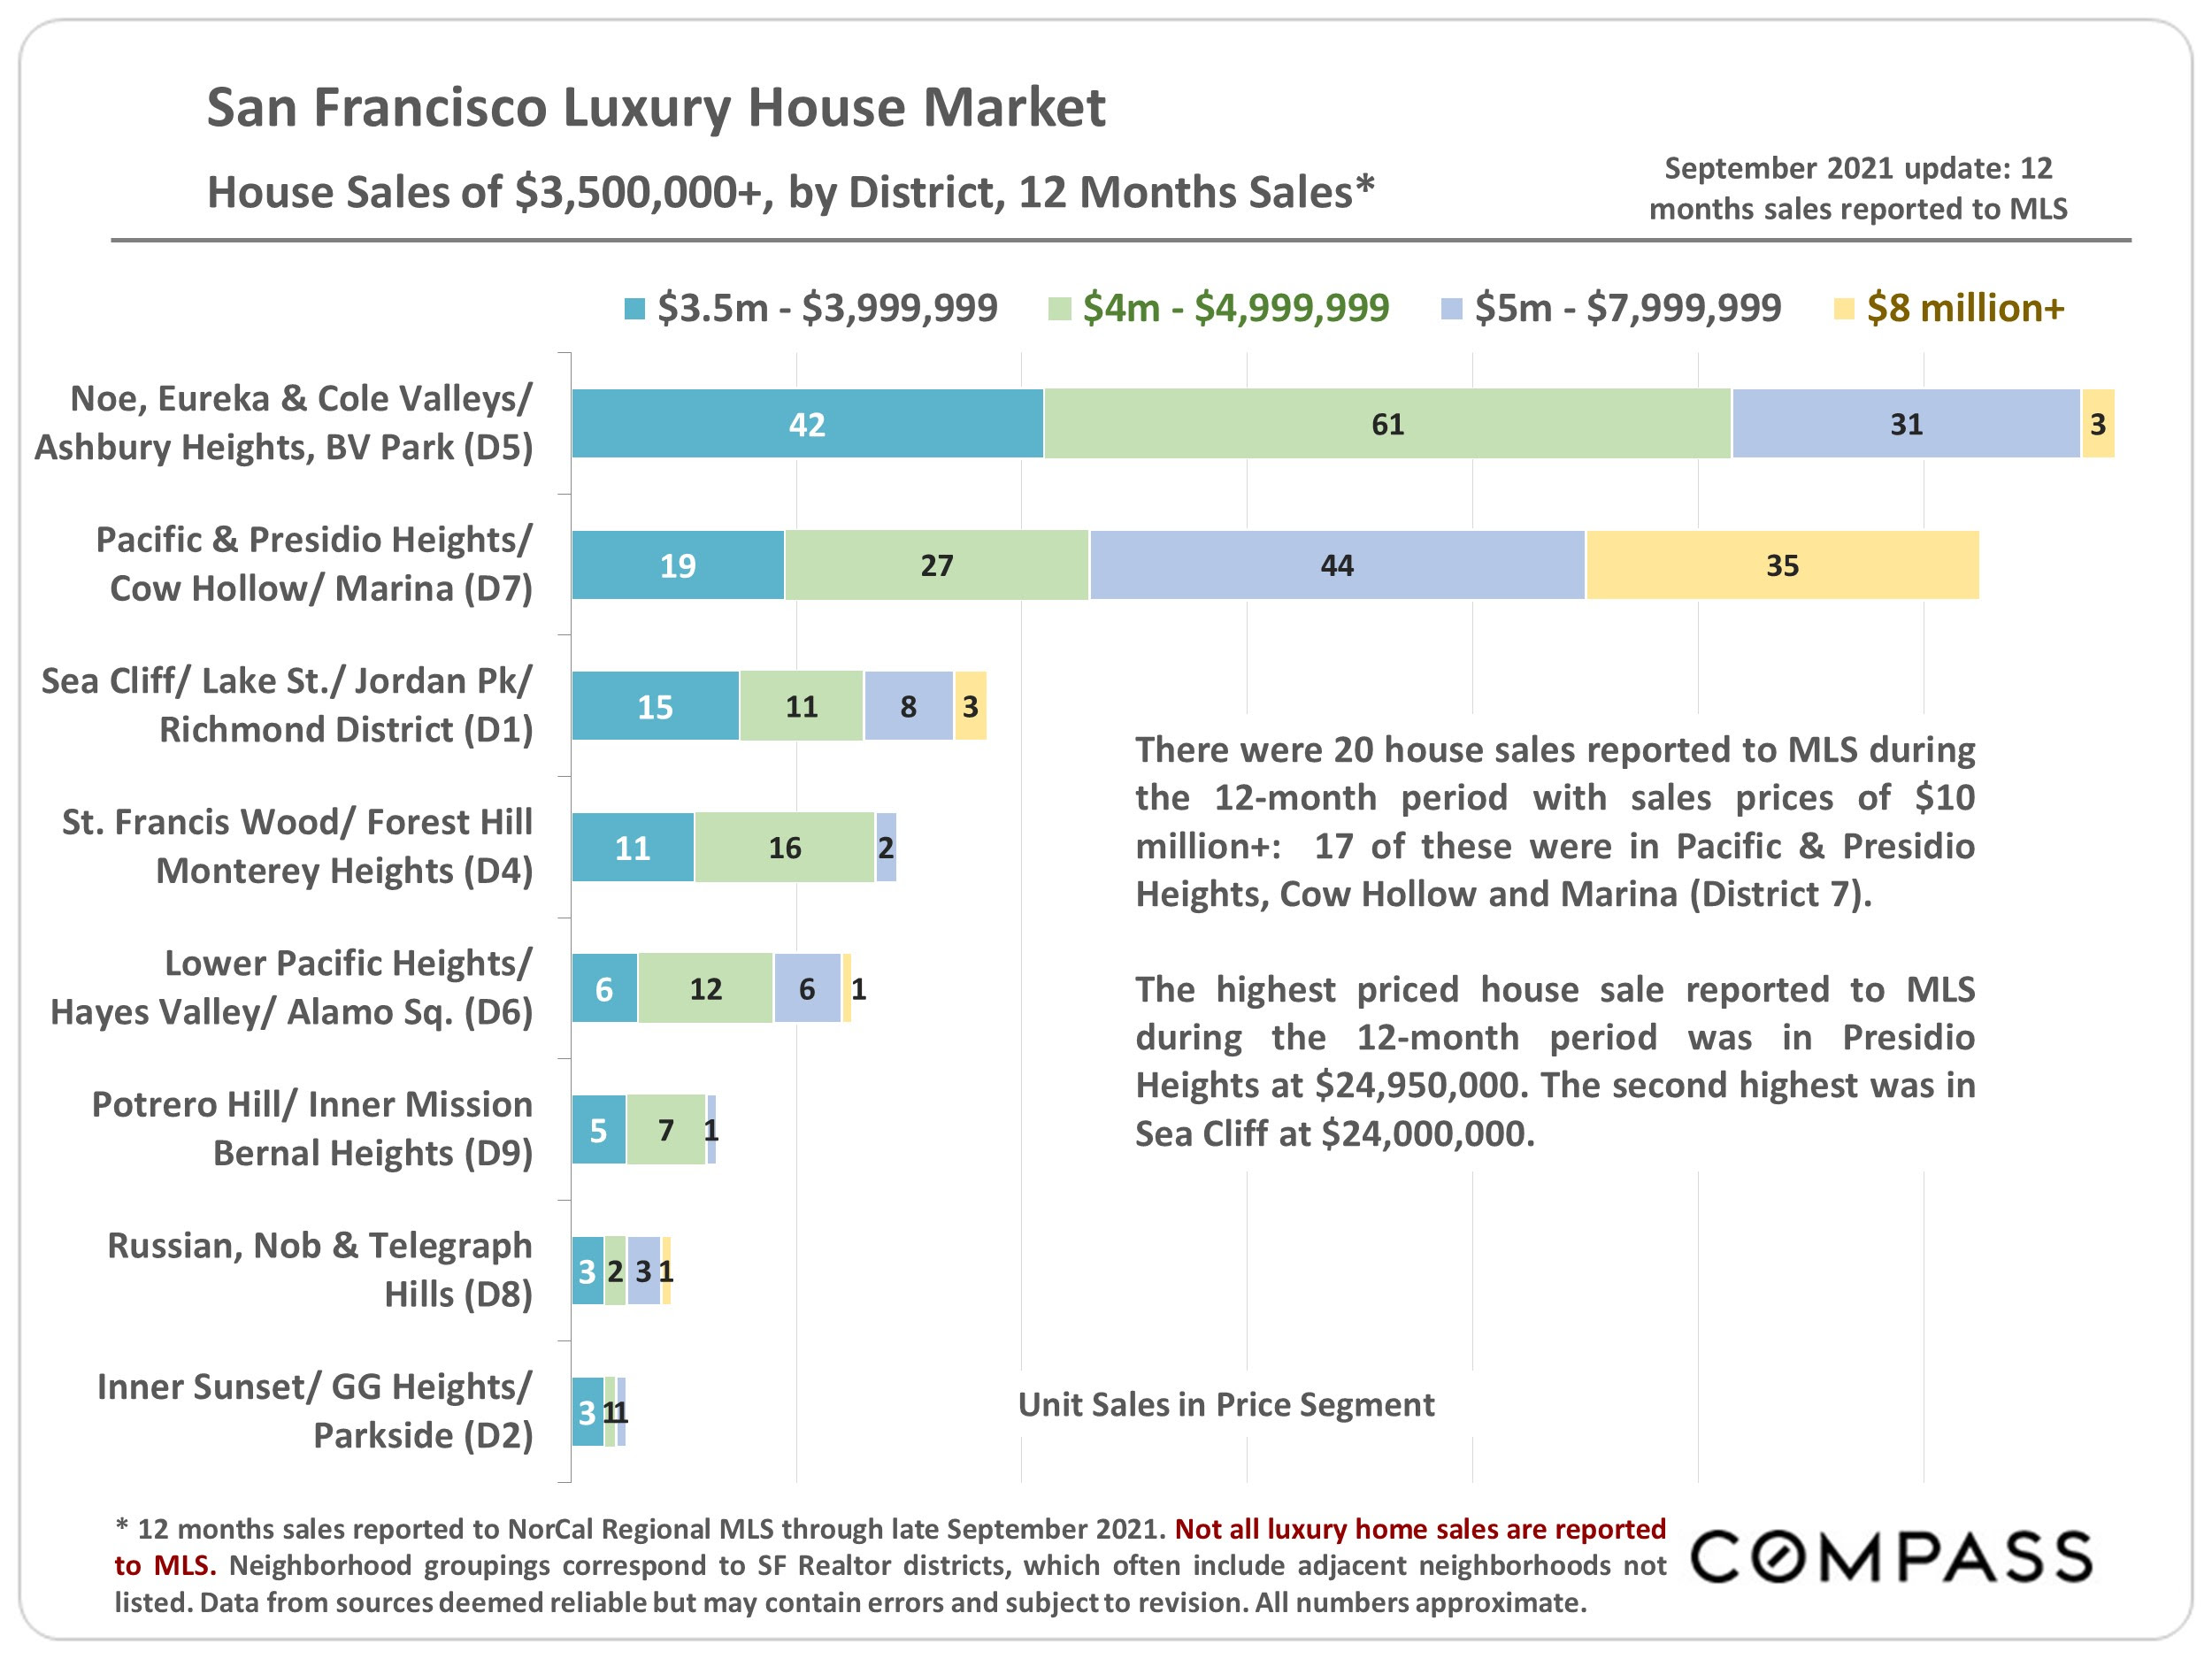
Chart comparing San Francisco luxury house sales by district and price segment, with notes on sales above $10 million.
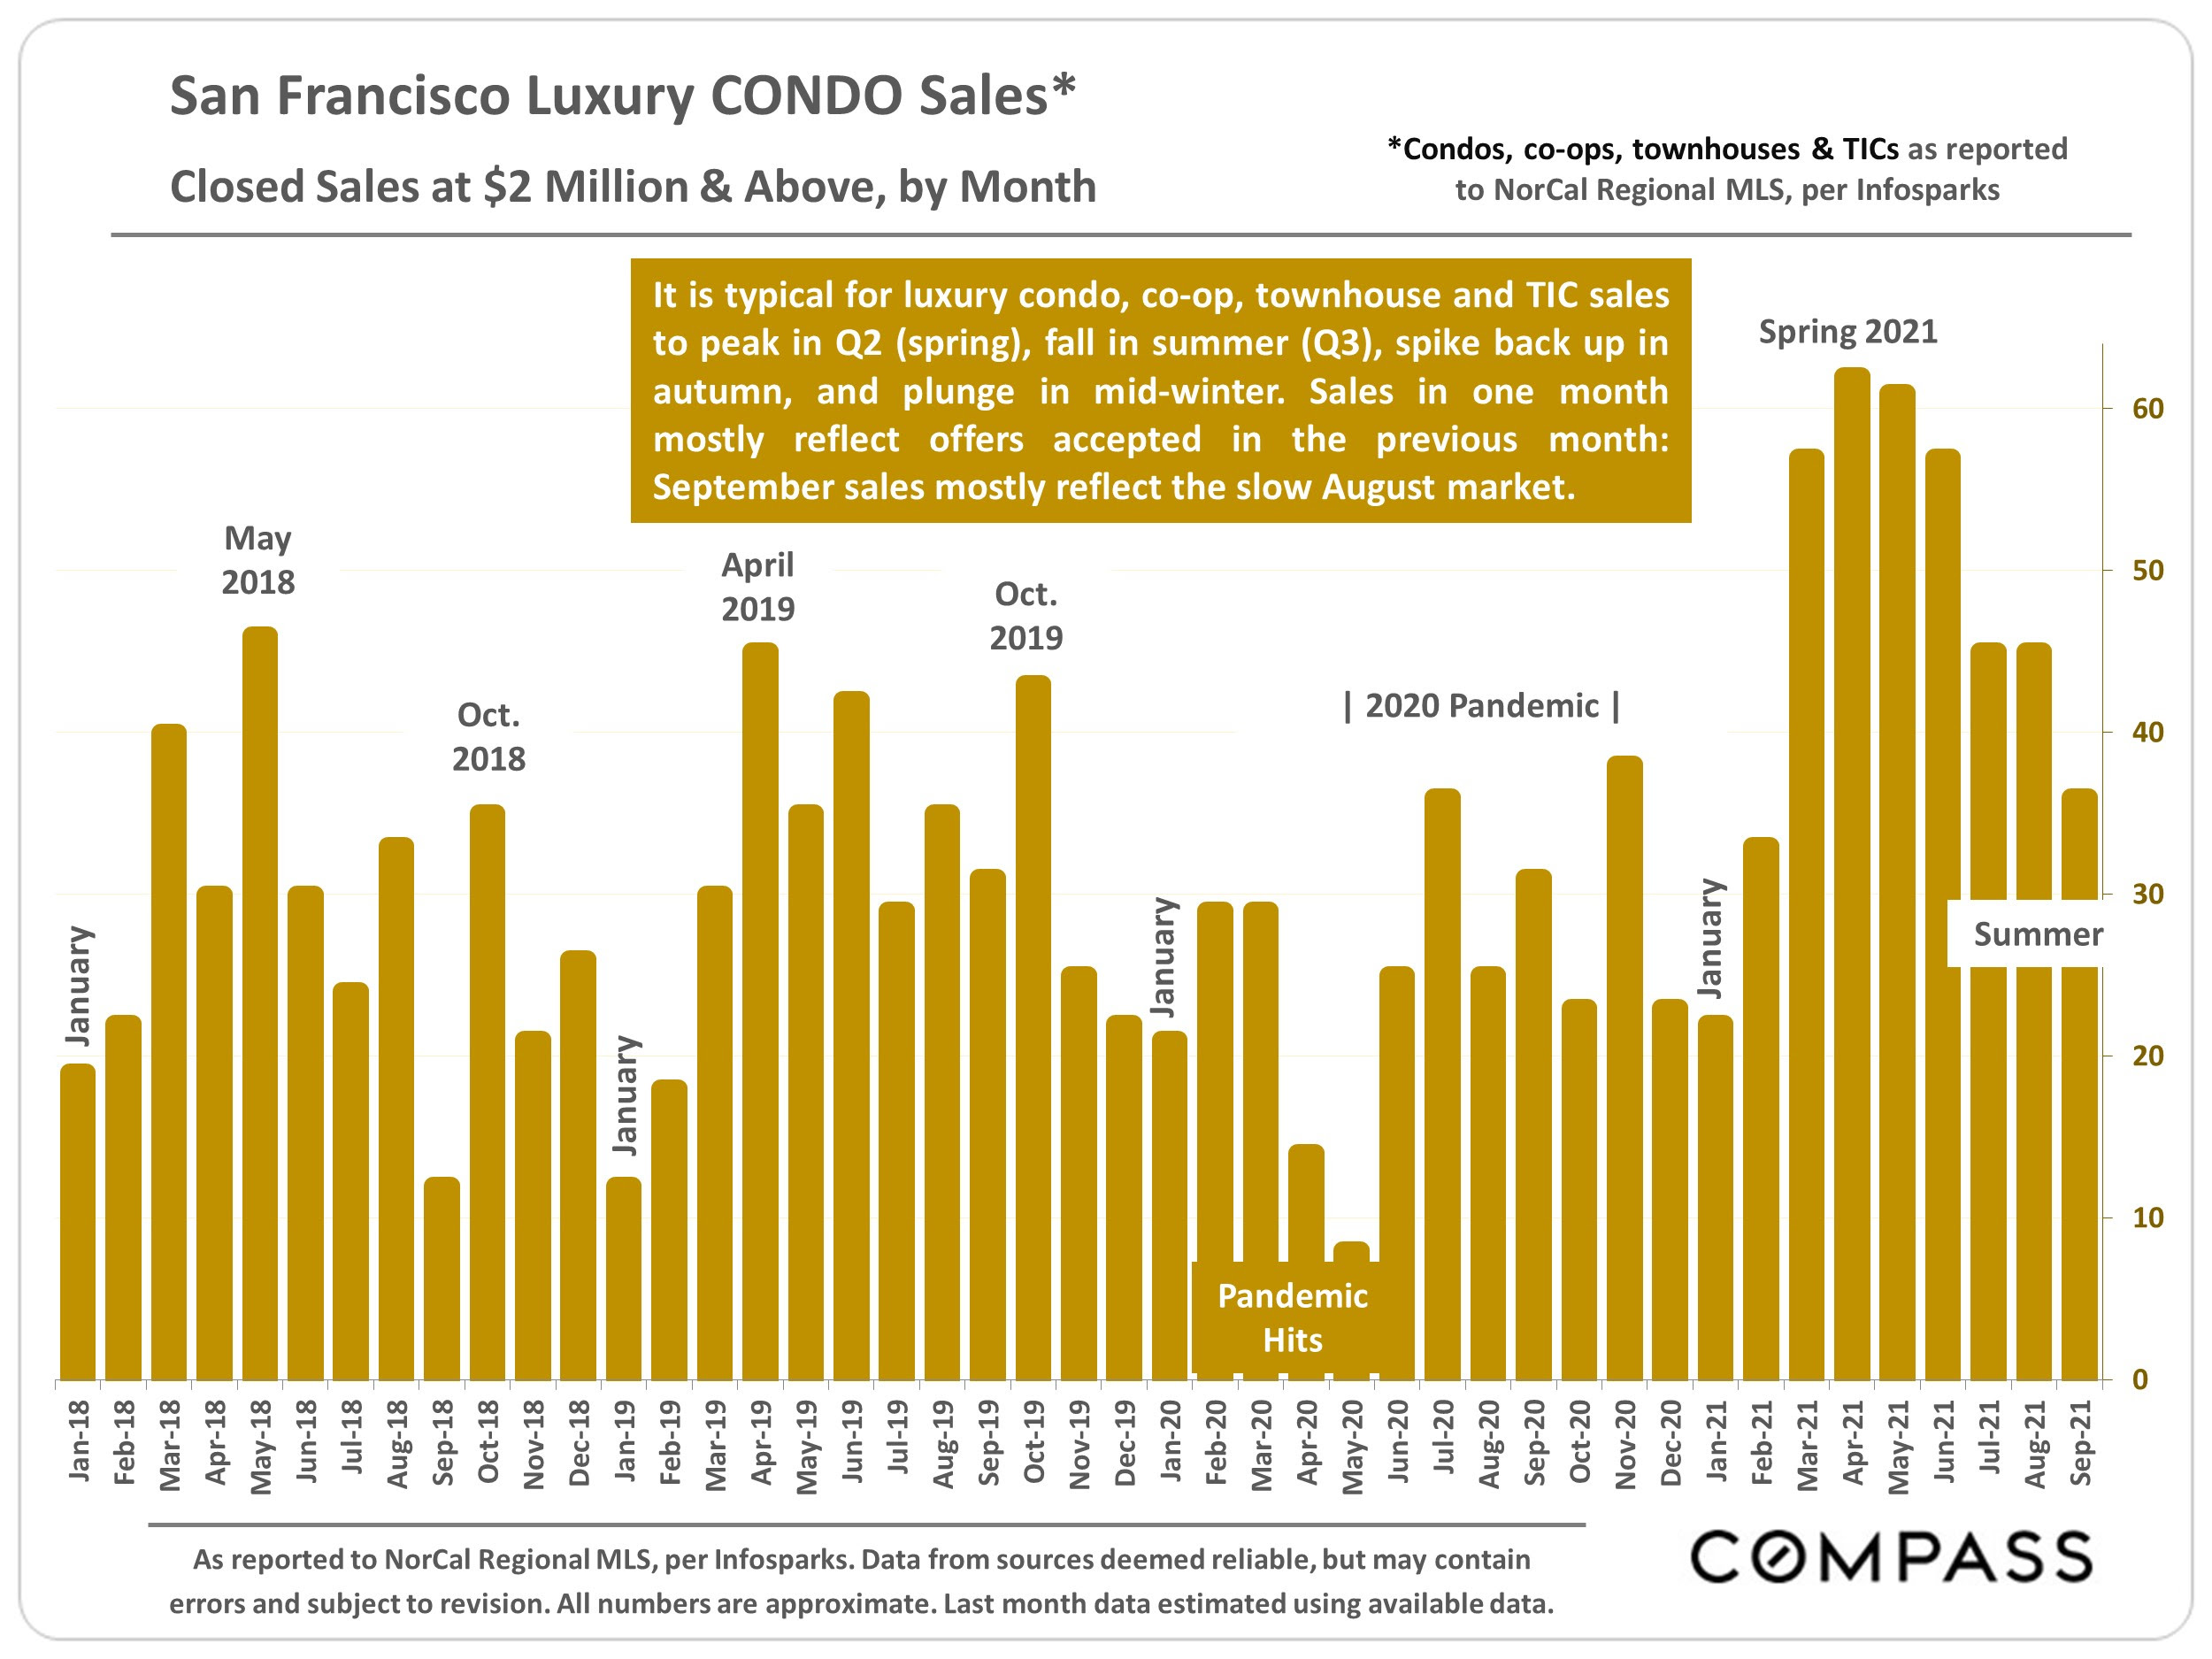
Chart of San Francisco luxury condo sales above $2 million by month, January 2018 to September 2021.
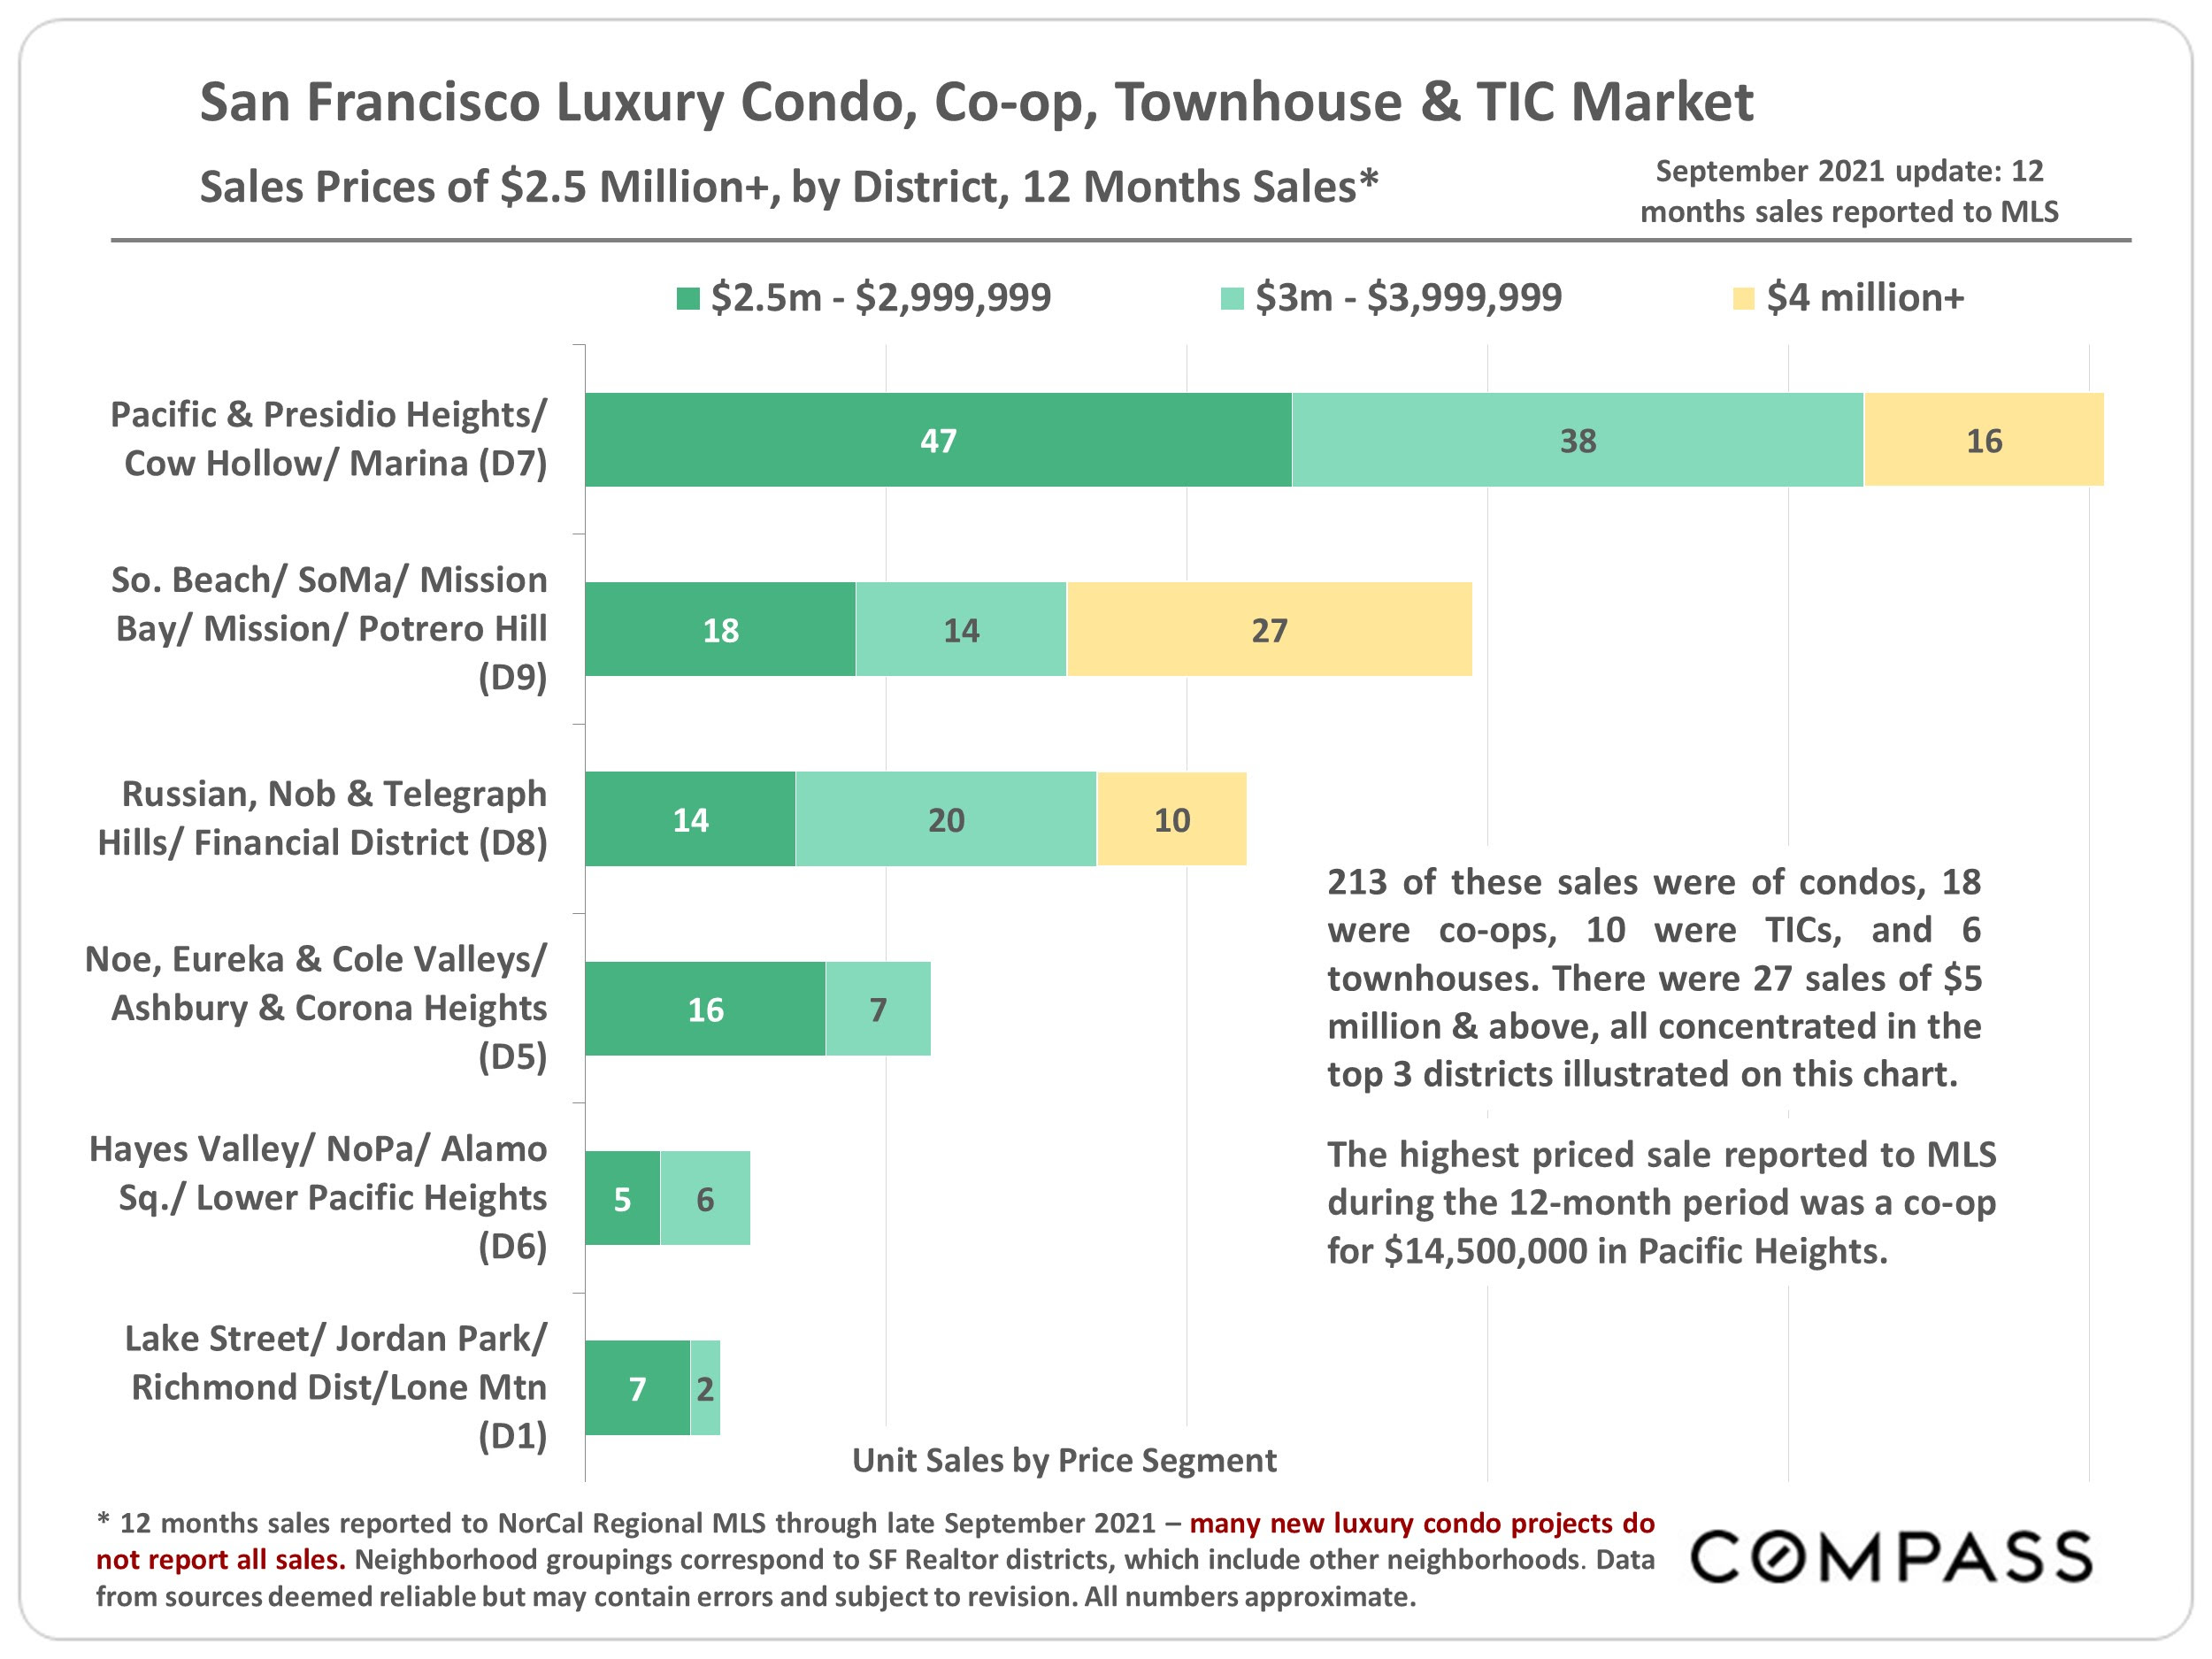
San Francisco luxury home sales by district and price range, with September 2021 figures.
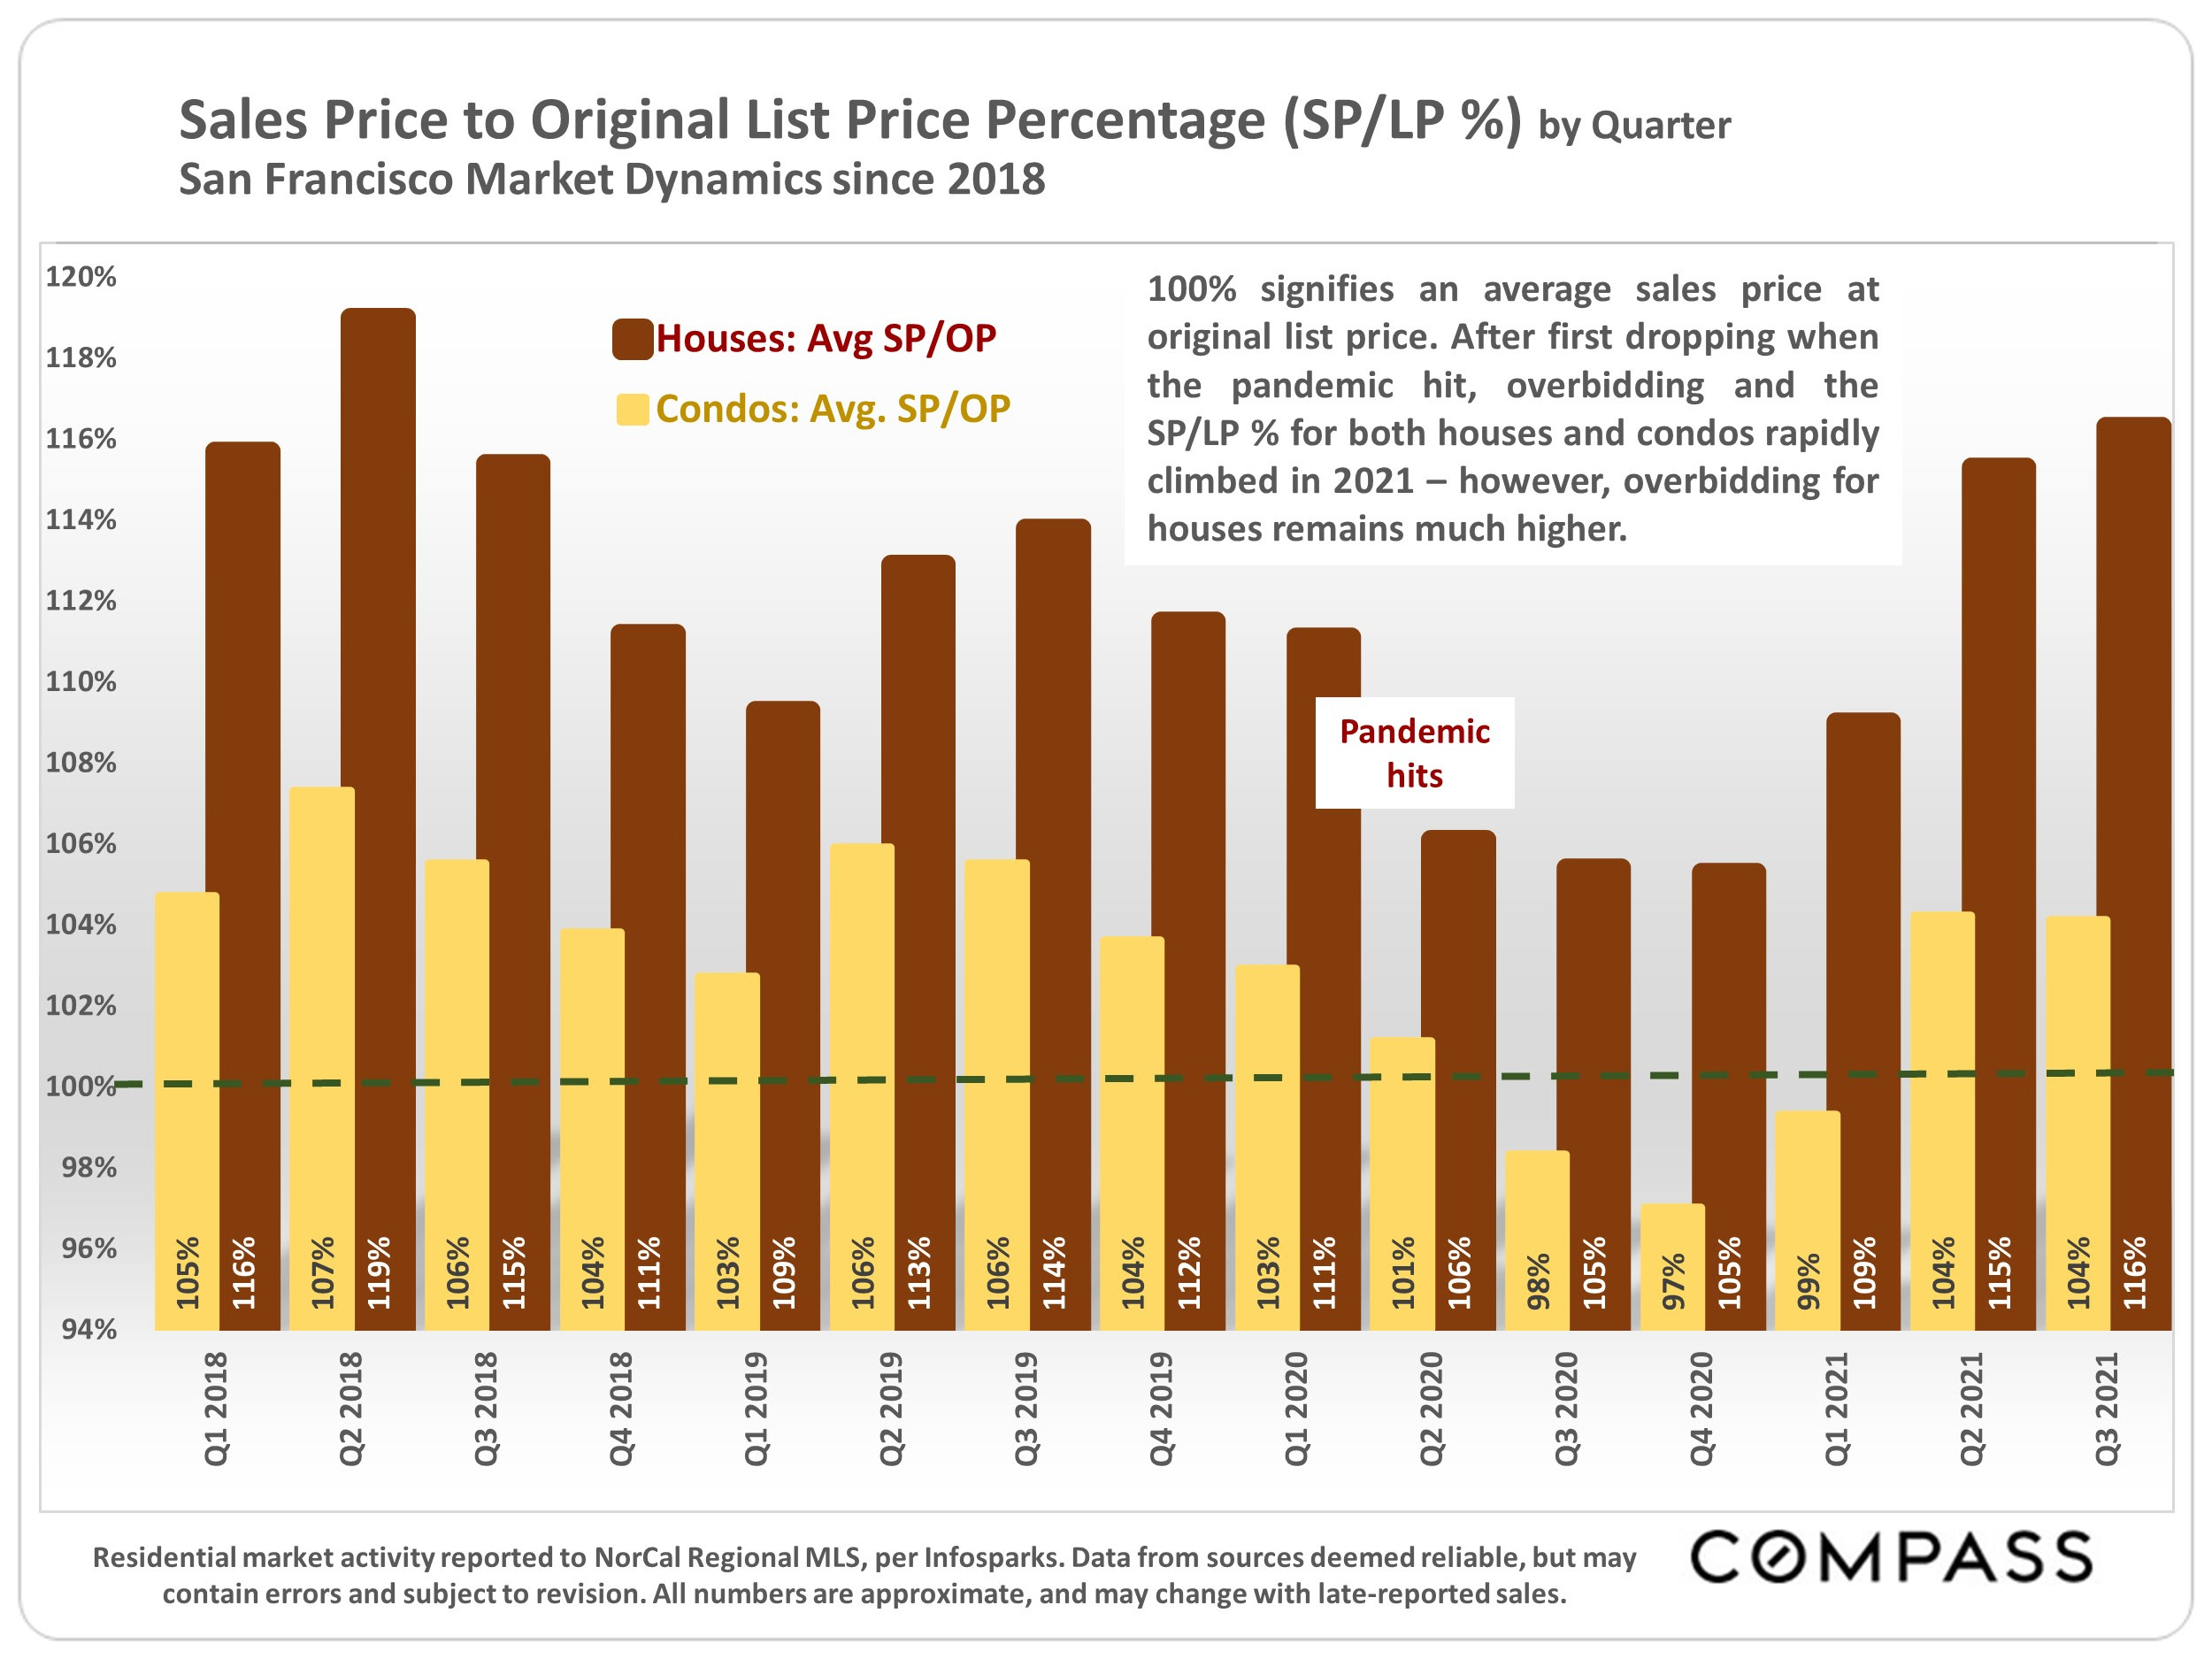
San Francisco quarterly sale-to-list price chart for houses and condos, 2018–2021, with houses rebounding more sharply in 2021.
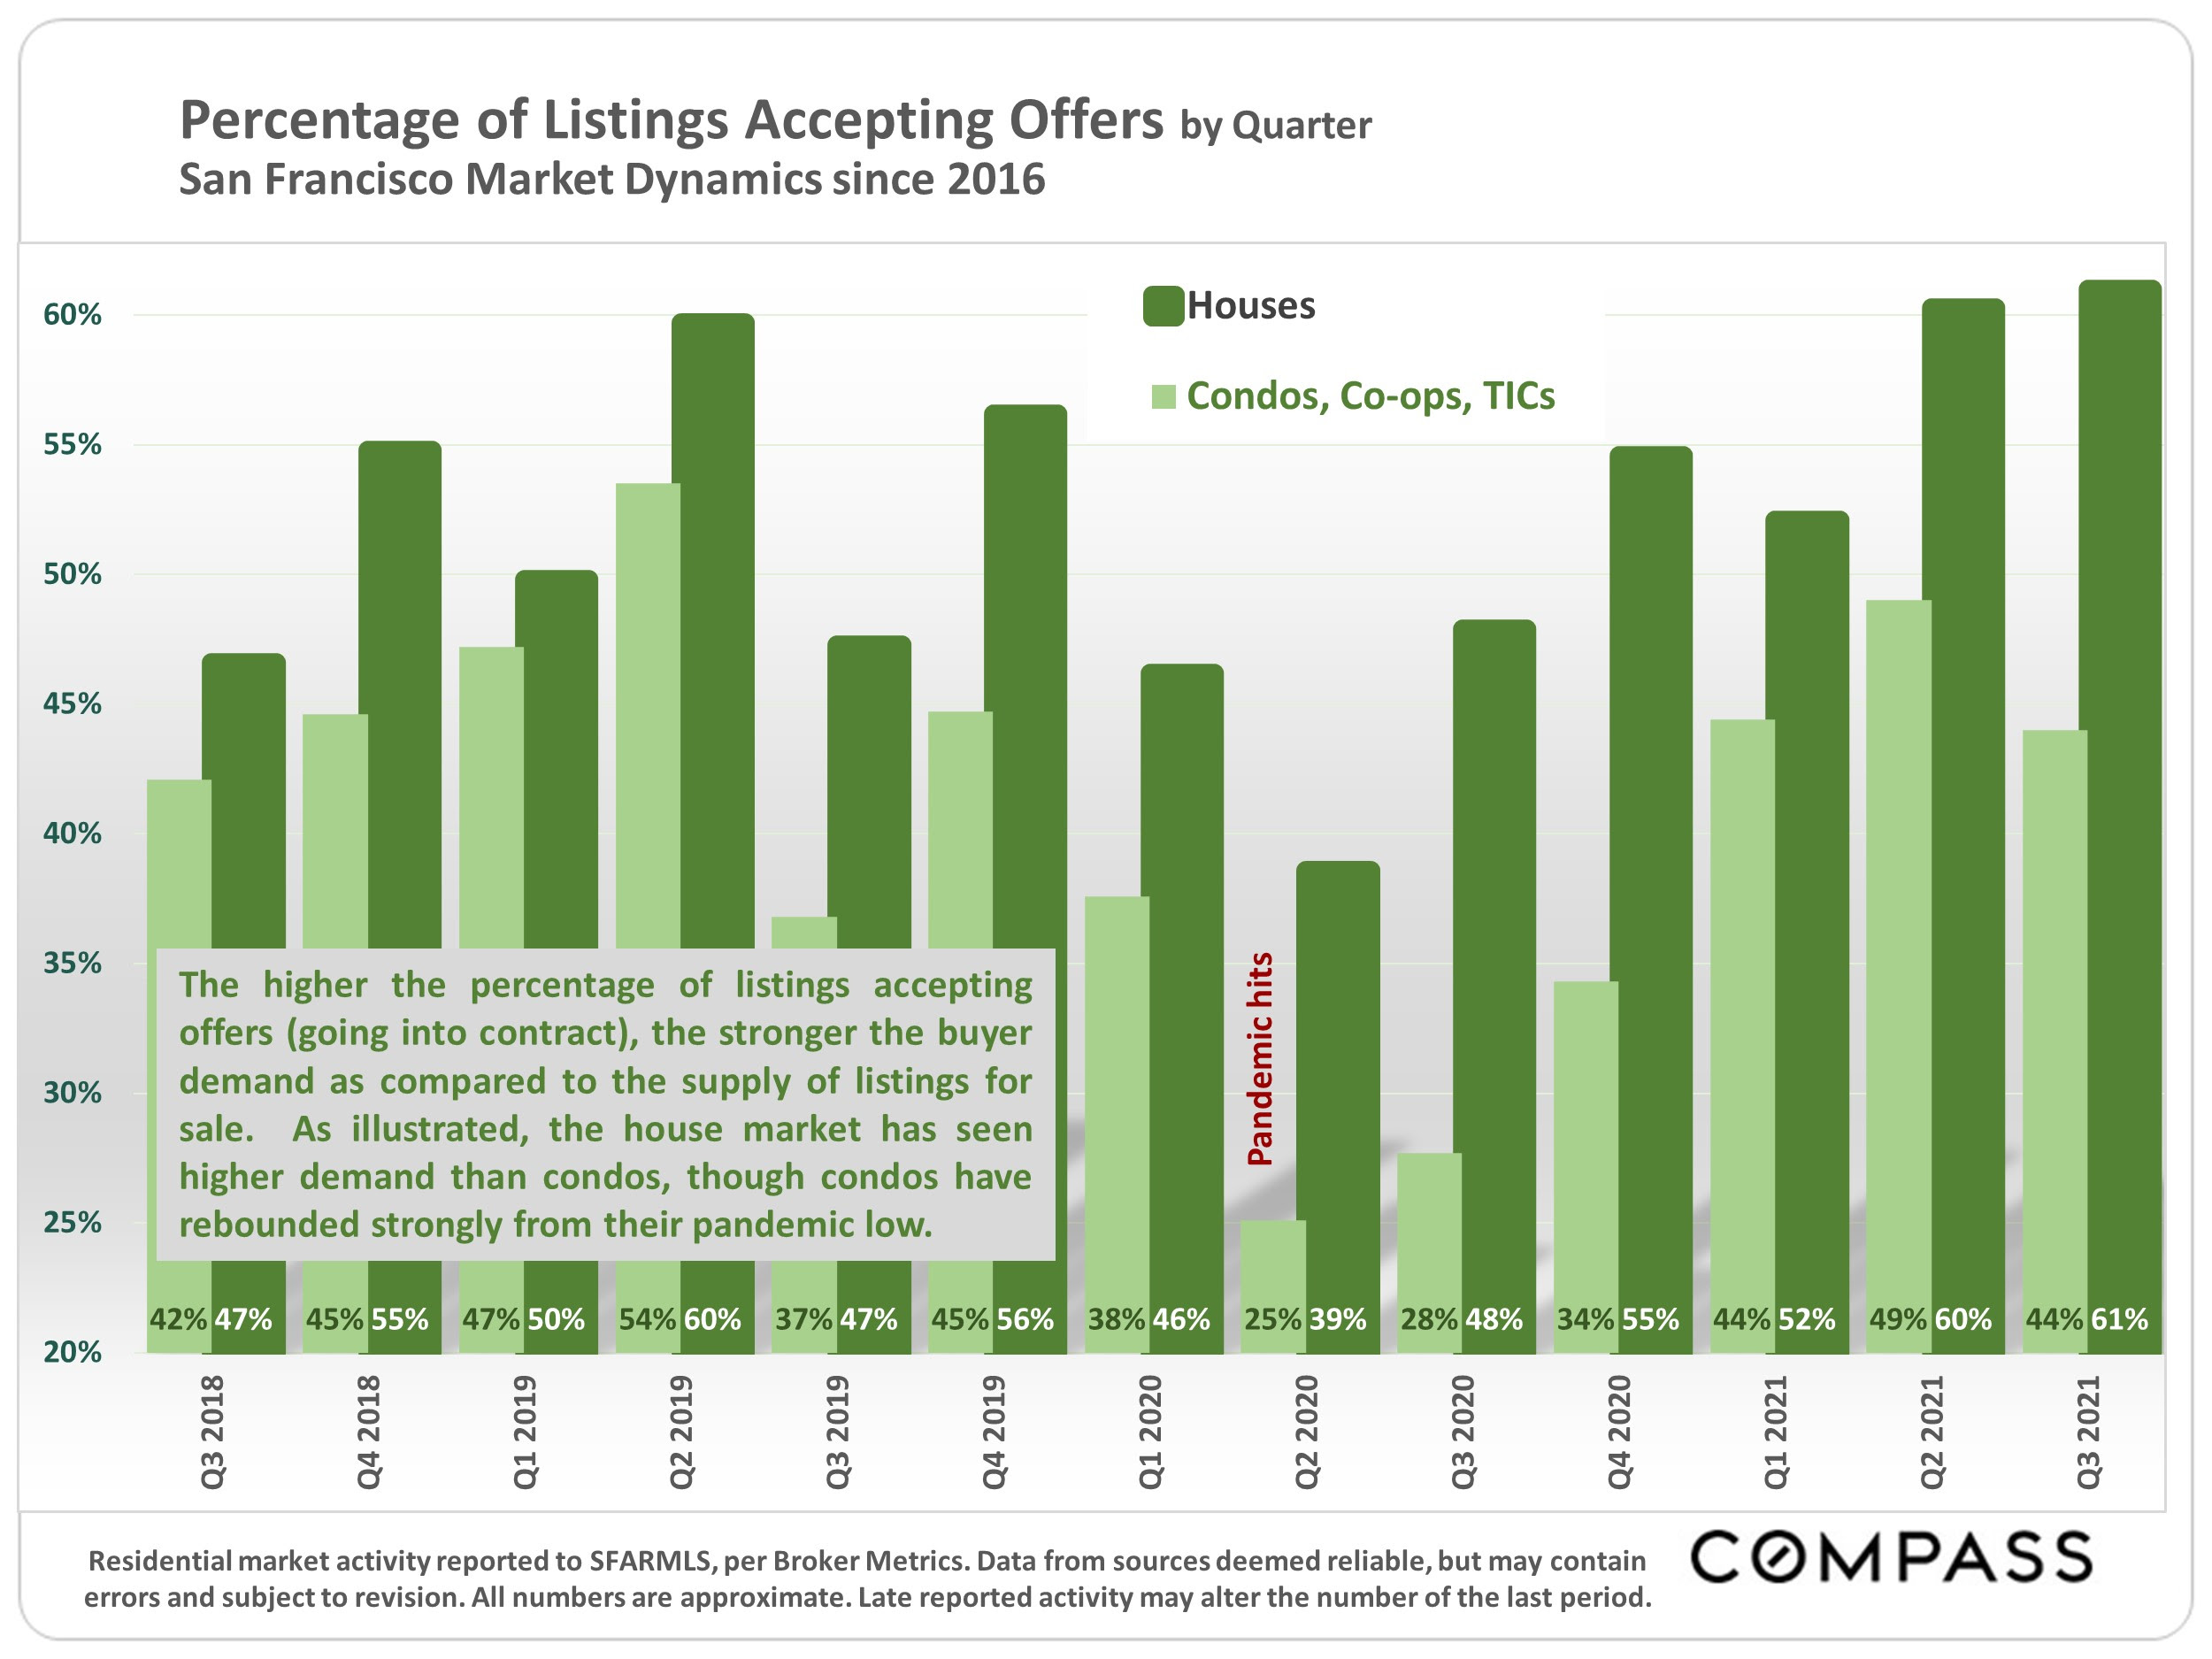
Chart compares quarterly San Francisco house and condo offer acceptance rates from Q3 2018 to Q3 2021; houses generally lead.
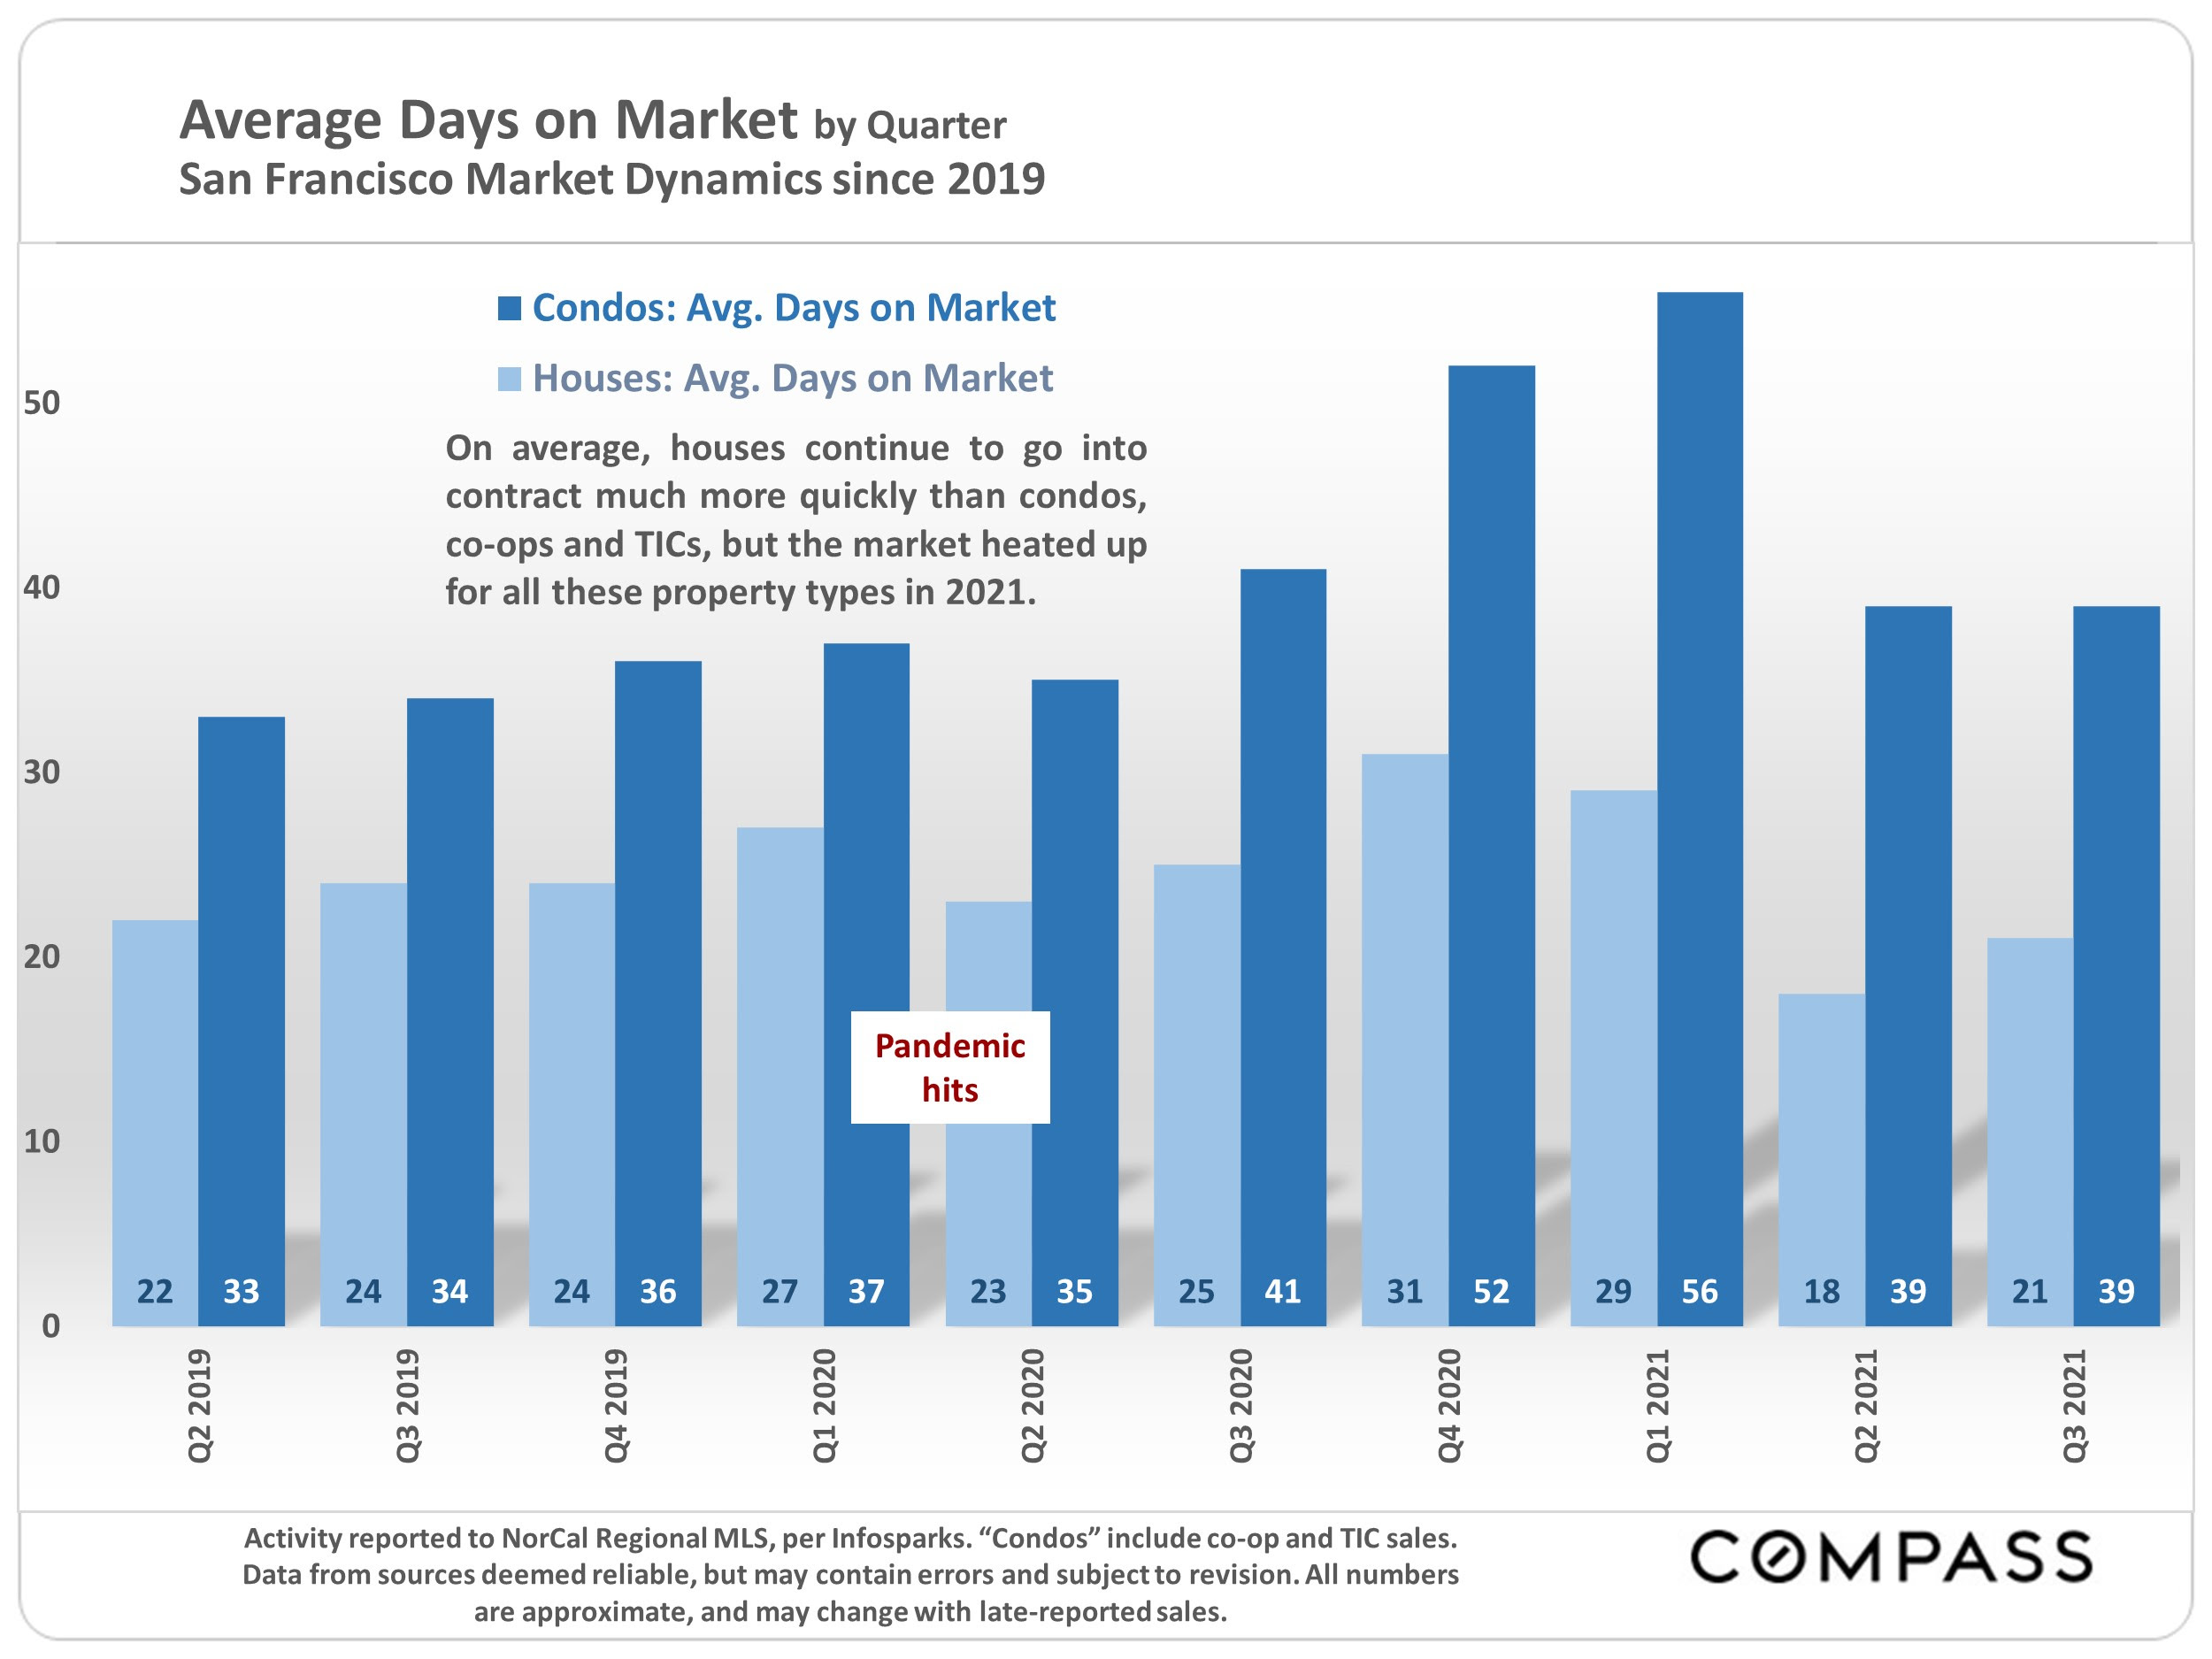
San Francisco chart comparing quarterly average market days for houses and condos, 2019–2021.

Follow Us On Instagram