Max Armour
San Francisco skyline at dusk, with the Transamerica Pyramid, Salesforce Tower, and Bay Bridge illuminated.

San Francisco Real Estate Market Report

October 2022. A review of house and condo prices, appreciation rates, supply and demand, overbidding, time and market, luxury home sales and macroeconomic factors pertinent to the San Francisco real estate market
 
San Francisco Real Estate October 2022 Report
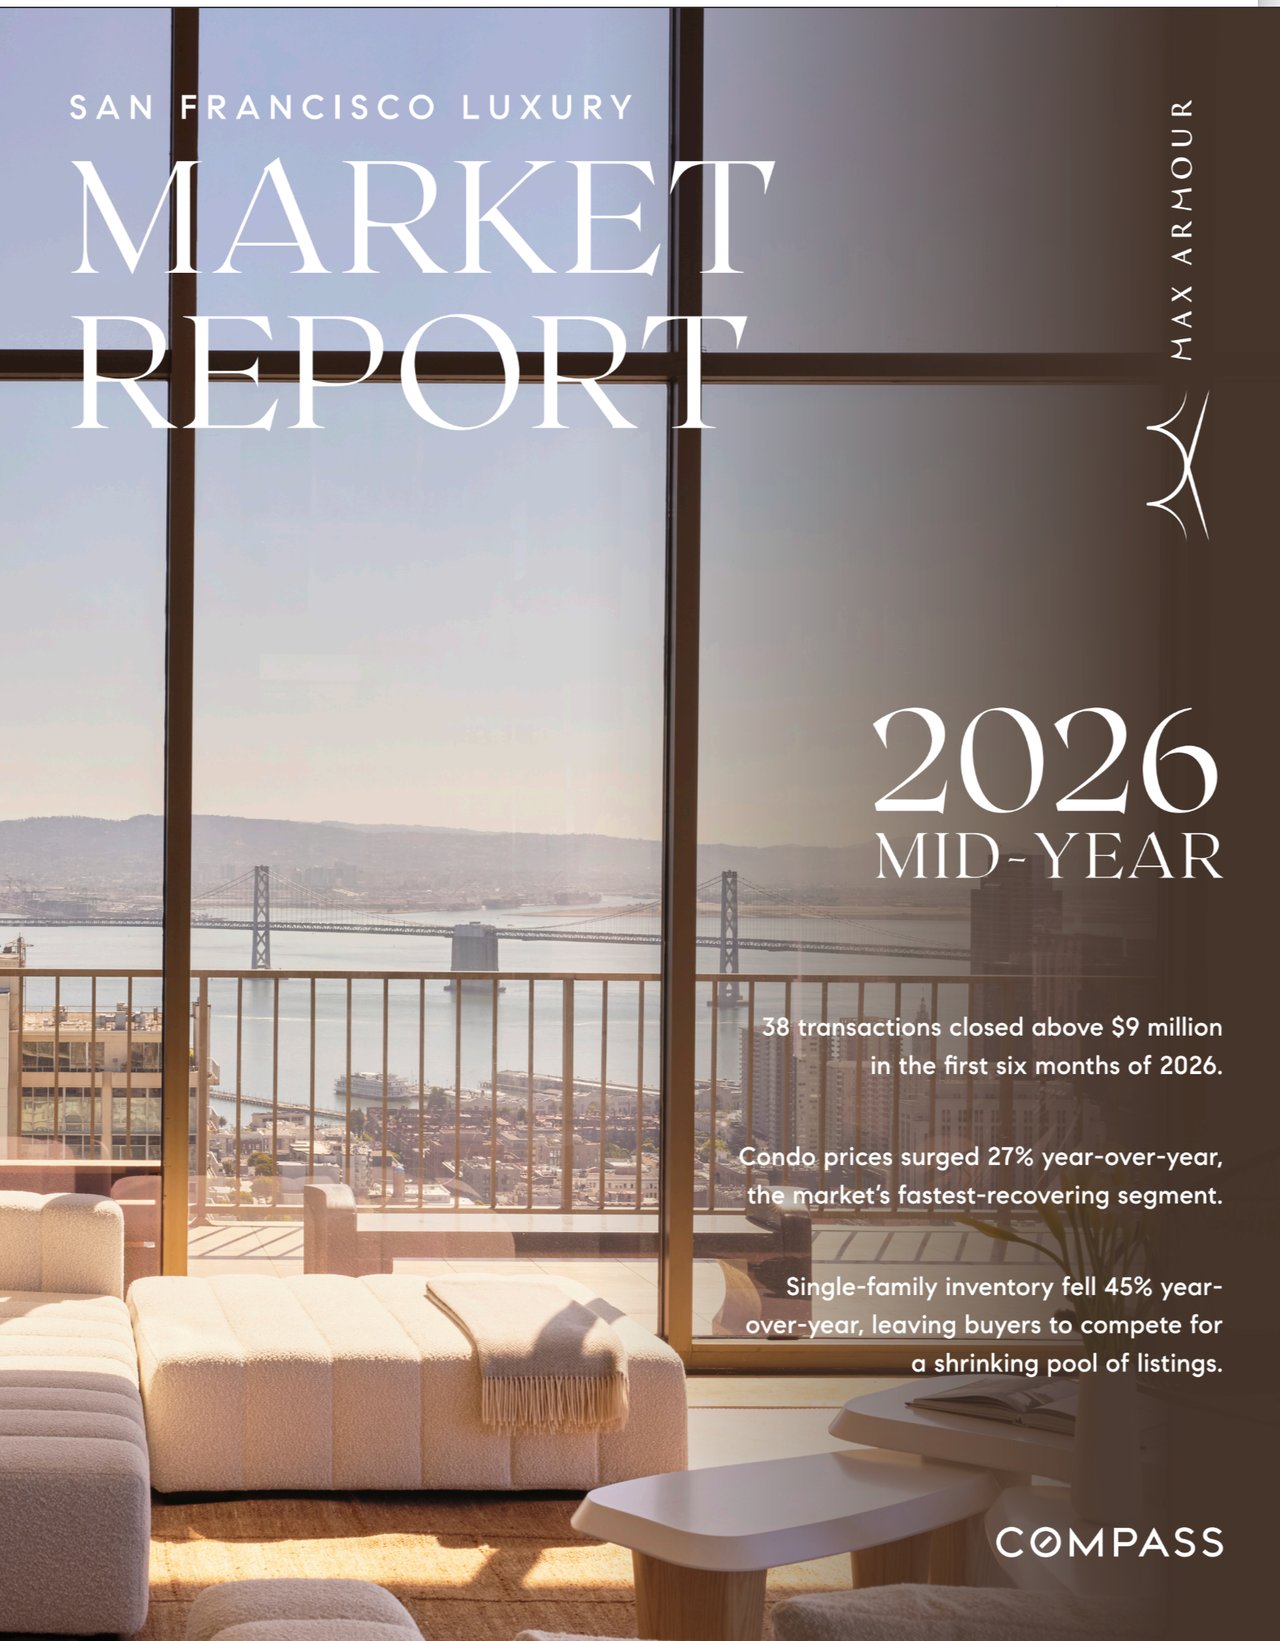
San Francisco real estate market report discussing Q3 sales prices and market conditions, with a Compass wordmark.
Chart of San Francisco quarterly median house prices, rising from 2012 to 2022, with Q3 columns highlighted.
San Francisco quarterly house price appreciation chart, peaking at 14% in Q4 2021 before falling to -9% in Q3 2022.
Bar chart of San Francisco condo prices by quarter, 2012–2022, with Q3 columns highlighted.
Chart of San Francisco condo price changes, showing a peak 11% year-over-year increase in Q4 2021 and a 5% decline in Q3 2022.
Chart of San Francisco median house prices by bedroom count, showing Q3 2022 year-over-year declines of 8% to 12%.
Chart of San Francisco condo median sale prices by bedroom count, Q1 2018 to Q3 2022.
San Francisco monthly new listings chart comparing 2021 and 2022, with September counts of 1,074 and 900.
Bar chart of San Francisco active and coming-soon listings, rising to 1,558 in October 2022.
San Francisco chart comparing 2021 and 2022 monthly listings going into contract, down 27% year over year in September.
Chart of San Francisco monthly home sales, 2019–2022, showing a June 2021 peak and seasonal trends.
Chart of San Francisco higher-priced home sales by quarter, 2018–2022; volume fell about 41% from Q3 2021 to Q3 2022.
Chart of San Francisco luxury home sales by district and price range, autumn 2022.
Infographic comparing San Francisco luxury home sales by district and price segment, with an Autumn 2022 update.
San Francisco chart comparing quarterly house and condo sales above list price from 2018 to 2022.
San Francisco quarterly home sale-to-list price percentages, 2018–2022; Q3 2022 shows houses at 108% and condos at 99%.
San Francisco quarterly average days on market chart comparing condos and houses from 2019 to 2022.
 
San Francisco skyline across the bay beyond a dry, tree-covered hillside.
7 Mariposa Court
For Sale in Tiburon
4 Bed | 5 Bath

$5,695,000

Modern living room with panoramic windows overlooking San Francisco and the bay, furnished with white seating and a shag rug.
32 Julius Street
For Rent in Telegraph Hill
5 Bed | 4.5 Bath

$25,000/mo

Living room with floor-to-ceiling windows overlooking San Francisco Bay and a small island.
999 Green Street, PH NORTH
SOLD Russian Hill
3 Bed | 4.5 Bath

$17,000,000

High-rise living room with floor-to-ceiling windows overlooking the San Francisco skyline at sunset.
999 Green Street, PH SOUTH
SOLD Russian Hill
3 Bed | 4 Bath

$12,000,000

 
See more at MaxArmour.com
 
Real estate market report notes and legal disclaimer, with Compass branding.

Follow Us On Instagram