Max Armour
San Francisco skyline at dusk, with Salesforce Tower rising above illuminated downtown buildings.

San Francisco Real Estate June Report

Clear indications of cooling conditions are now showing up in the inventory, sales, pending-sale and price reduction data for San Francisco.
 
San Francisco real estate June 2022 market report
San Francisco market report describing cooling sales, rising listings and price reductions, with seasonal trends and Compass branding.
Chart of San Francisco median house sale prices from 1993 through 2022 YTD, showing long-term price growth.
Chart of San Francisco house-price appreciation, showing mostly 11%–15% year-over-year growth since May 2021.
Chart of San Francisco median condo prices, rising from $243,000 in 1993 to $1,252,000 in 2022 YTD.
Chart of San Francisco condo appreciation rates, with declines in 2020 and a peak of 15% in January 2022.
Chart compares monthly San Francisco new listings in 2021 and 2022; May totals were 816 and 844, respectively.
San Francisco active listings chart compares 2021 and 2022, showing a sharp increase to 1,166 listings in May 2022.
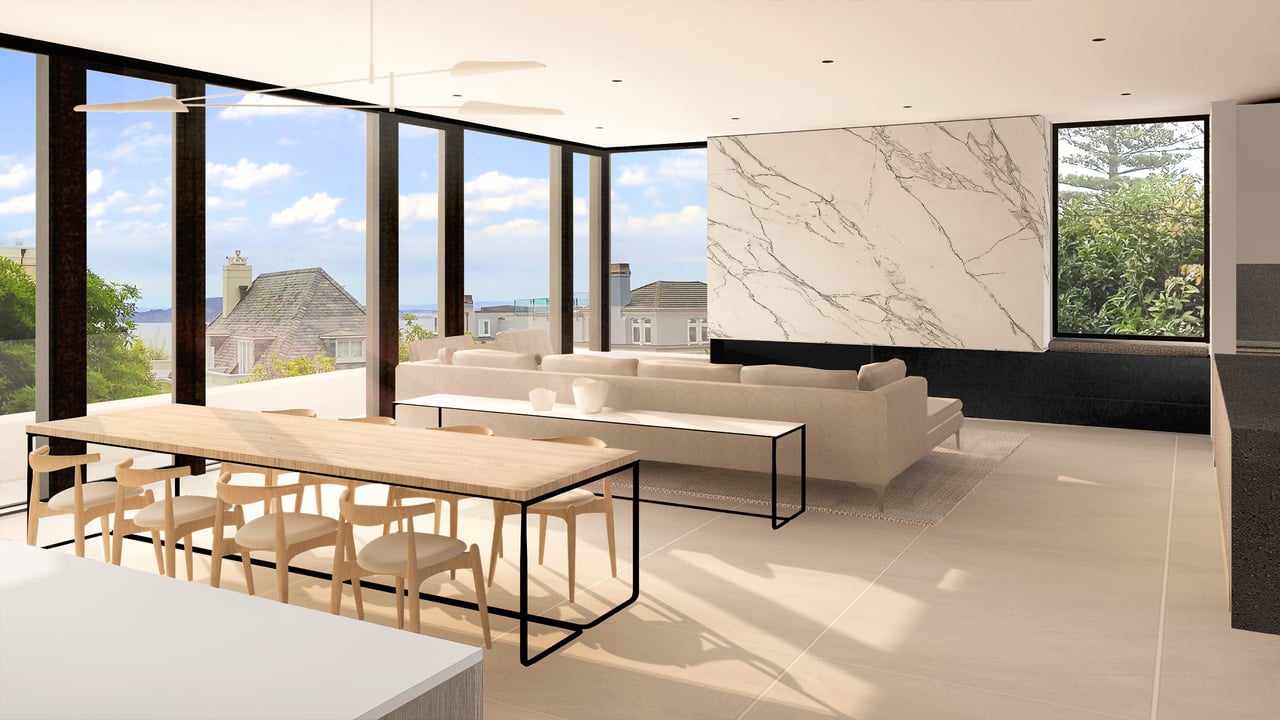
Modern living room with floor-to-ceiling windows overlooking the city and bay.
32 Julius Street
Telegraph Hill  $9,995,000
5 Bed | 4.5 Bath
High-rise living room with floor-to-ceiling windows overlooking the San Francisco skyline at sunset.
SOUTH PENTHOUSE
999 Green Street, Unit 3202
Russian Hill  $12,000,000
3 Bed | 4 Bath
 
Living room with floor-to-ceiling windows overlooking San Francisco Bay and a small island.
NORTH PENTHOUSE
999 Green Street, Unit 3201
Russian Hill   $17,000,000
3 Bed | 4.5 Bath
 
Modern home at dusk with expansive glass windows and a brightly lit garage.
325 Buena Vista Avenue
Mill Valley $6,150,000
4 Bed | 5 Bath
Bar chart of San Francisco active home listings from January 2018 through May 2022.
Chart compares San Francisco listings going into contract in 2021 and 2022, showing a May year-over-year decline of about 22%.
Chart of San Francisco listings accepting offers, January 2019–May 2022, with a sharp pandemic dip and 2022 decline.
Chart comparing monthly San Francisco home sales in 2021 and 2022, January through May.
Line chart of San Francisco monthly home sales, showing seasonal peaks and a sharp pandemic-era drop.
San Francisco May 2022 market chart: closed sales fell 15%, 14%, and rose 14% by price segment; offers fell 29%, 20%, and 12%.
Bar chart of San Francisco $3 million-plus home sales by month, January 2020 to May 2022, split by price tier.
Chart comparing San Francisco listing price reductions in 2021 and 2022, with a sharp rise to 272 in May.
San Francisco rooftops, the bay, Golden Gate Bridge, and Coit Tower beneath a real estate report link.
Chart showing San Francisco home sales closing over list price from 2018 to May 2022.


Let's get social!

 
Man in a gray suit and brown tie standing outdoors against a blue sky.
 

Follow Us On Instagram