
Max Armour
San Francisco rooftops and bay with hills and the Golden Gate Bridge in the distance.

San Francisco Real Estate January 2023 Report

Excellent trends: The December inflation reading declined, and interest rates have started to follow:

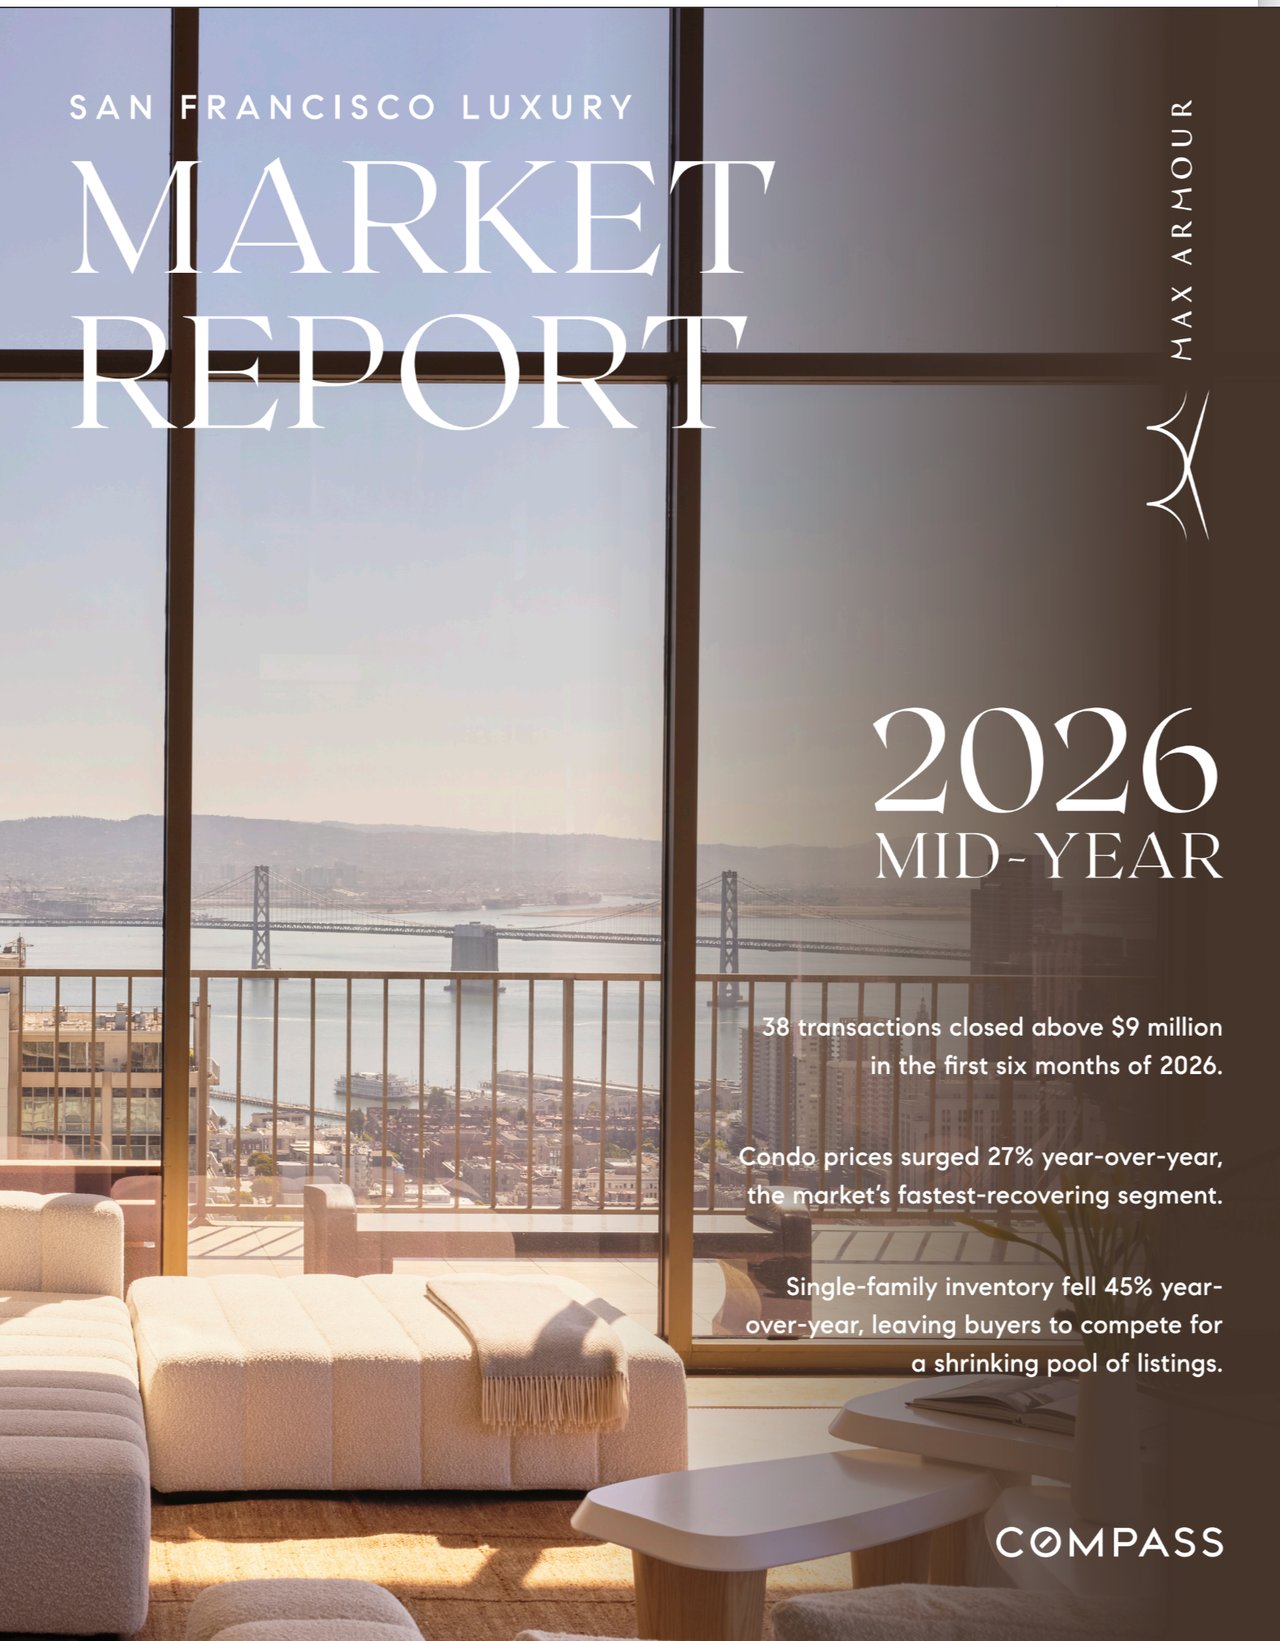
San Francisco skyline at golden hour, with the January 2023 real estate report title.

Excellent trends: The December inflation reading declined, and interest rates have started to follow:

Bar chart of U.S. inflation peaking at 9.0% in June 2022 and falling to 6.4% by December.

Mortgage rate chart shows a long-term decline since 1981, followed by a sharp increase in 2022.


2022 Review of Selected Indicators

2022 real estate market and economic indicators, including falling sales prices and volume, with Compass branding.

San Francisco housing market update discussing 2022 trends and the 2023 outlook.

Chart of San Francisco median house prices, 1993–2022, with green bars and annotations for market cycles.

San Francisco quarterly median house prices, 2012–2022, with prices peaking in 2021 before declining.

Quarterly San Francisco condo sale prices, 2012–2022, charted with orange bars and a marked 2022 decline.

Chart of San Francisco median condo sales prices, 1993–2022, with annotations marking market cycles.

San Francisco condo and house median prices per square foot, 2012–2022, with Q4 2022 annual declines noted.

San Francisco home sales volume chart, 2004–2022, with a green trend line and marked market events.

San Francisco quarterly high-price home sales chart comparing houses and condos from 2018 through 2022.

Chart of San Francisco median home sale prices by Realtor District, 2012–2022, showing declines in the second half of 2022.

San Francisco 2022 residential sales pie chart, comparing condo, house, and other property-type sales.

San Francisco neighborhood map linking to home prices based on second-half 2022 sales.

San Francisco quarterly offer-acceptance rates for houses and condos, co-ops, and TICs, Q2 2019–Q4 2022.

San Francisco quarterly home and condo sale-to-list price percentages, 2018–2022, with a sharp decline after Q2 2022.

Chart comparing quarterly average days on market for San Francisco condos and houses from 2019 to 2022.

S&P 500 January opening values from 1994 to 2022, charted with green bars and marked market peaks and crashes.

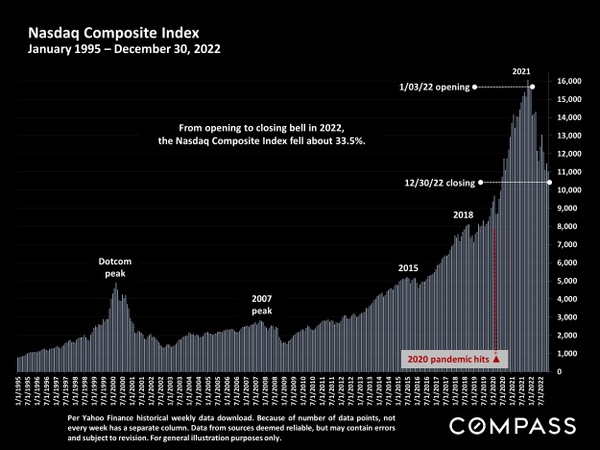
Nasdaq Composite Index chart from 1995 to 2022, highlighting the 33.5% decline in 2022.

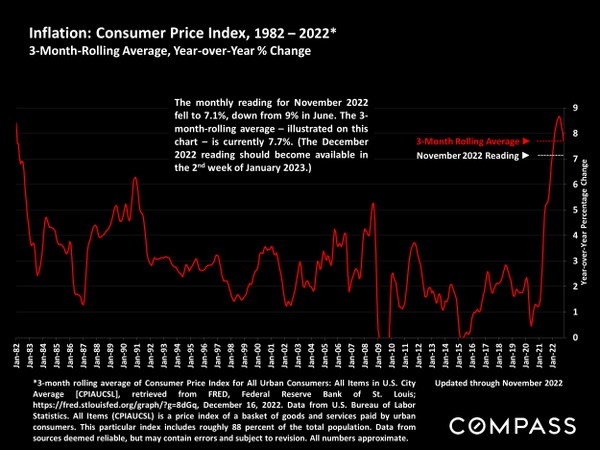
Chart of U.S. consumer price inflation from 1982 to 2022, with a red line and November 2022 reading.

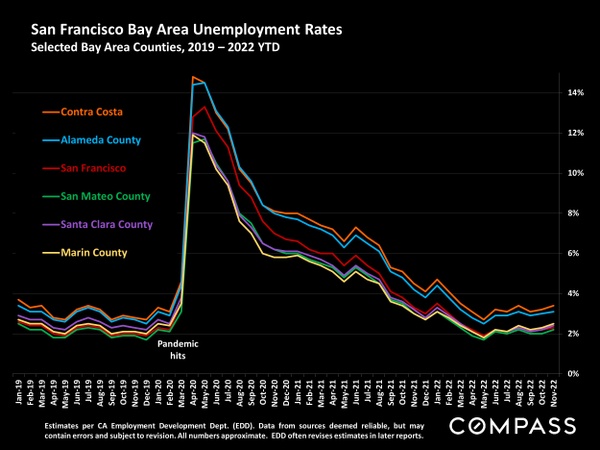
Chart comparing unemployment rates across six Bay Area counties from 2019 to 2022.

Max Armour

Want to know more about the value of your home?
Details on your street &
recent sales activity?


Max Armour 

DRE# 01446122
M: 415.290.6058

Follow Us On Instagram