Complete the following form to download our End Of the Year Market Report
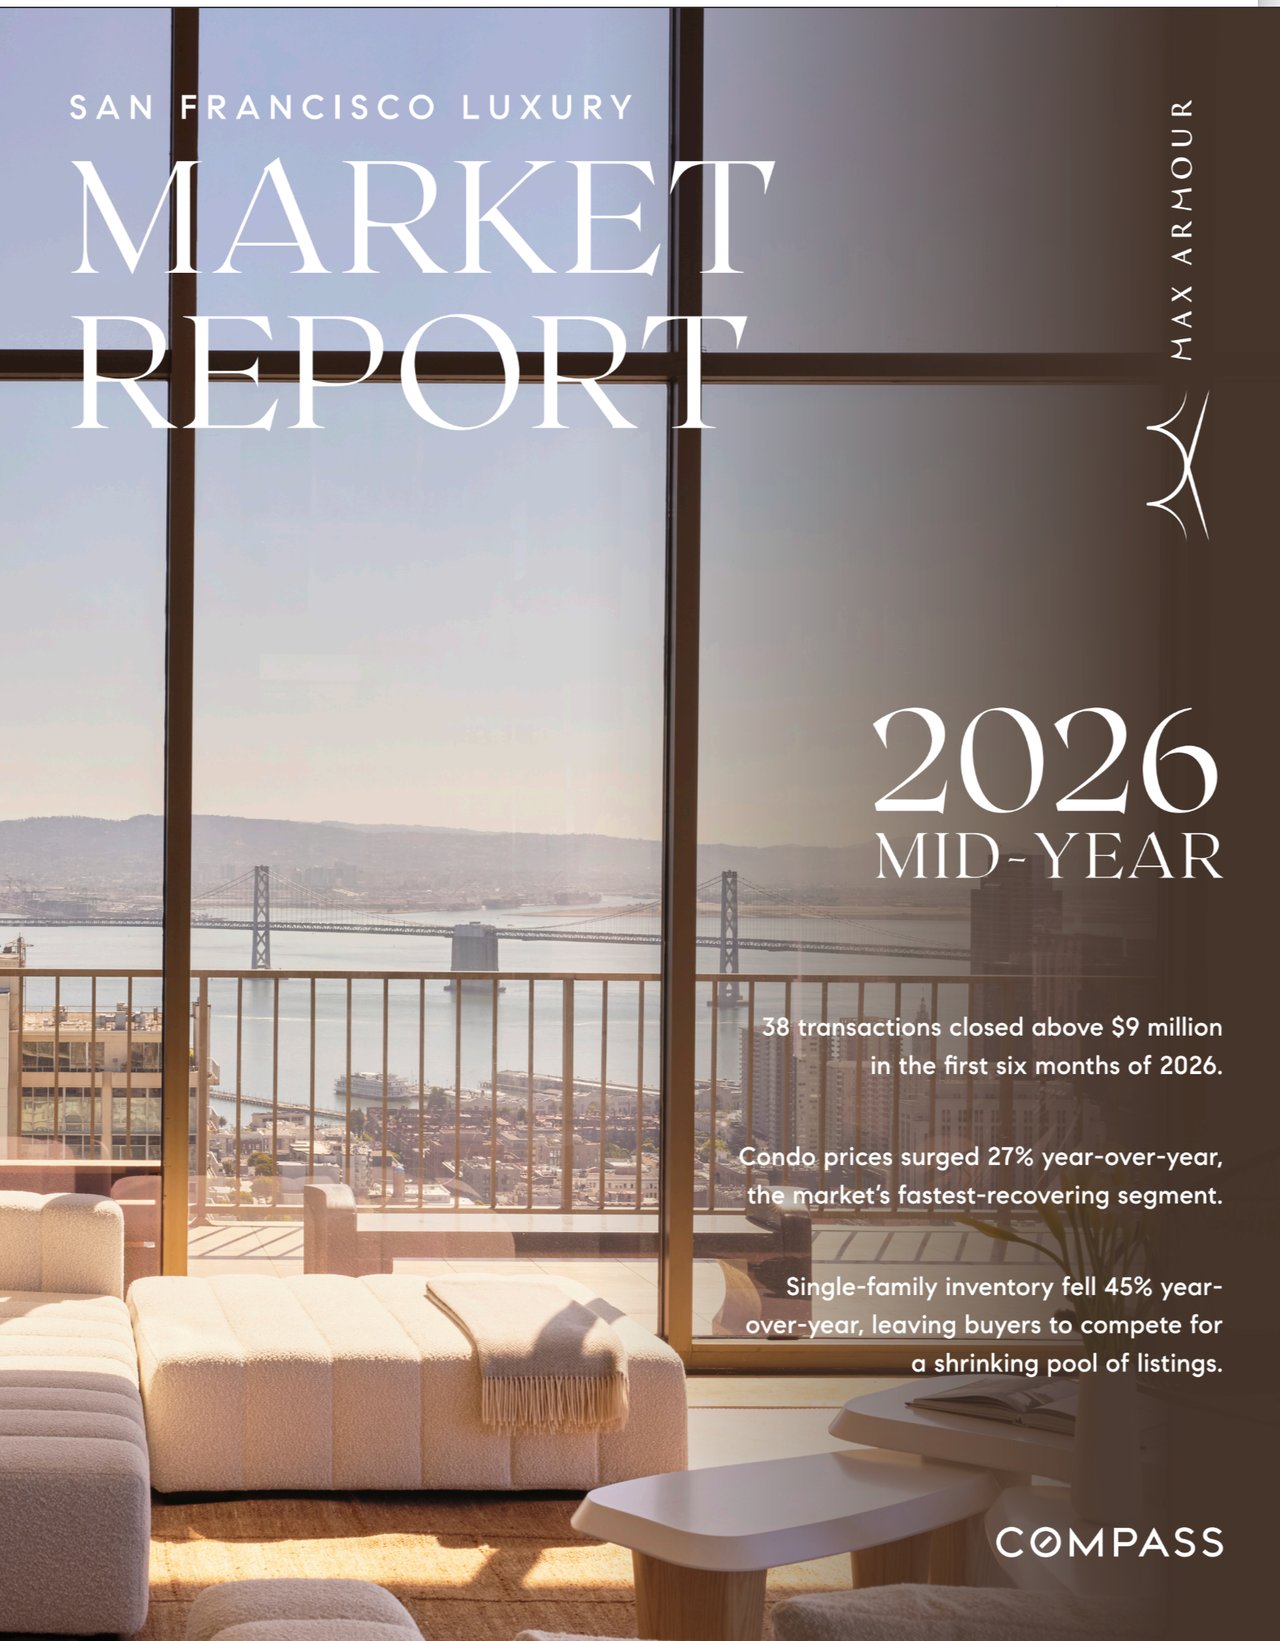
Download our latest End of Year Market 2025 report, including details of properites sold in Pacific Heights, Presidio, Marina, Russian Hill and Sea Drift.

Download our latest End of Year Market 2025 report, including details of properites sold in Pacific Heights, Presidio, Marina, Russian Hill and Sea Drift.
891 Beach St San Francisco CA 94109
Regardless if you're selling, buying, renovating, or just need a nice place to eat, we'll make sure you find what you're looking for.
MAX ARMOUR | CA DRE# 01446122
891 Beach St San Francisco CA 94109
Regardless if you're selling, buying, renovating, or just need a nice place to eat, we'll make sure you find what you're looking for.
MAX ARMOUR | CA DRE# 01446122