Max Armour
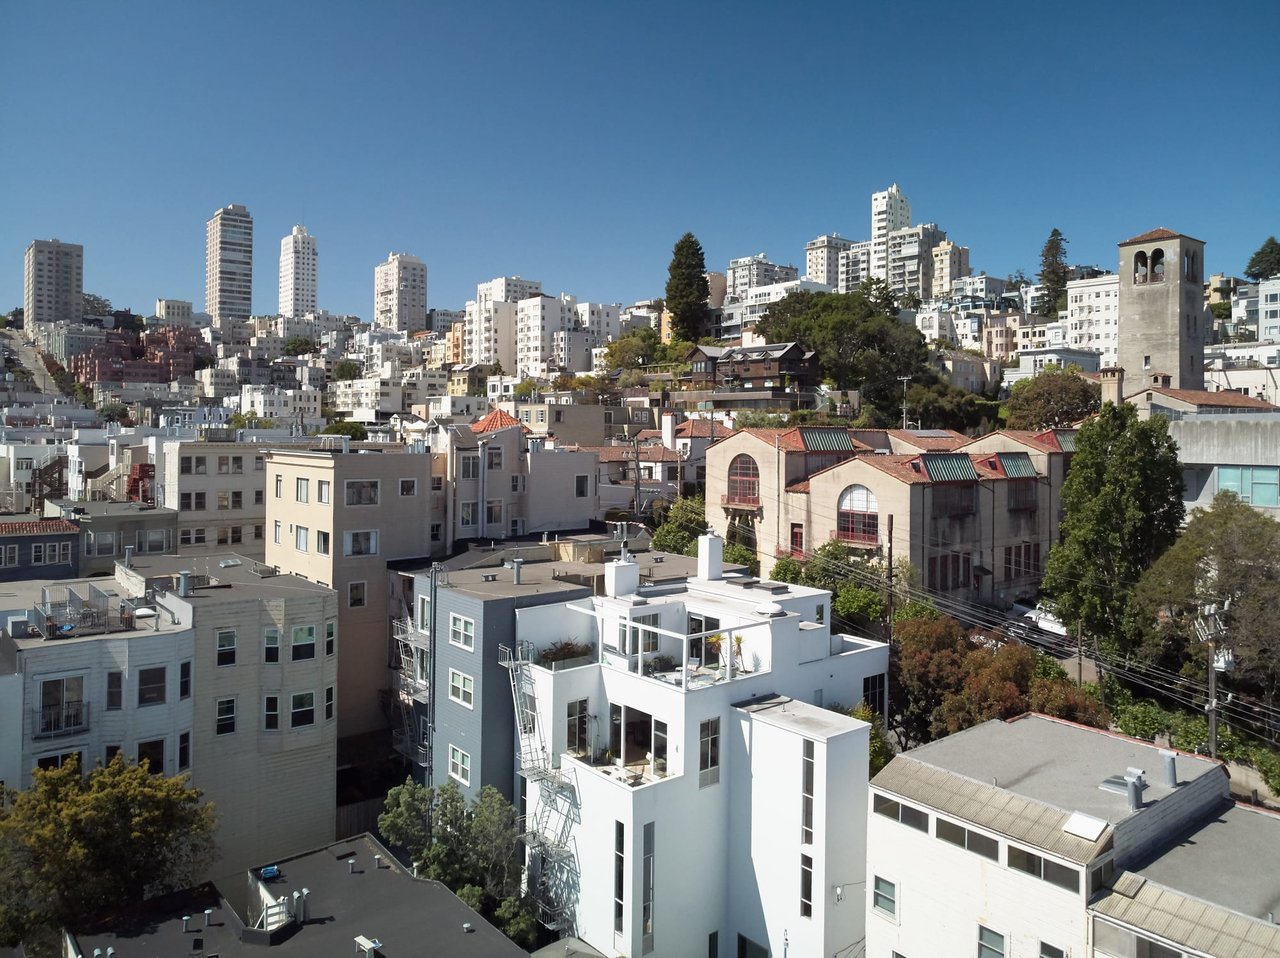
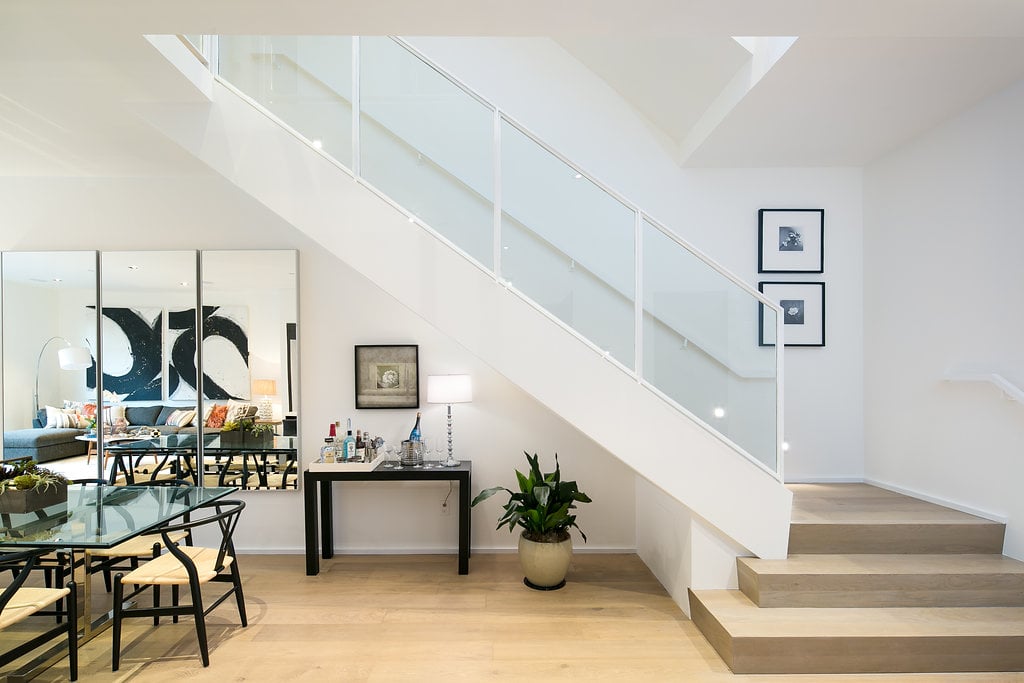
San Francisco neighborhood skyline, with a modern white apartment building in the foreground.

San Francisco July

Q2 Report
 
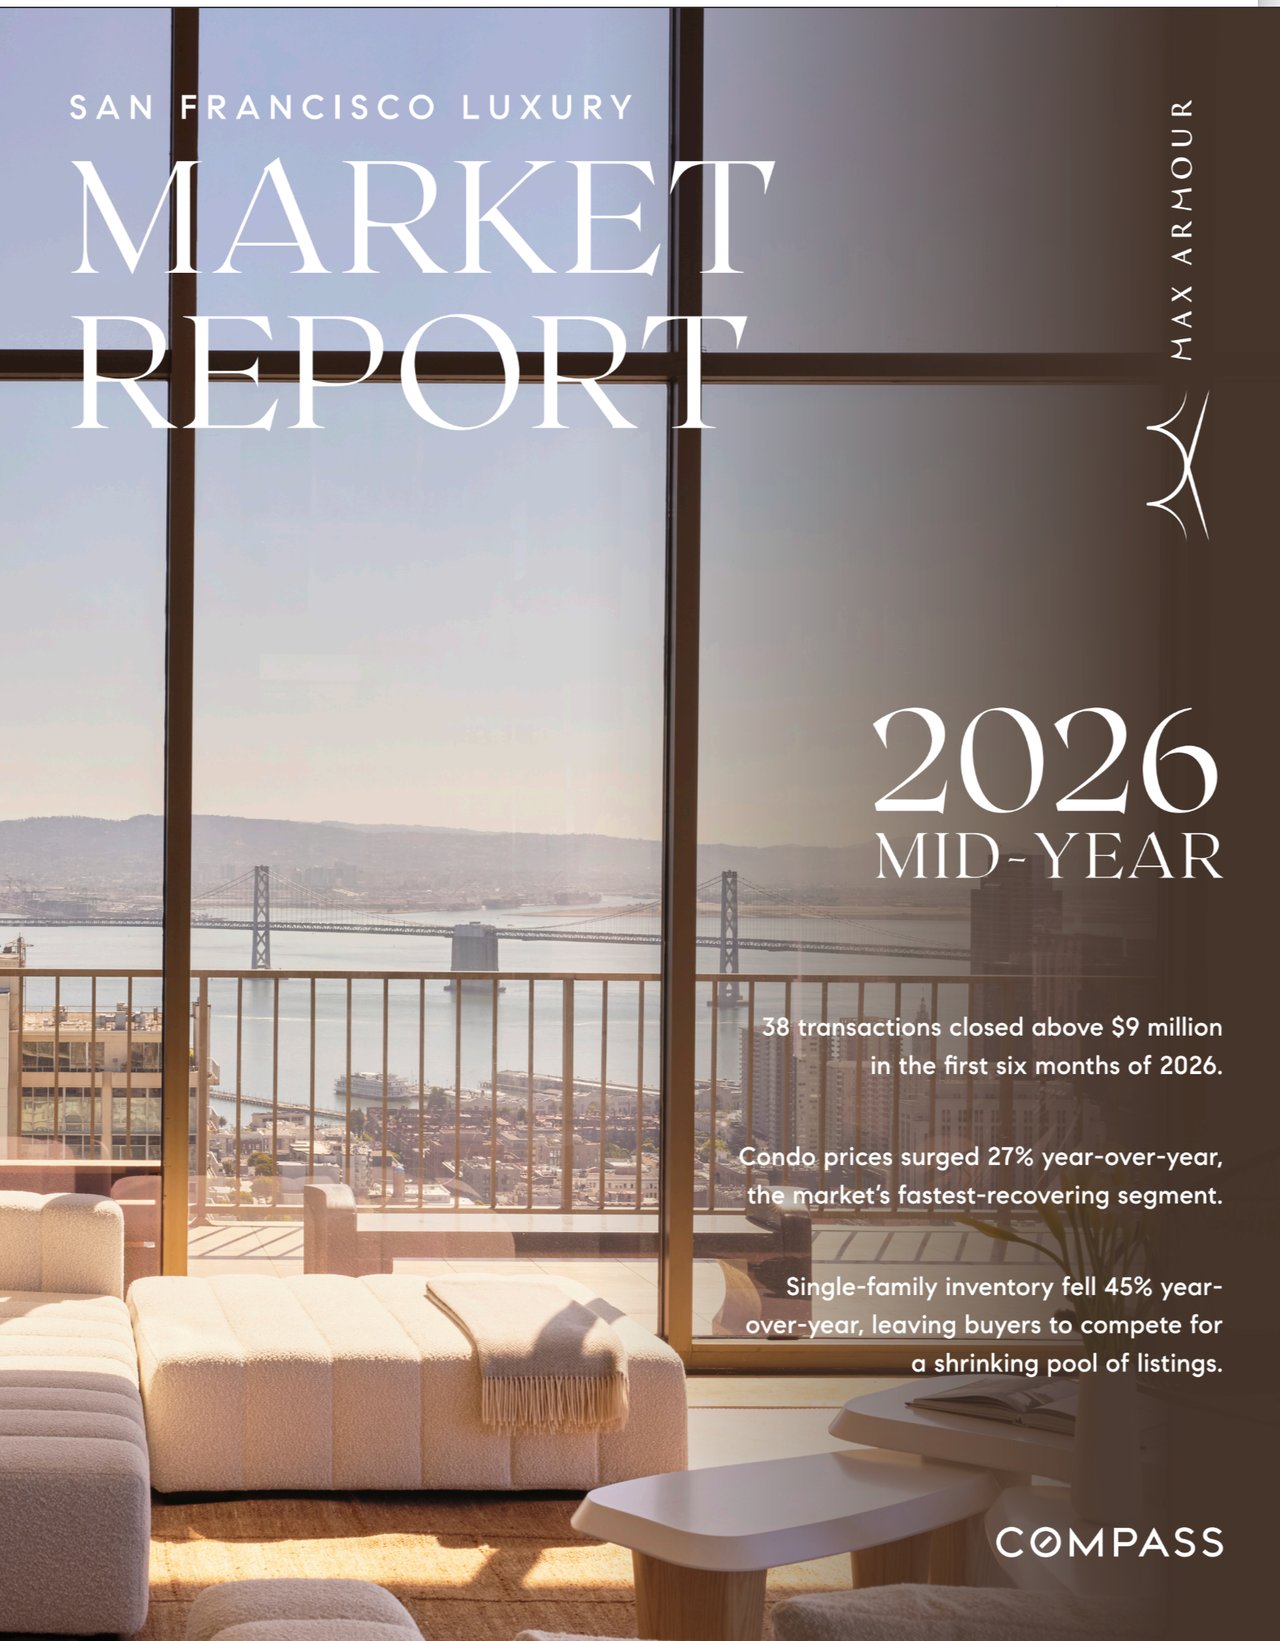
San Francisco Real Estate July 2021 Report cover with an aerial view of downtown, the bay, and a bridge.
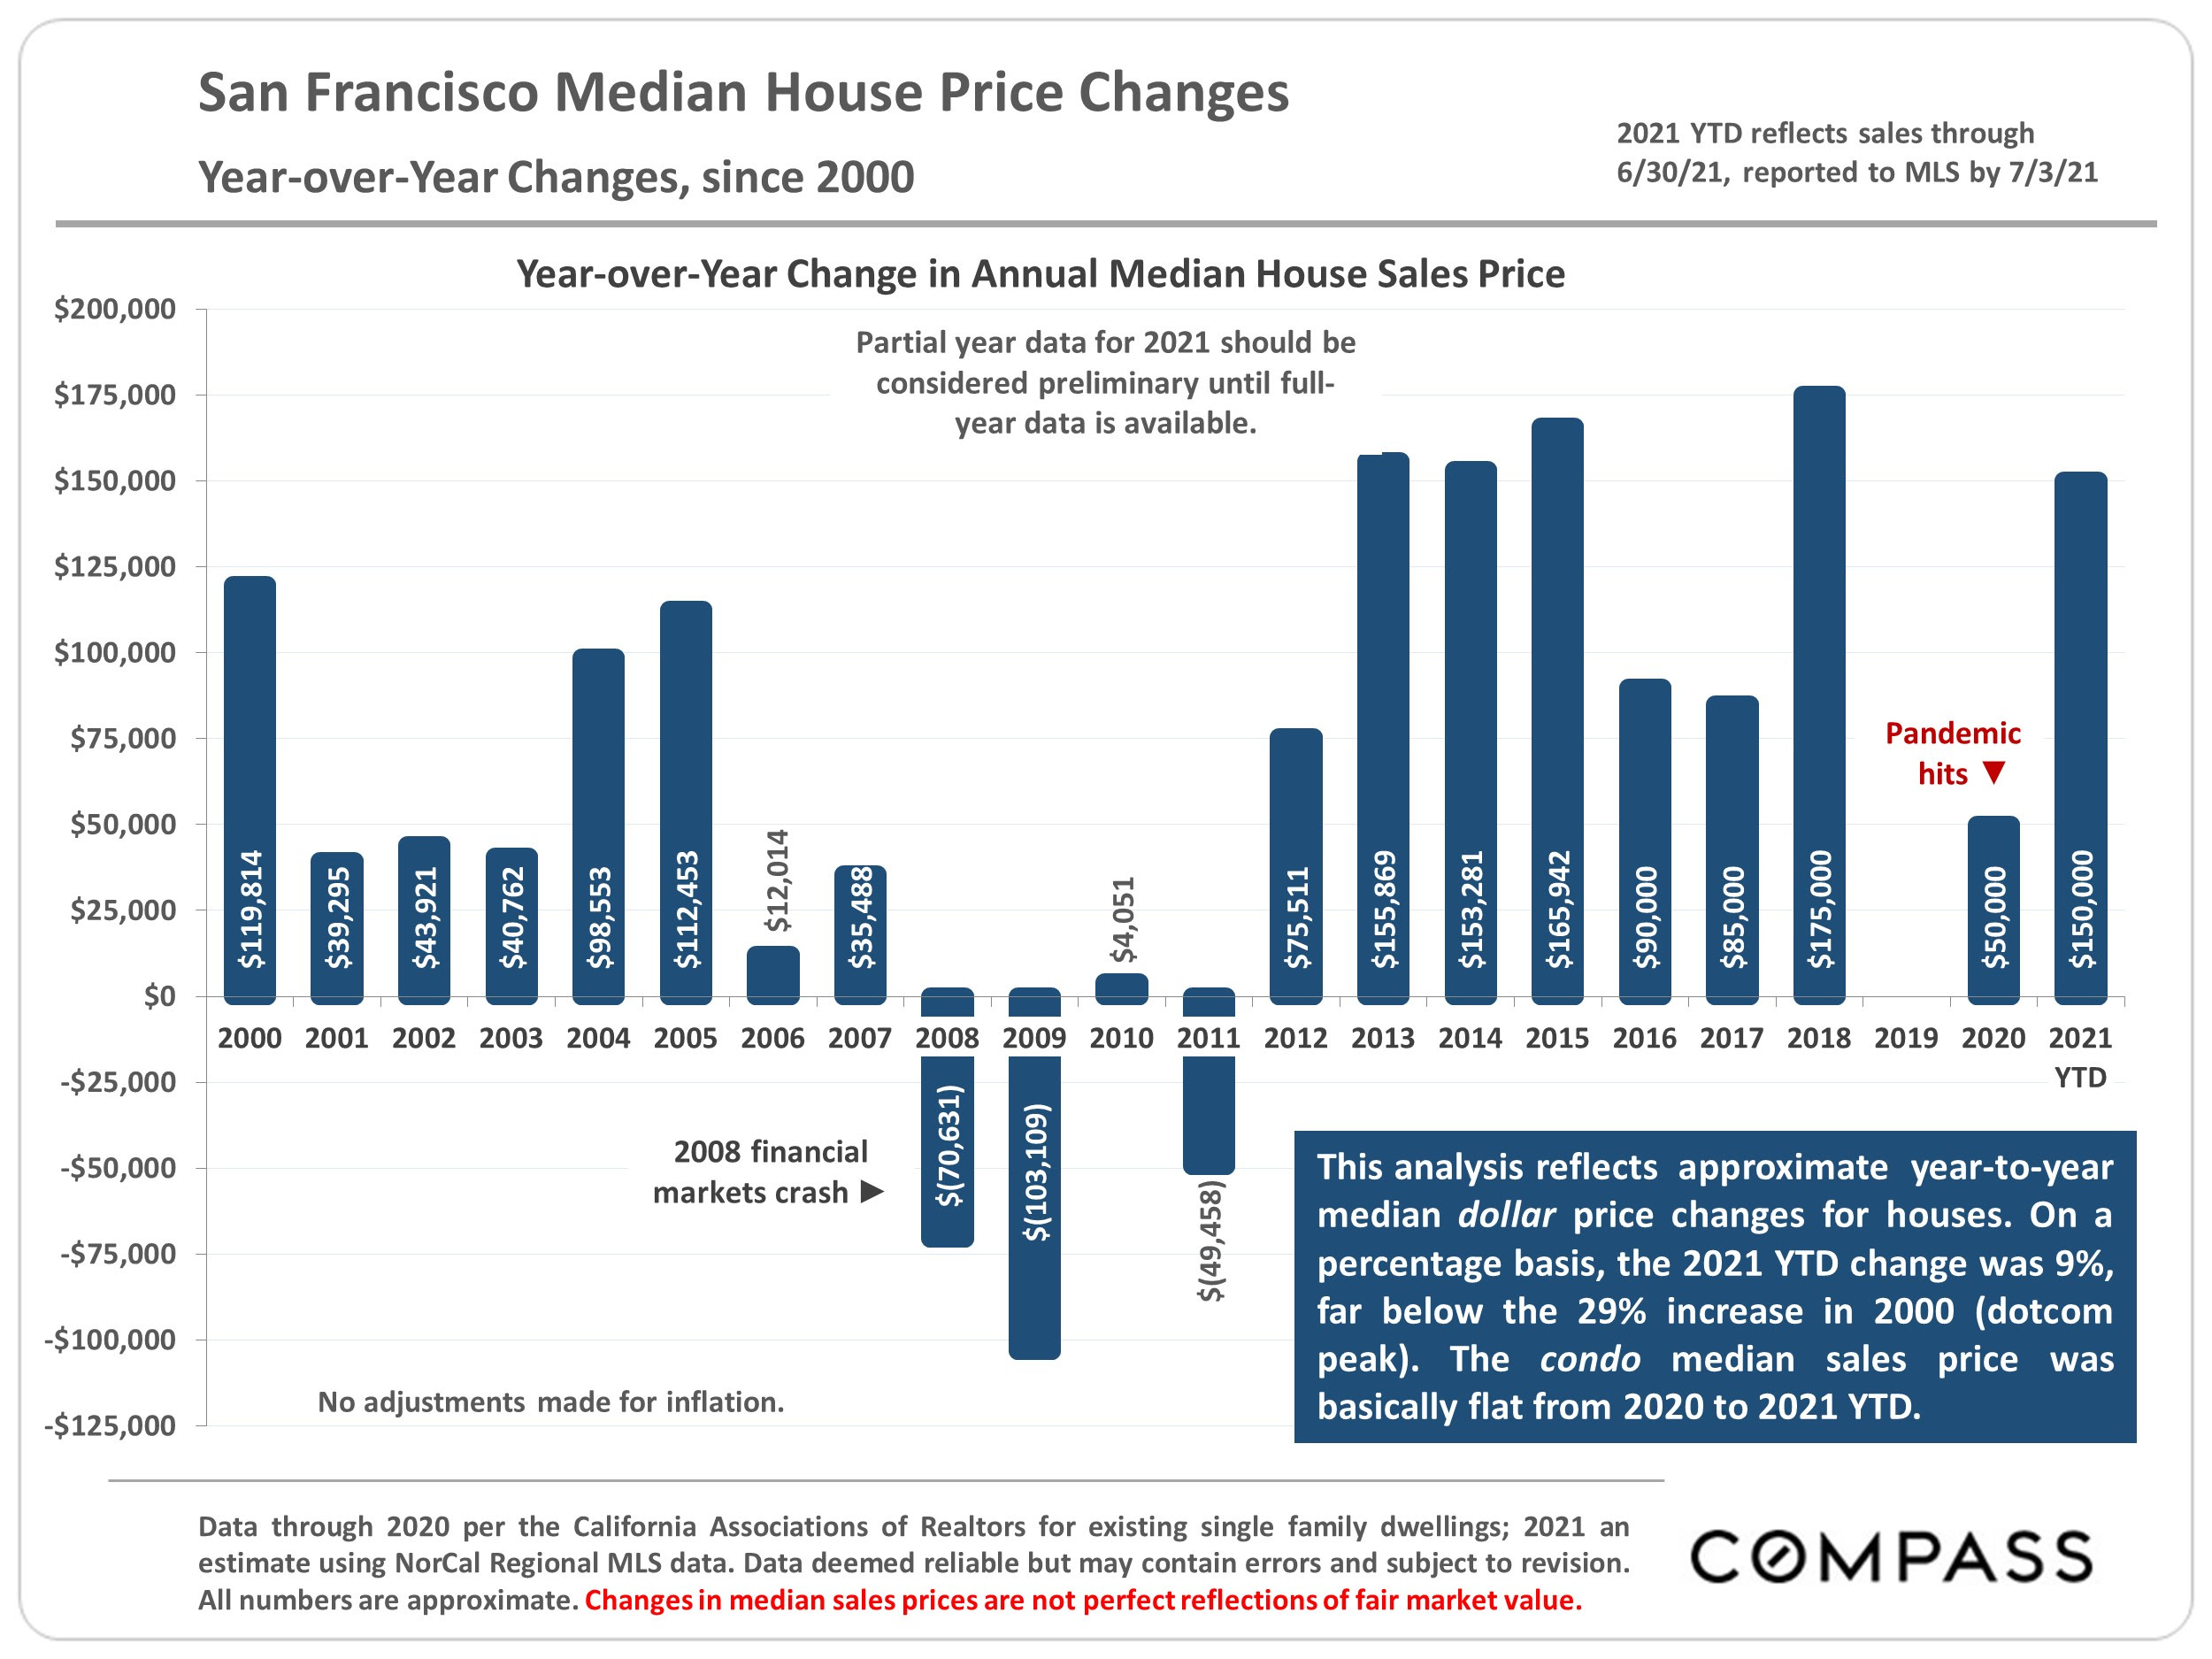
Chart of San Francisco annual median house price changes from 2000 to 2021 YTD, with financial-crash and pandemic annotations.
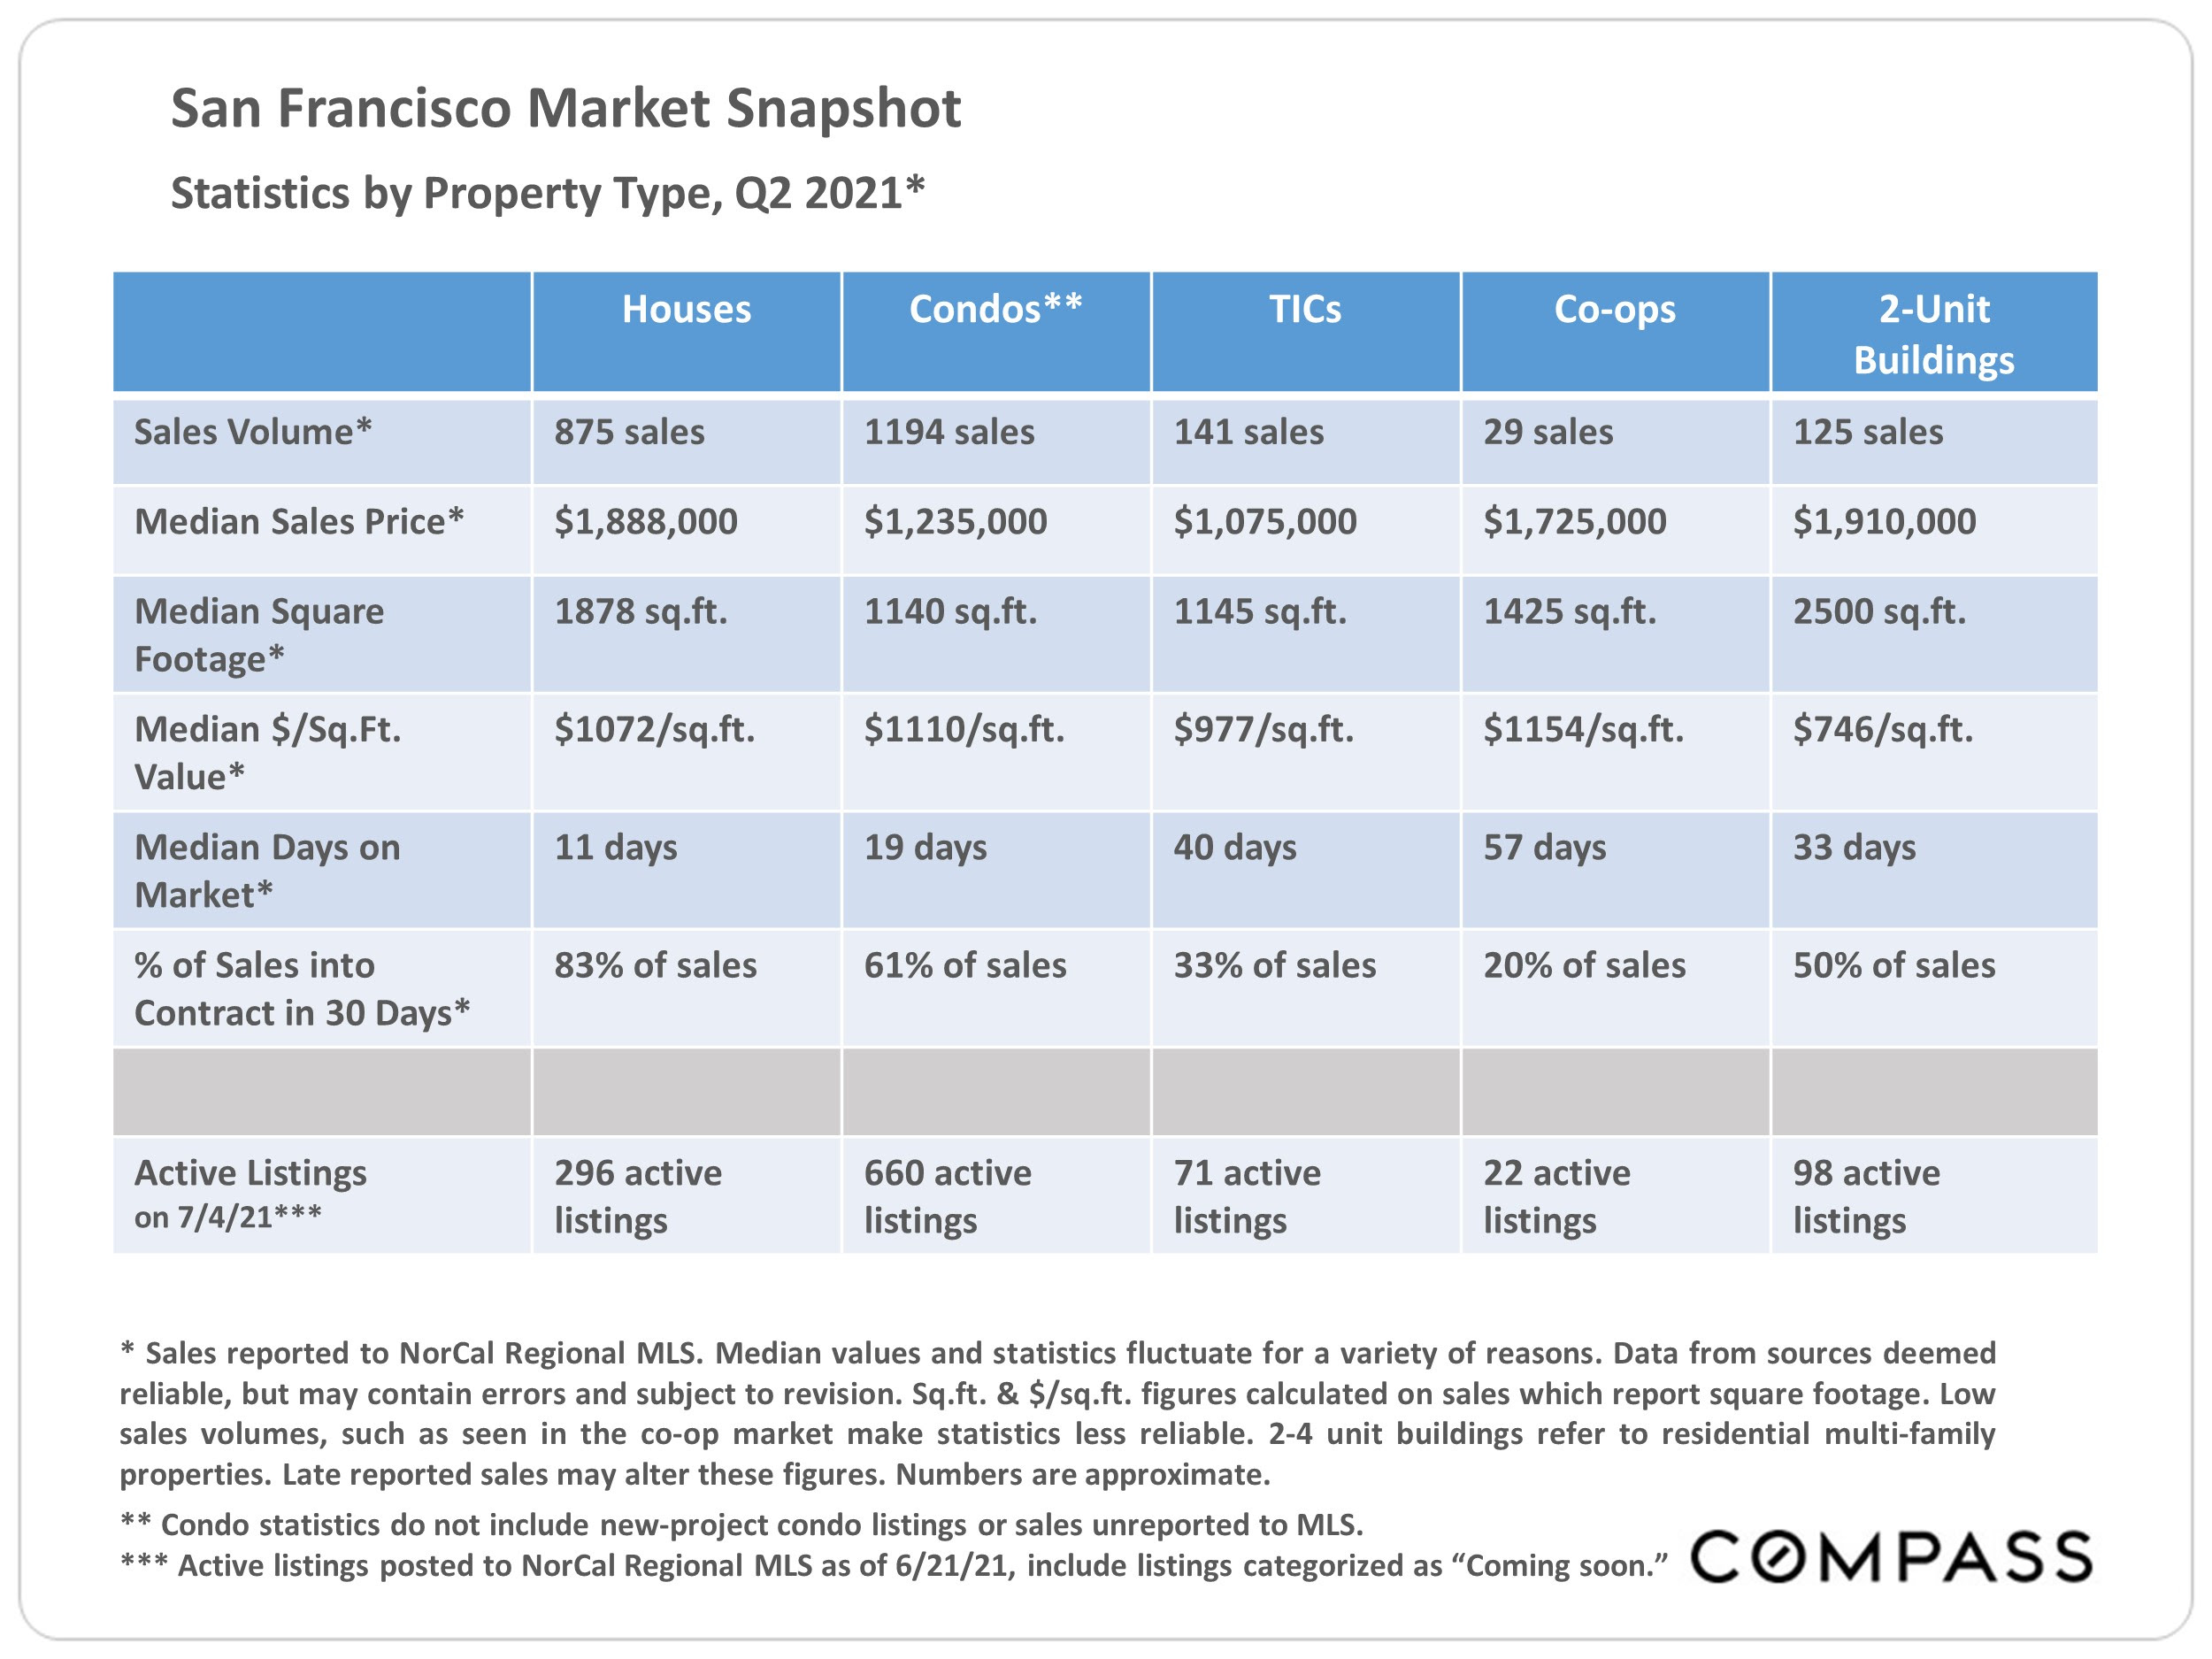
San Francisco Q2 2021 market statistics table comparing five property types.
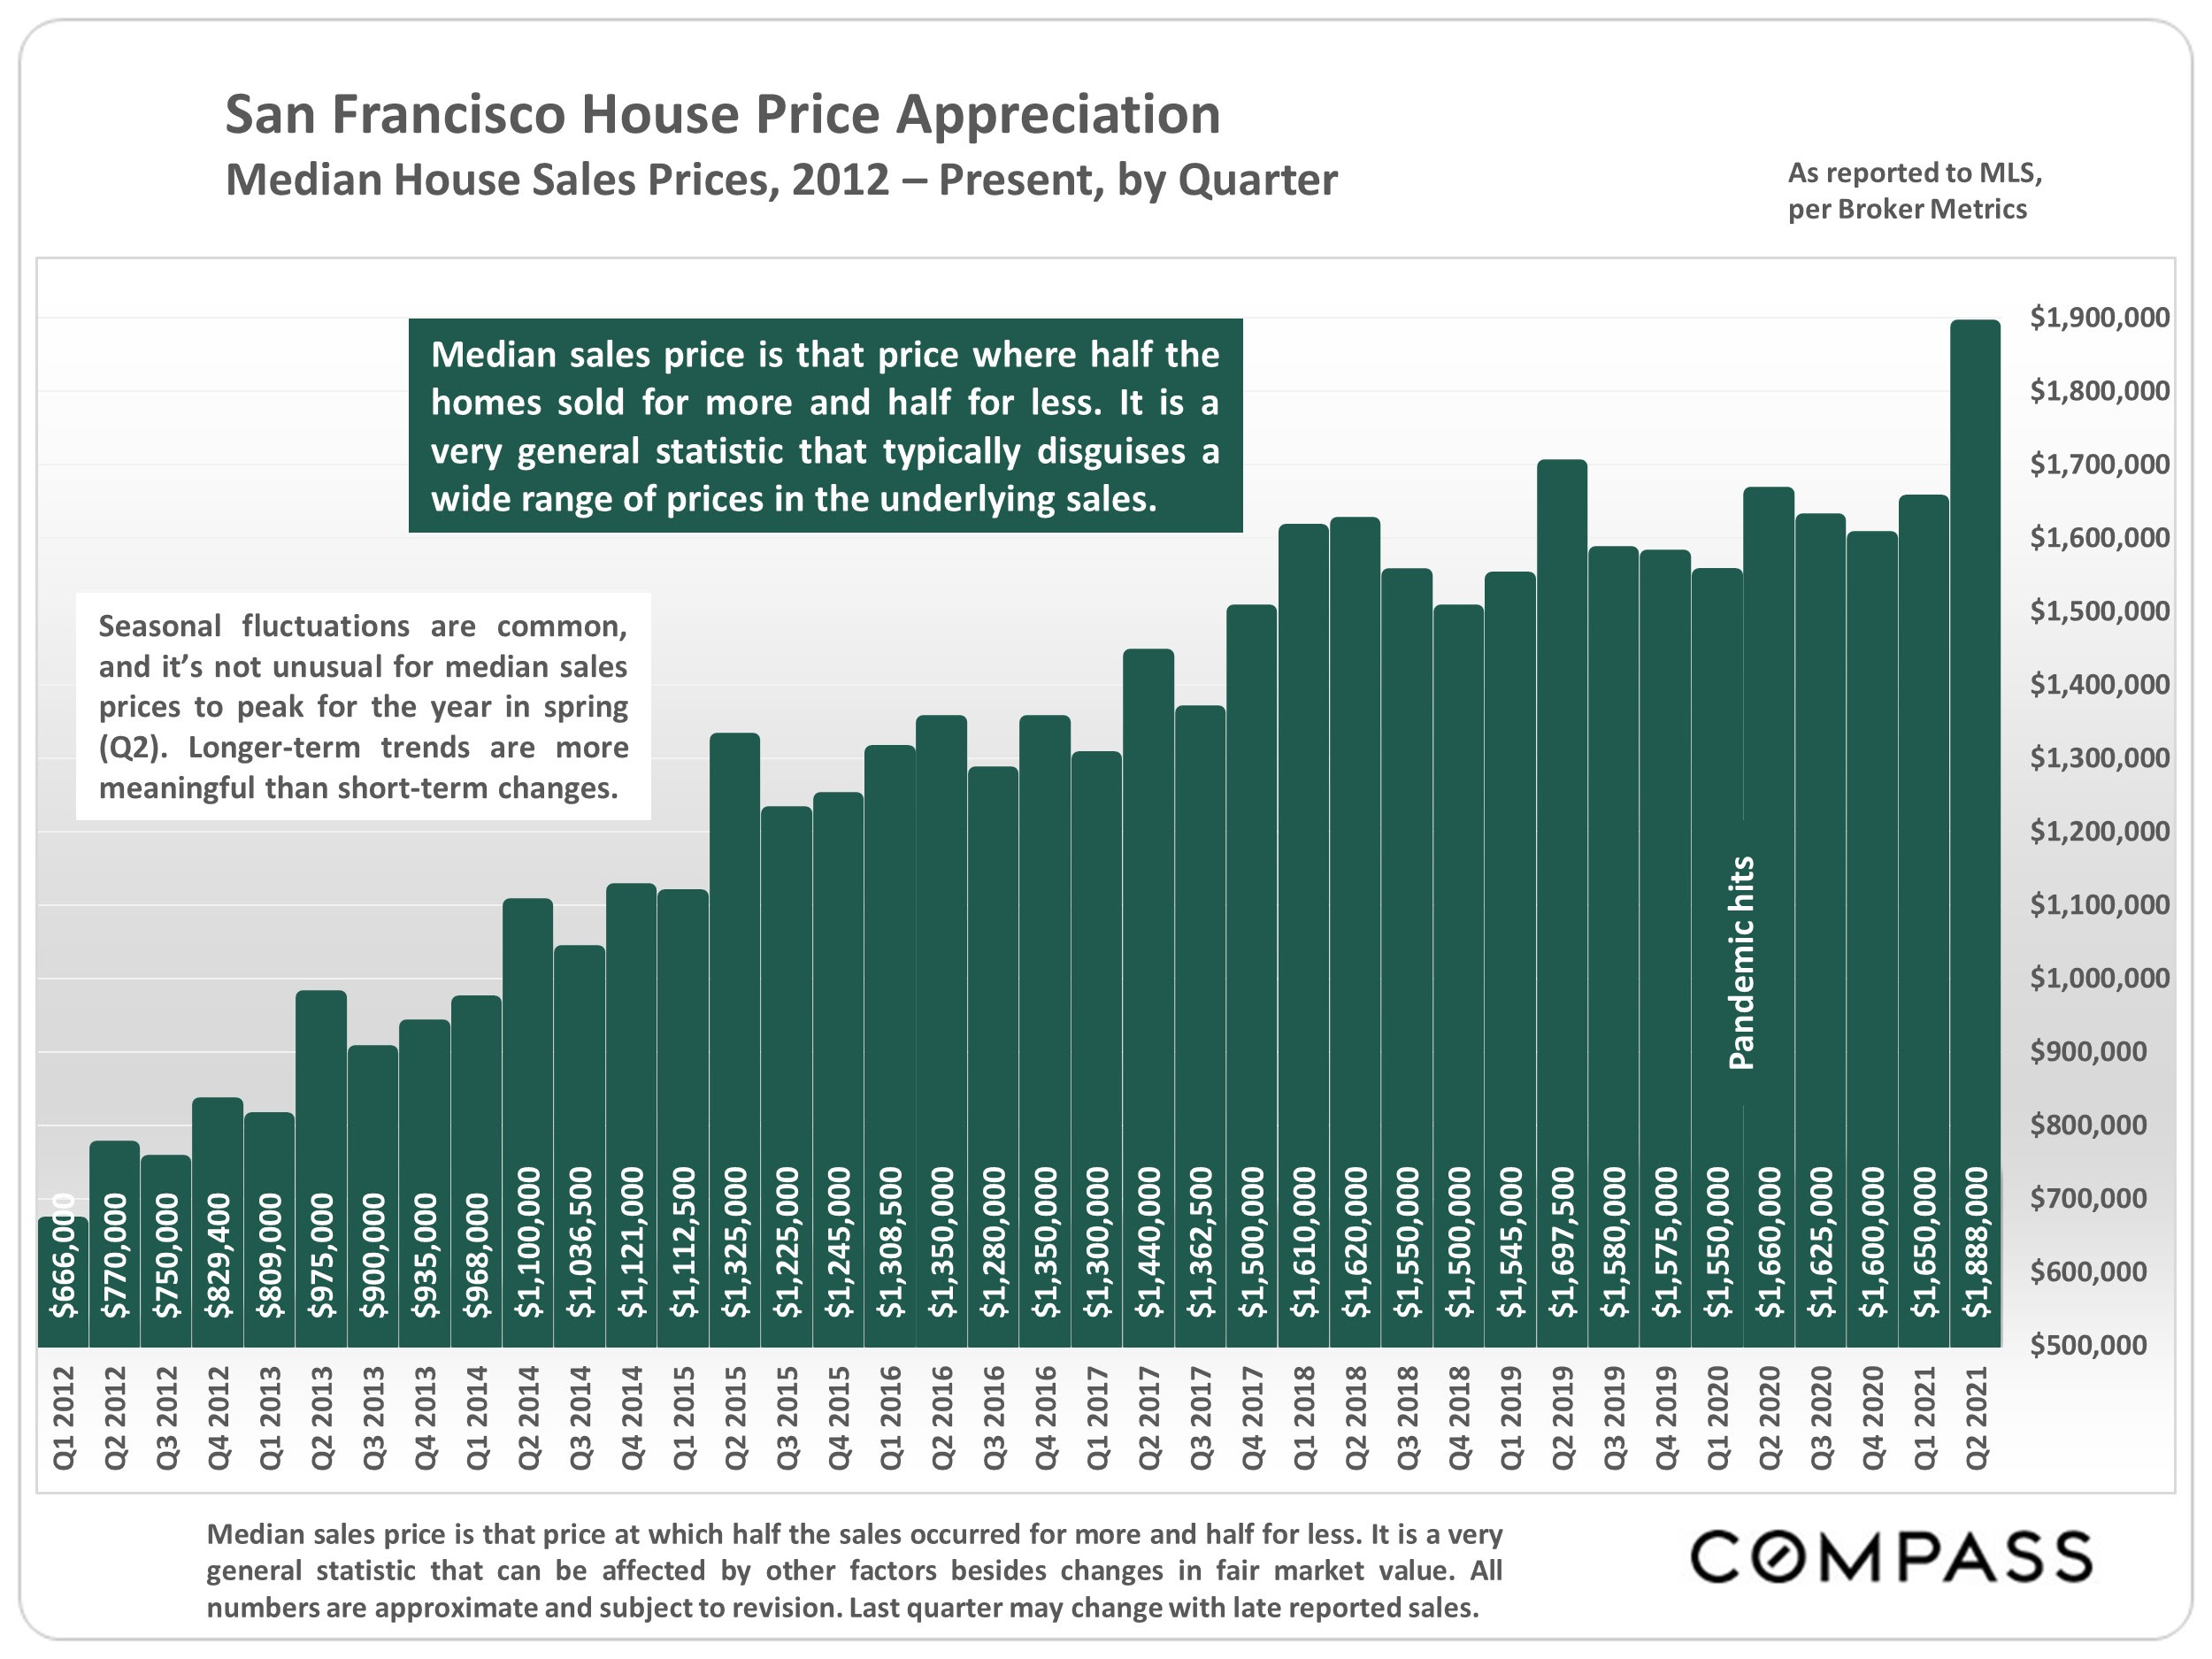
Chart of San Francisco quarterly median house prices, rising from $666,000 in 2012 to $1,888,000 in Q2 2021.
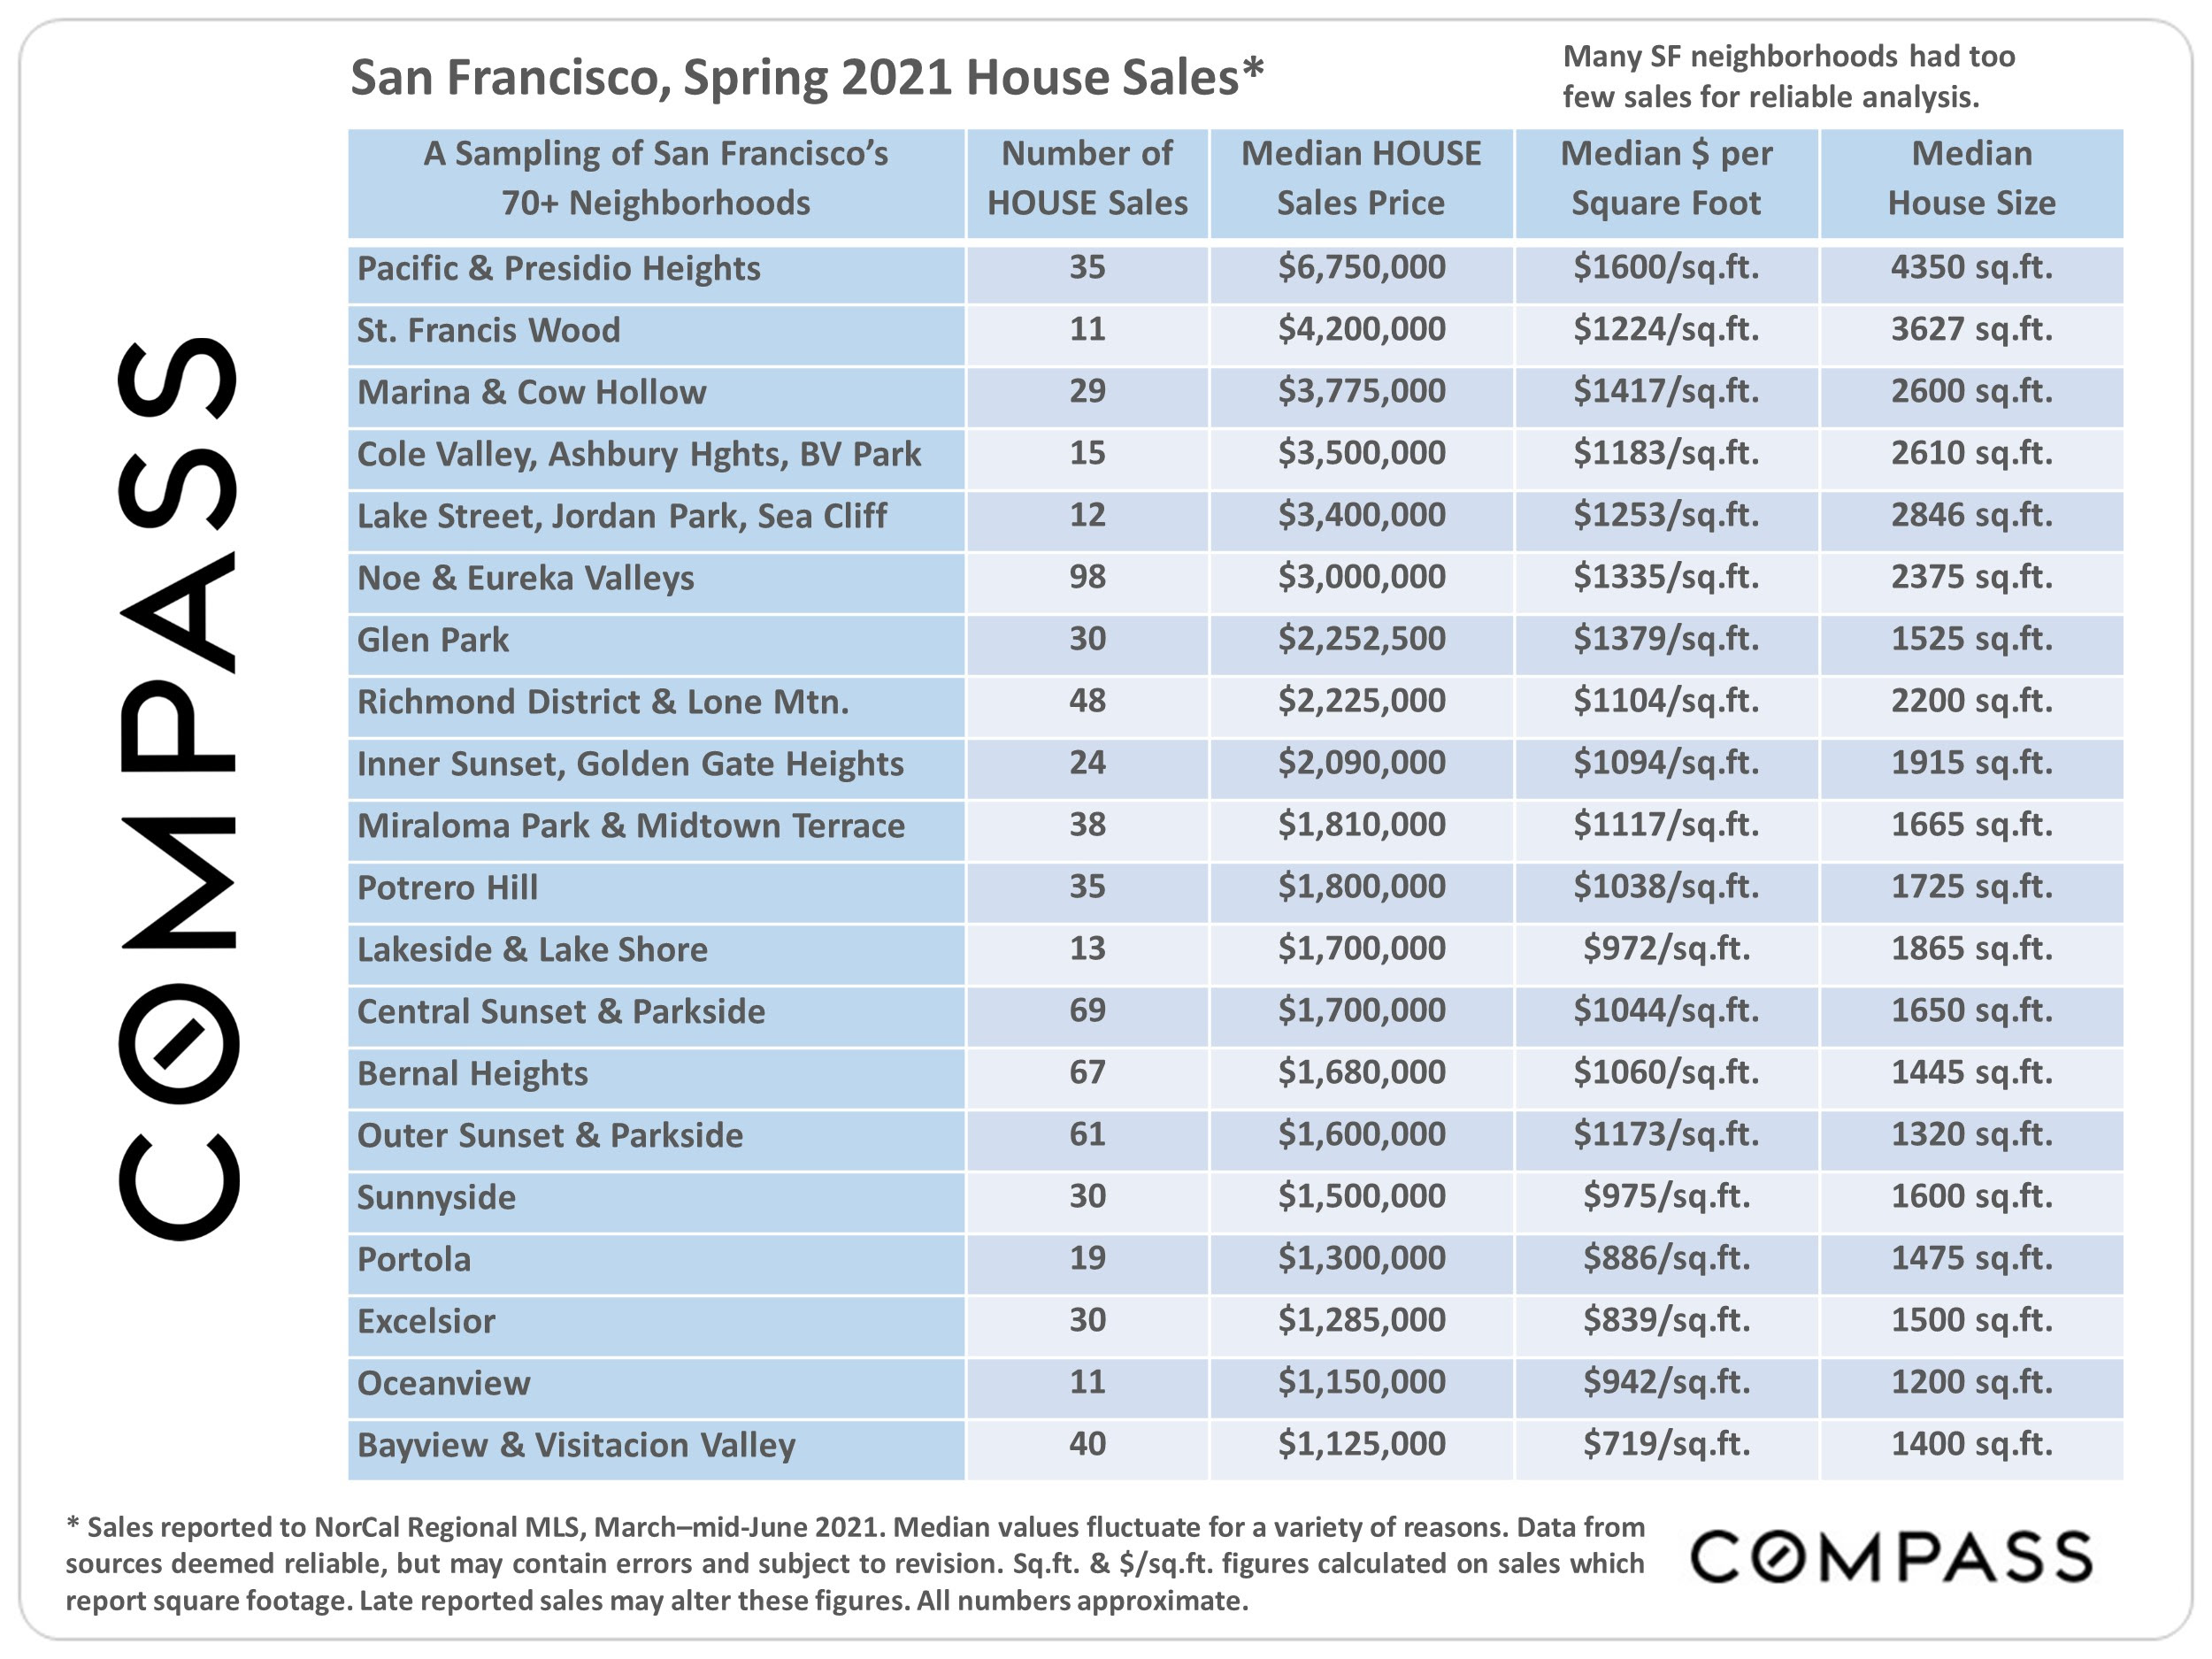
Table comparing spring 2021 San Francisco neighborhood home sales, median prices, price per square foot, and home sizes.
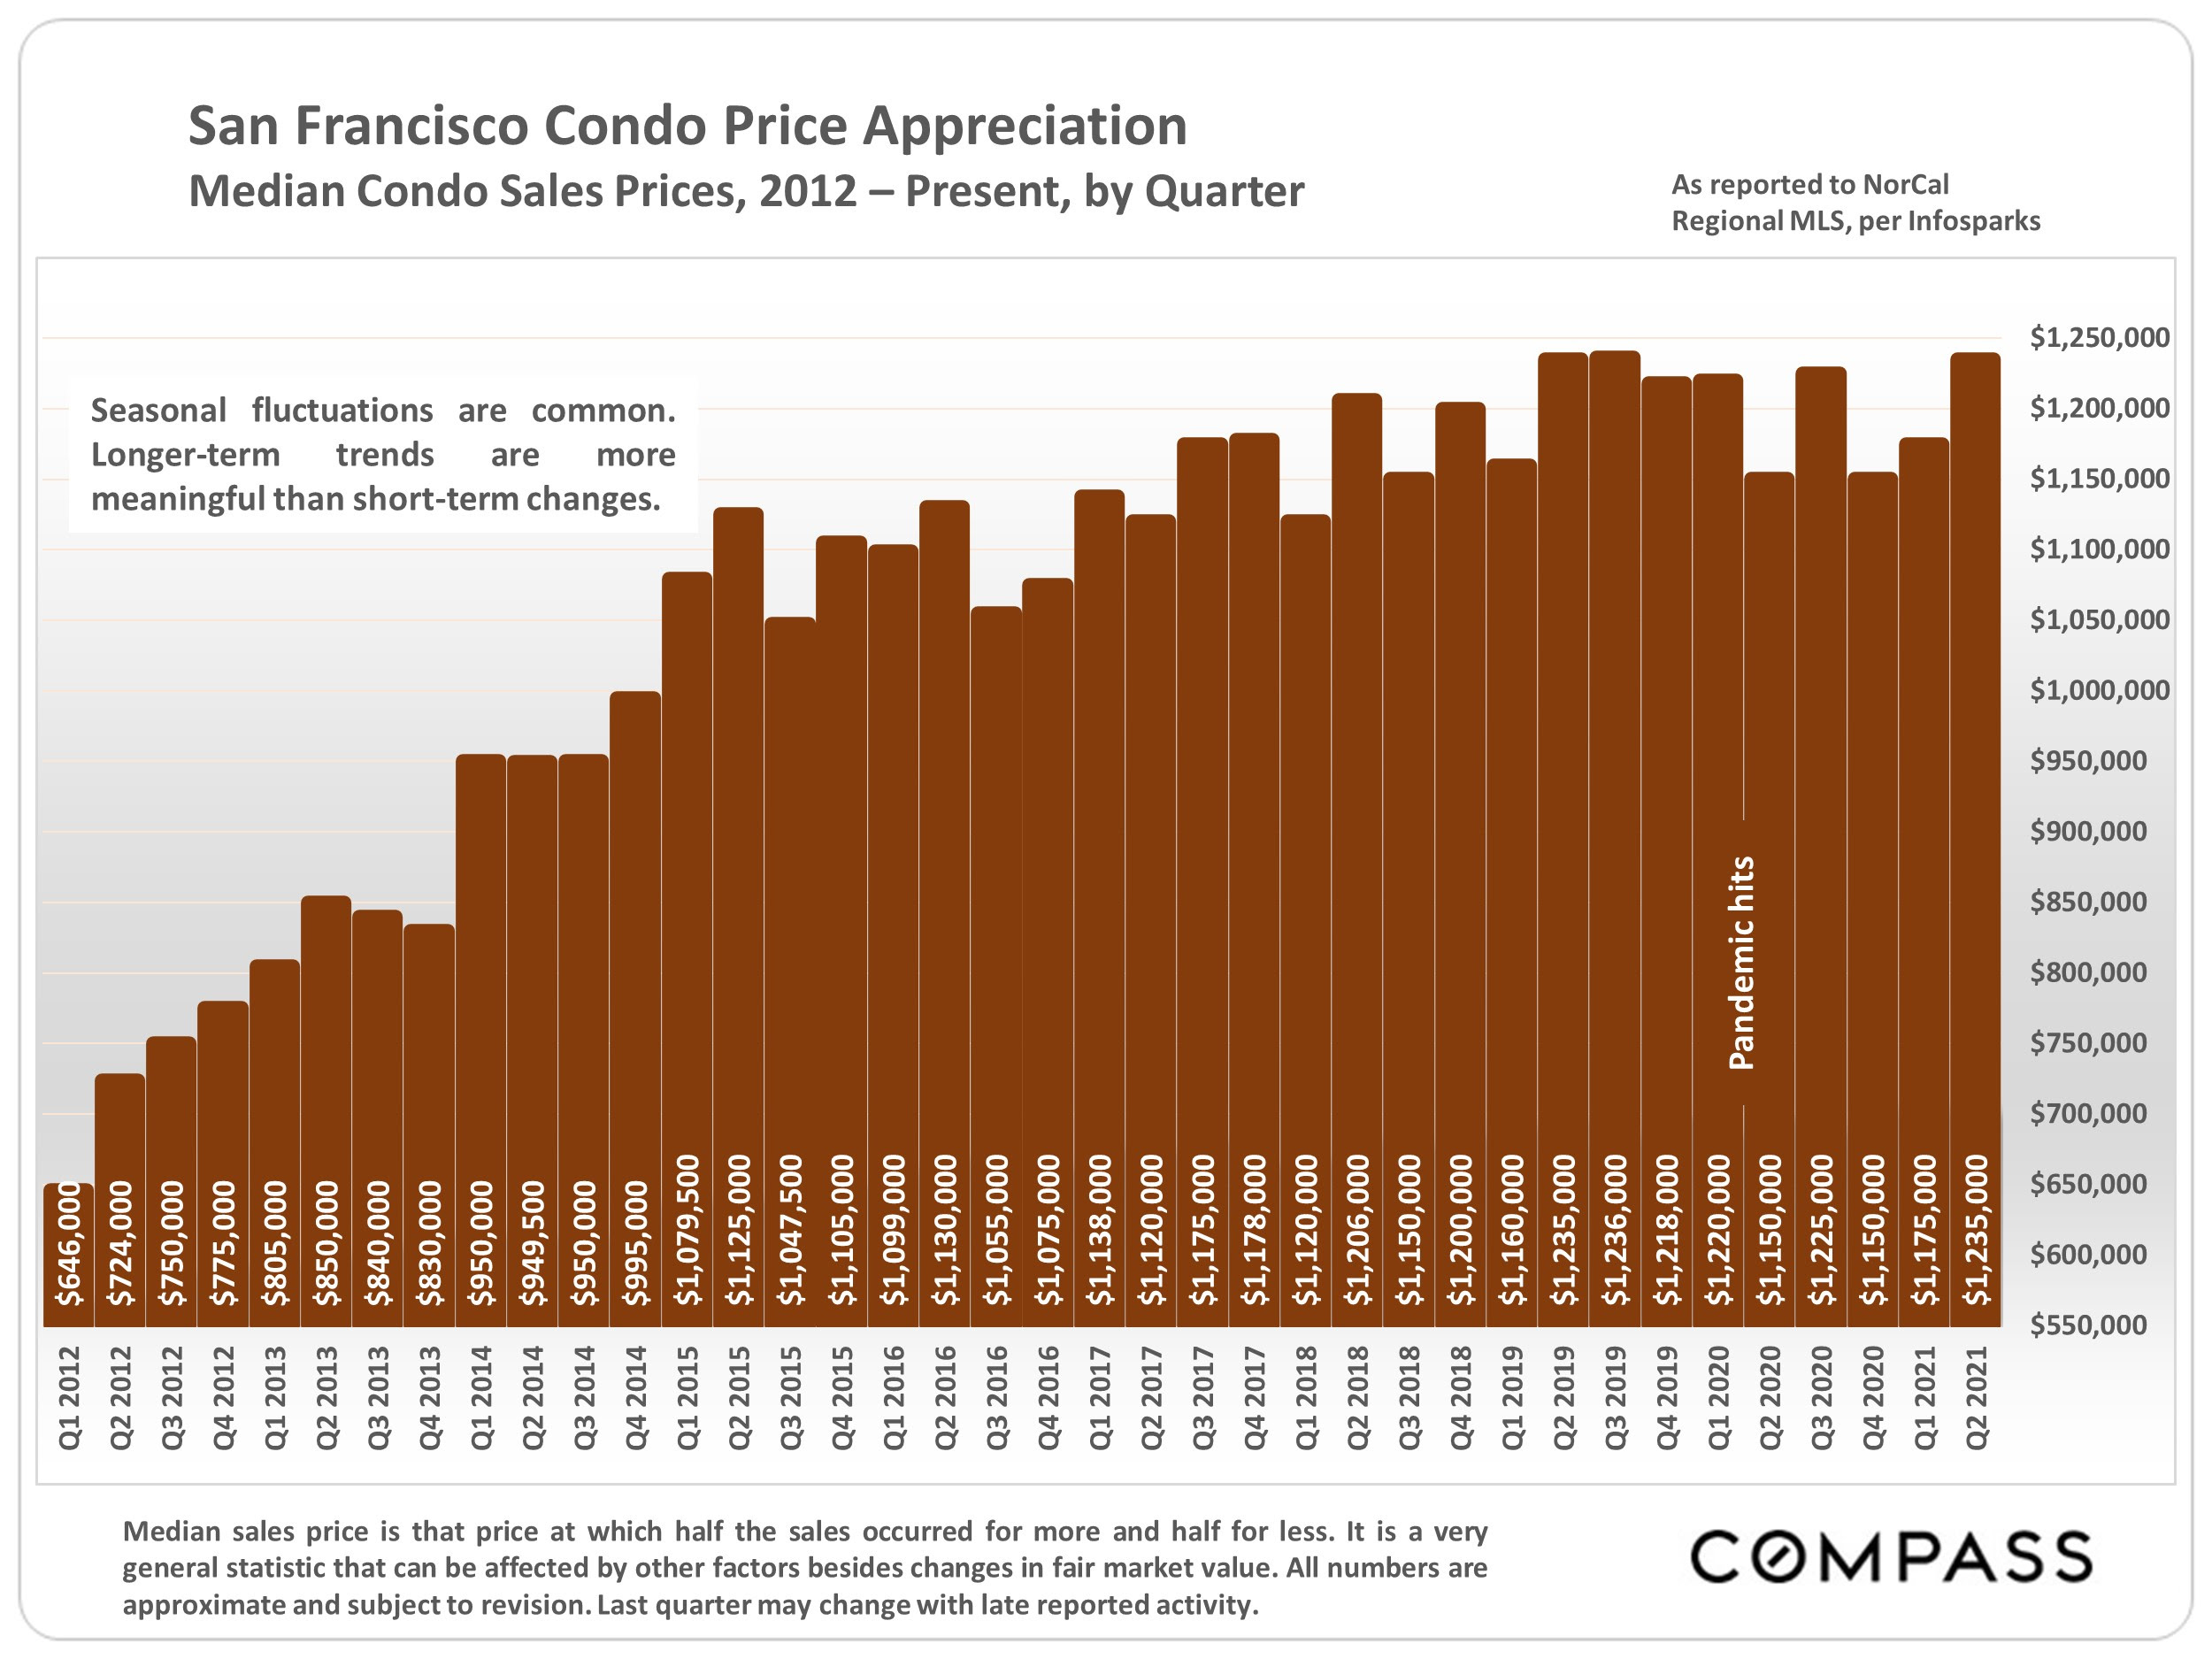
Bar chart of San Francisco median condo sales prices by quarter from 2012 to 2021.
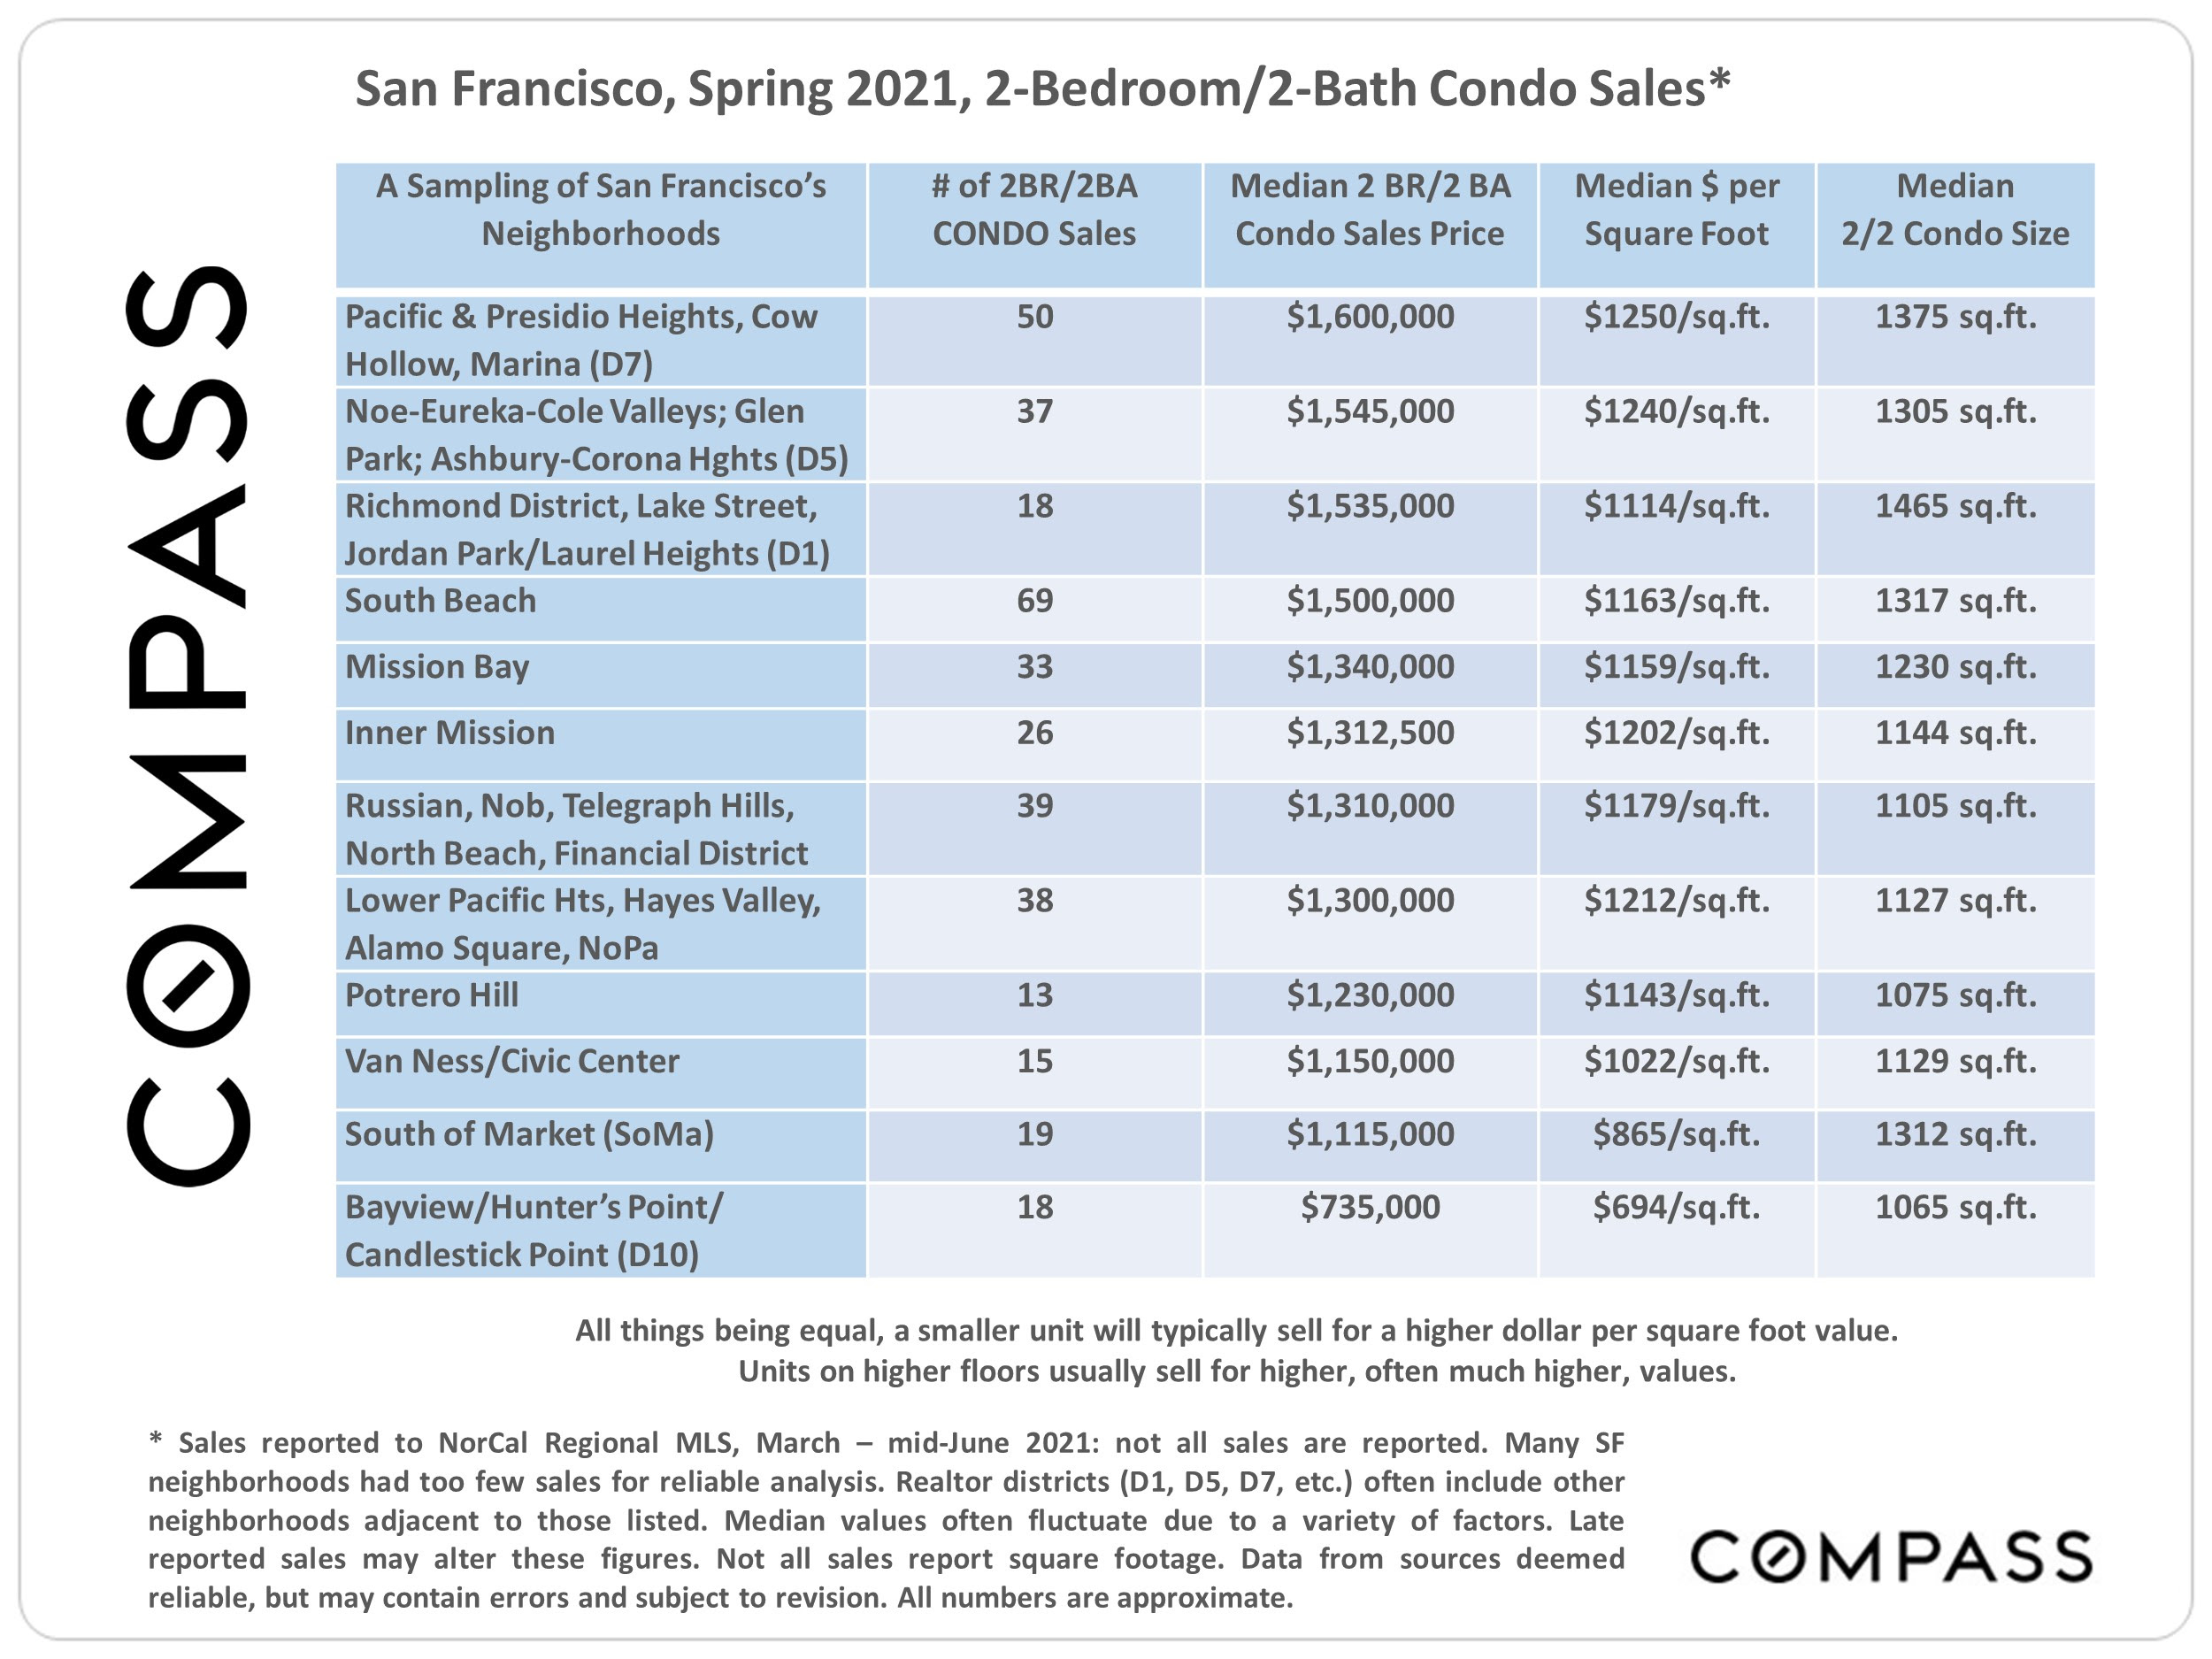
San Francisco spring 2021 two-bedroom, two-bath condo sales by neighborhood, with median prices and unit sizes.
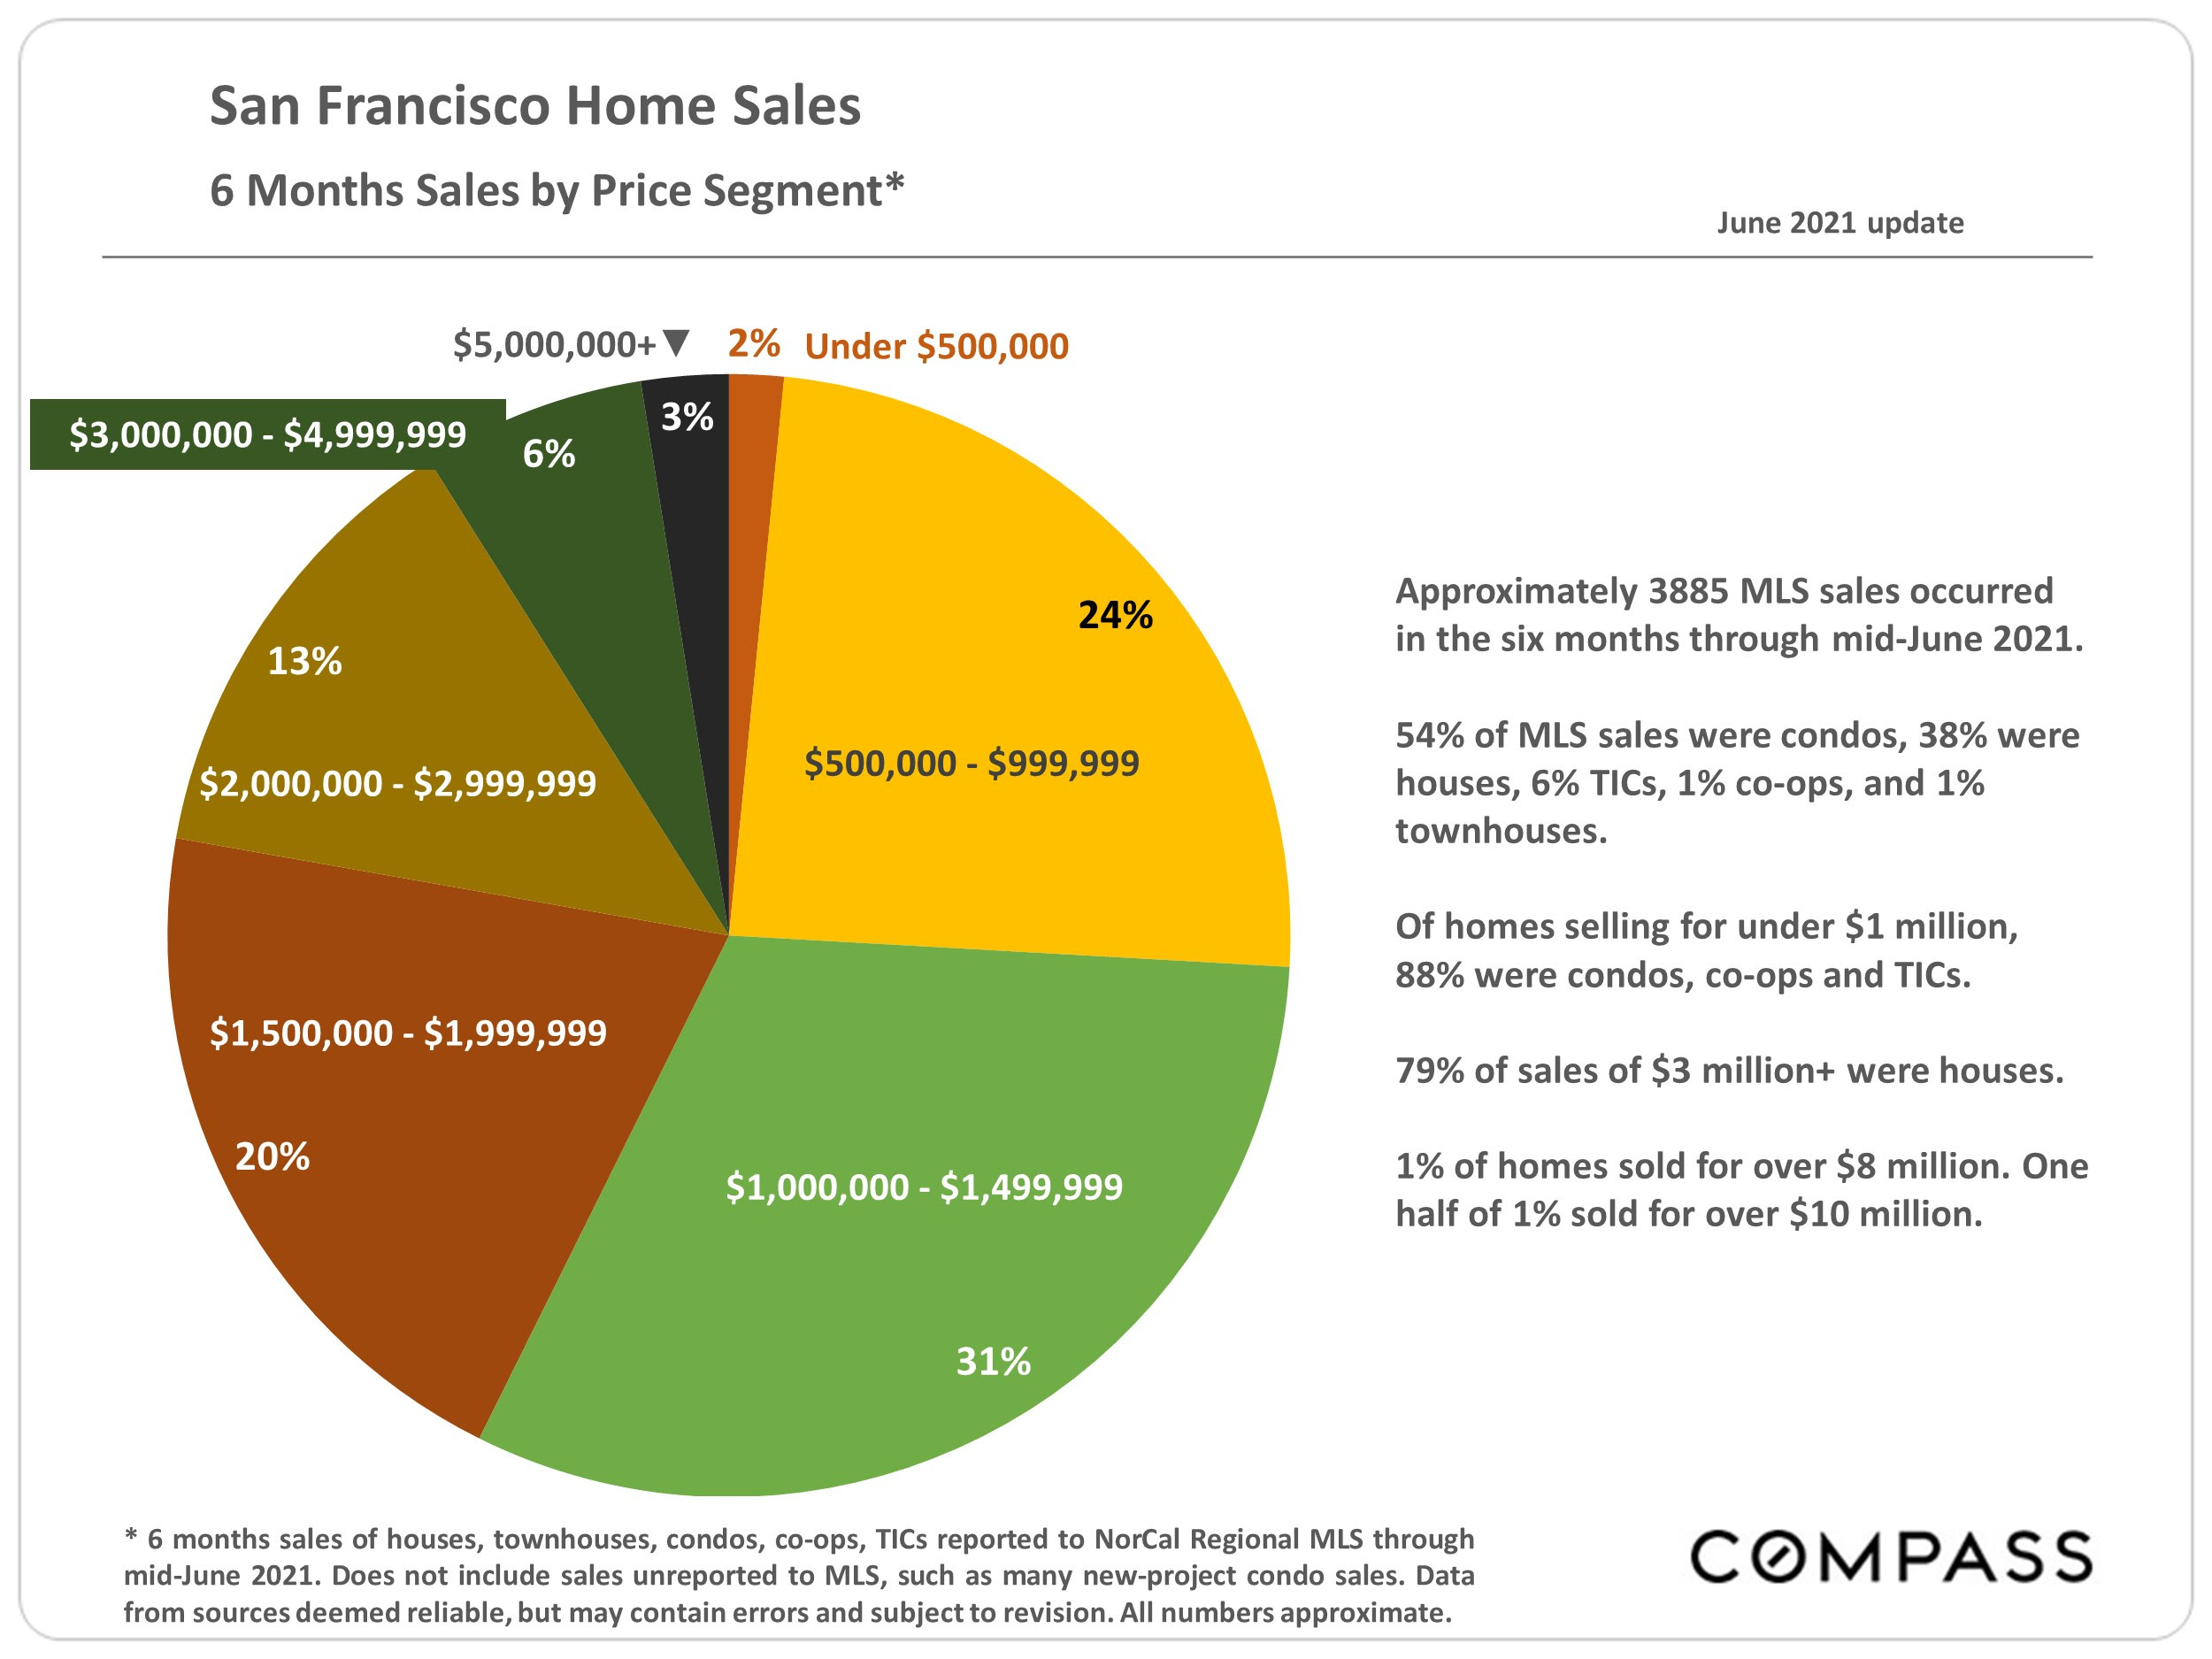
San Francisco home sales chart: 31% sold for $1–1.5 million, 24% for $500,000–$1 million, and 20% for $1.5–2 million.
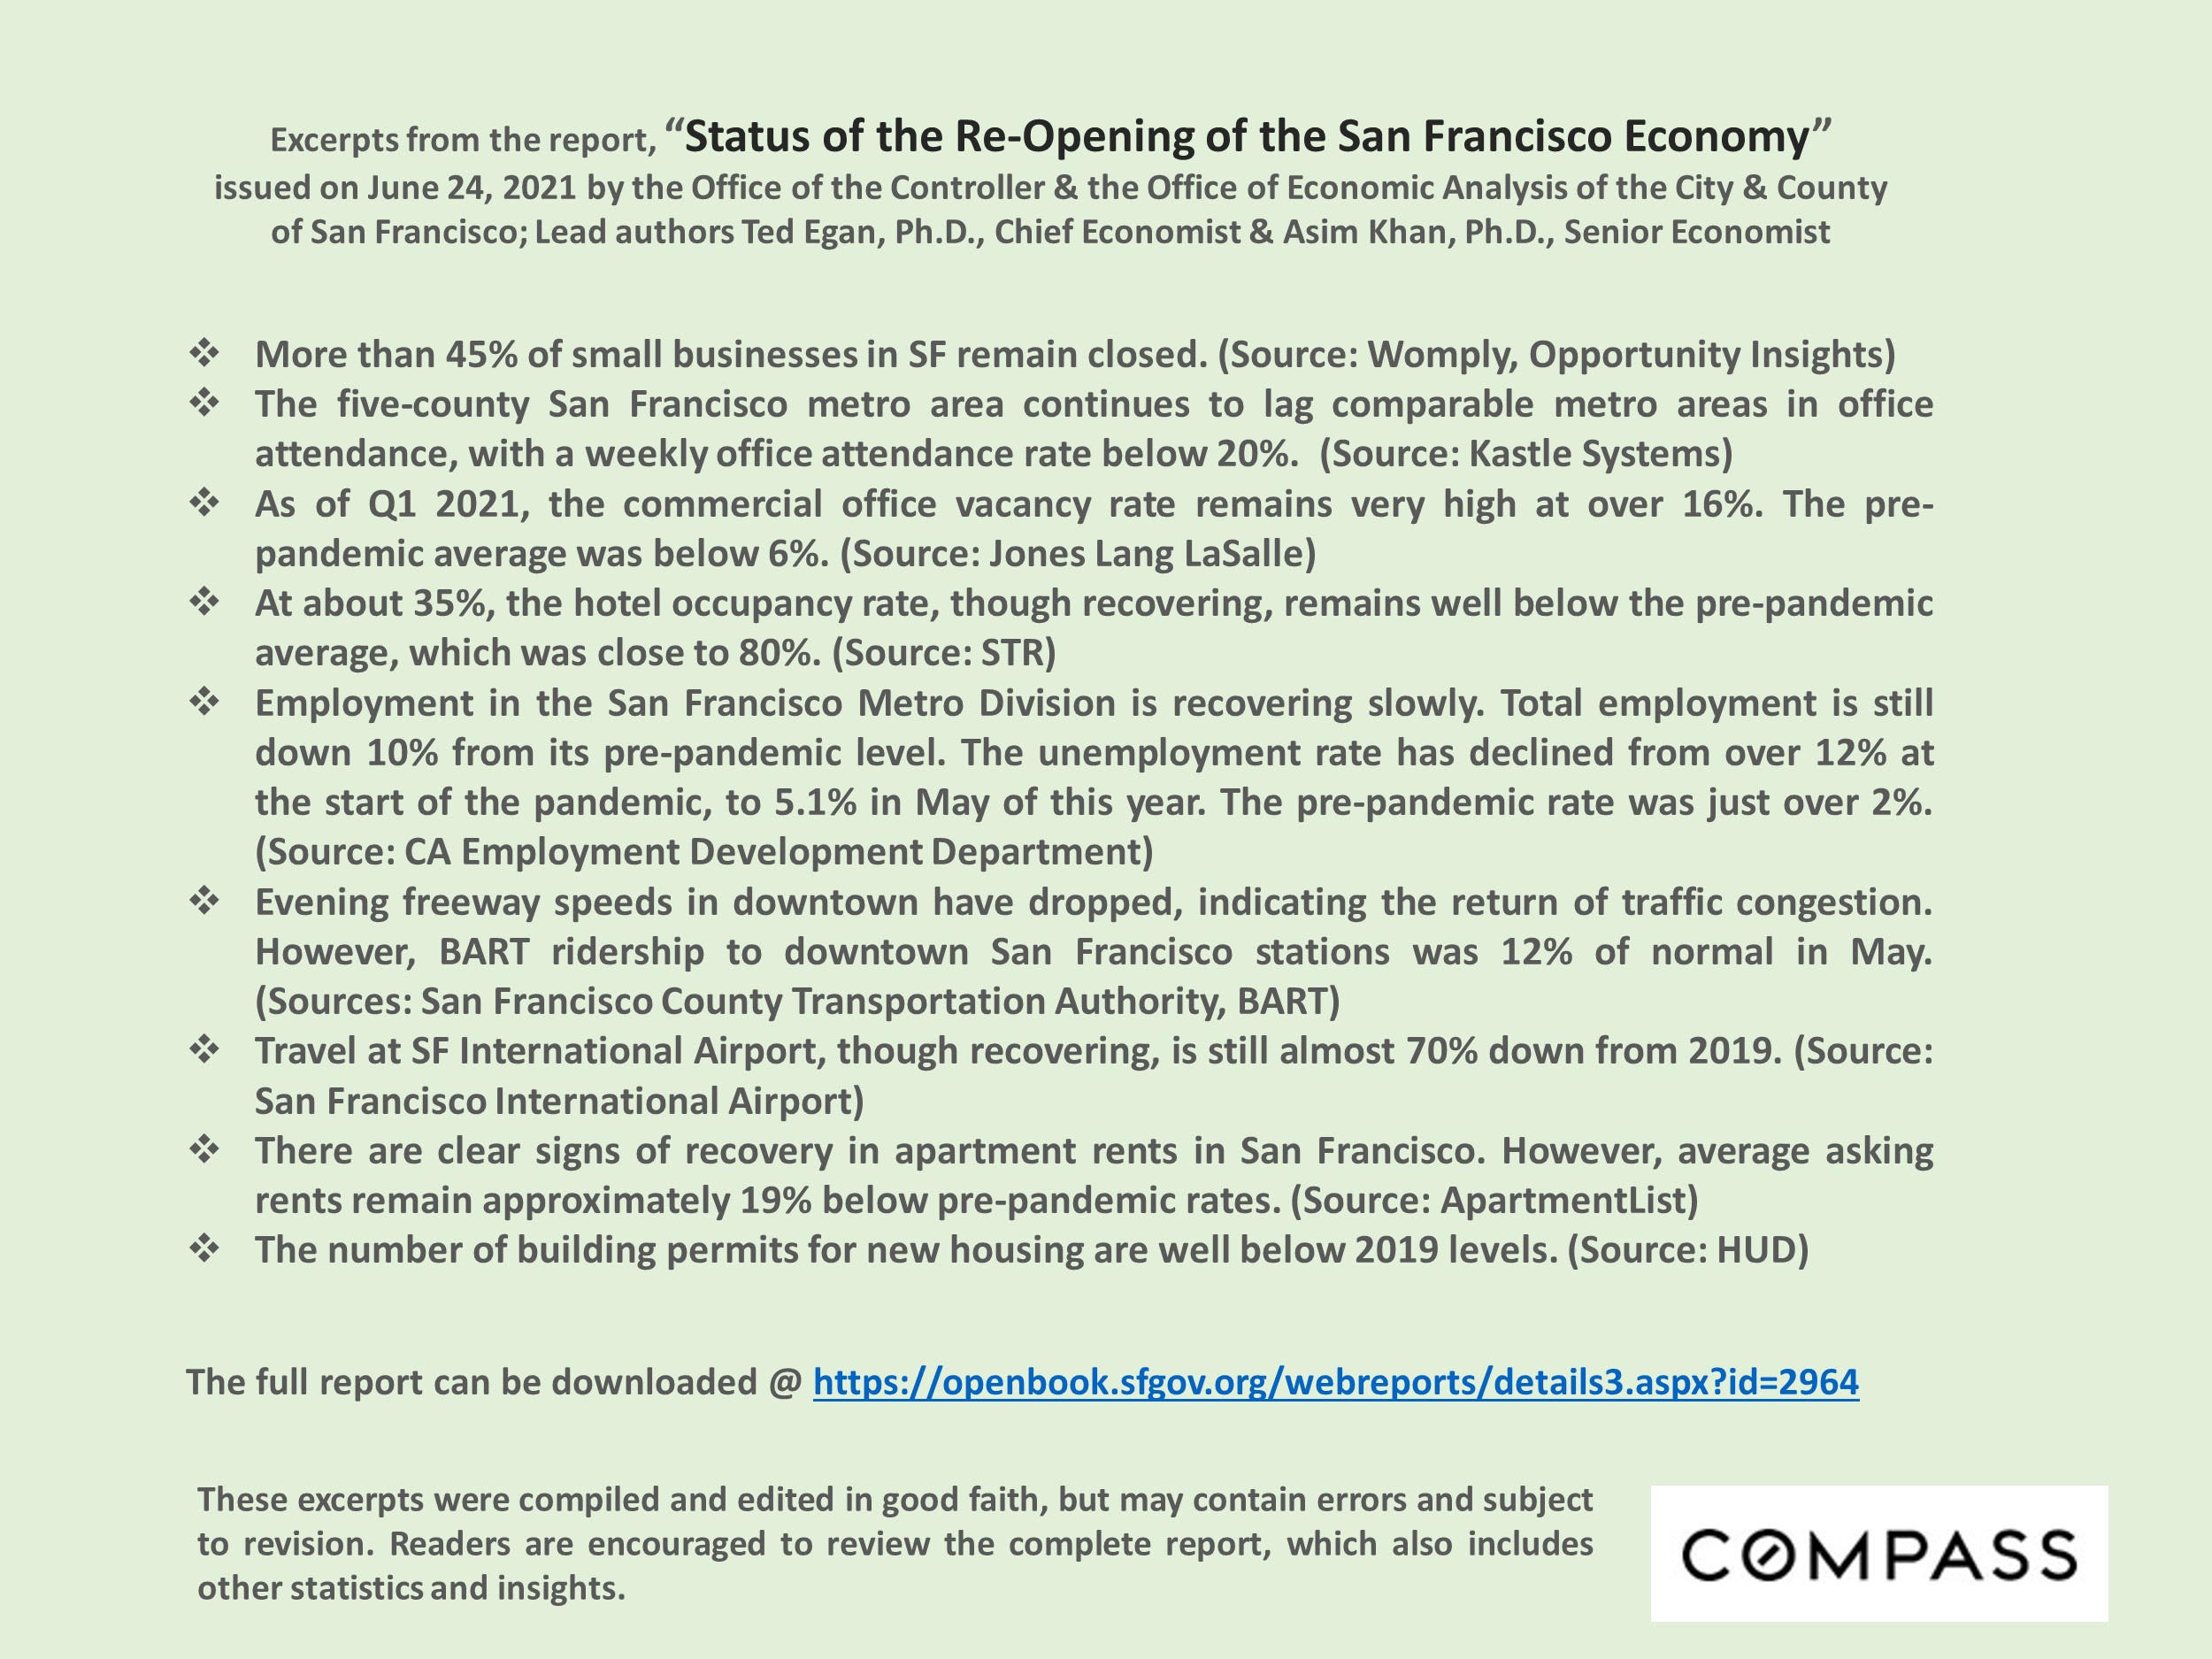
San Francisco economic reopening report excerpts summarize business, employment, travel, rental, and housing recovery indicators.
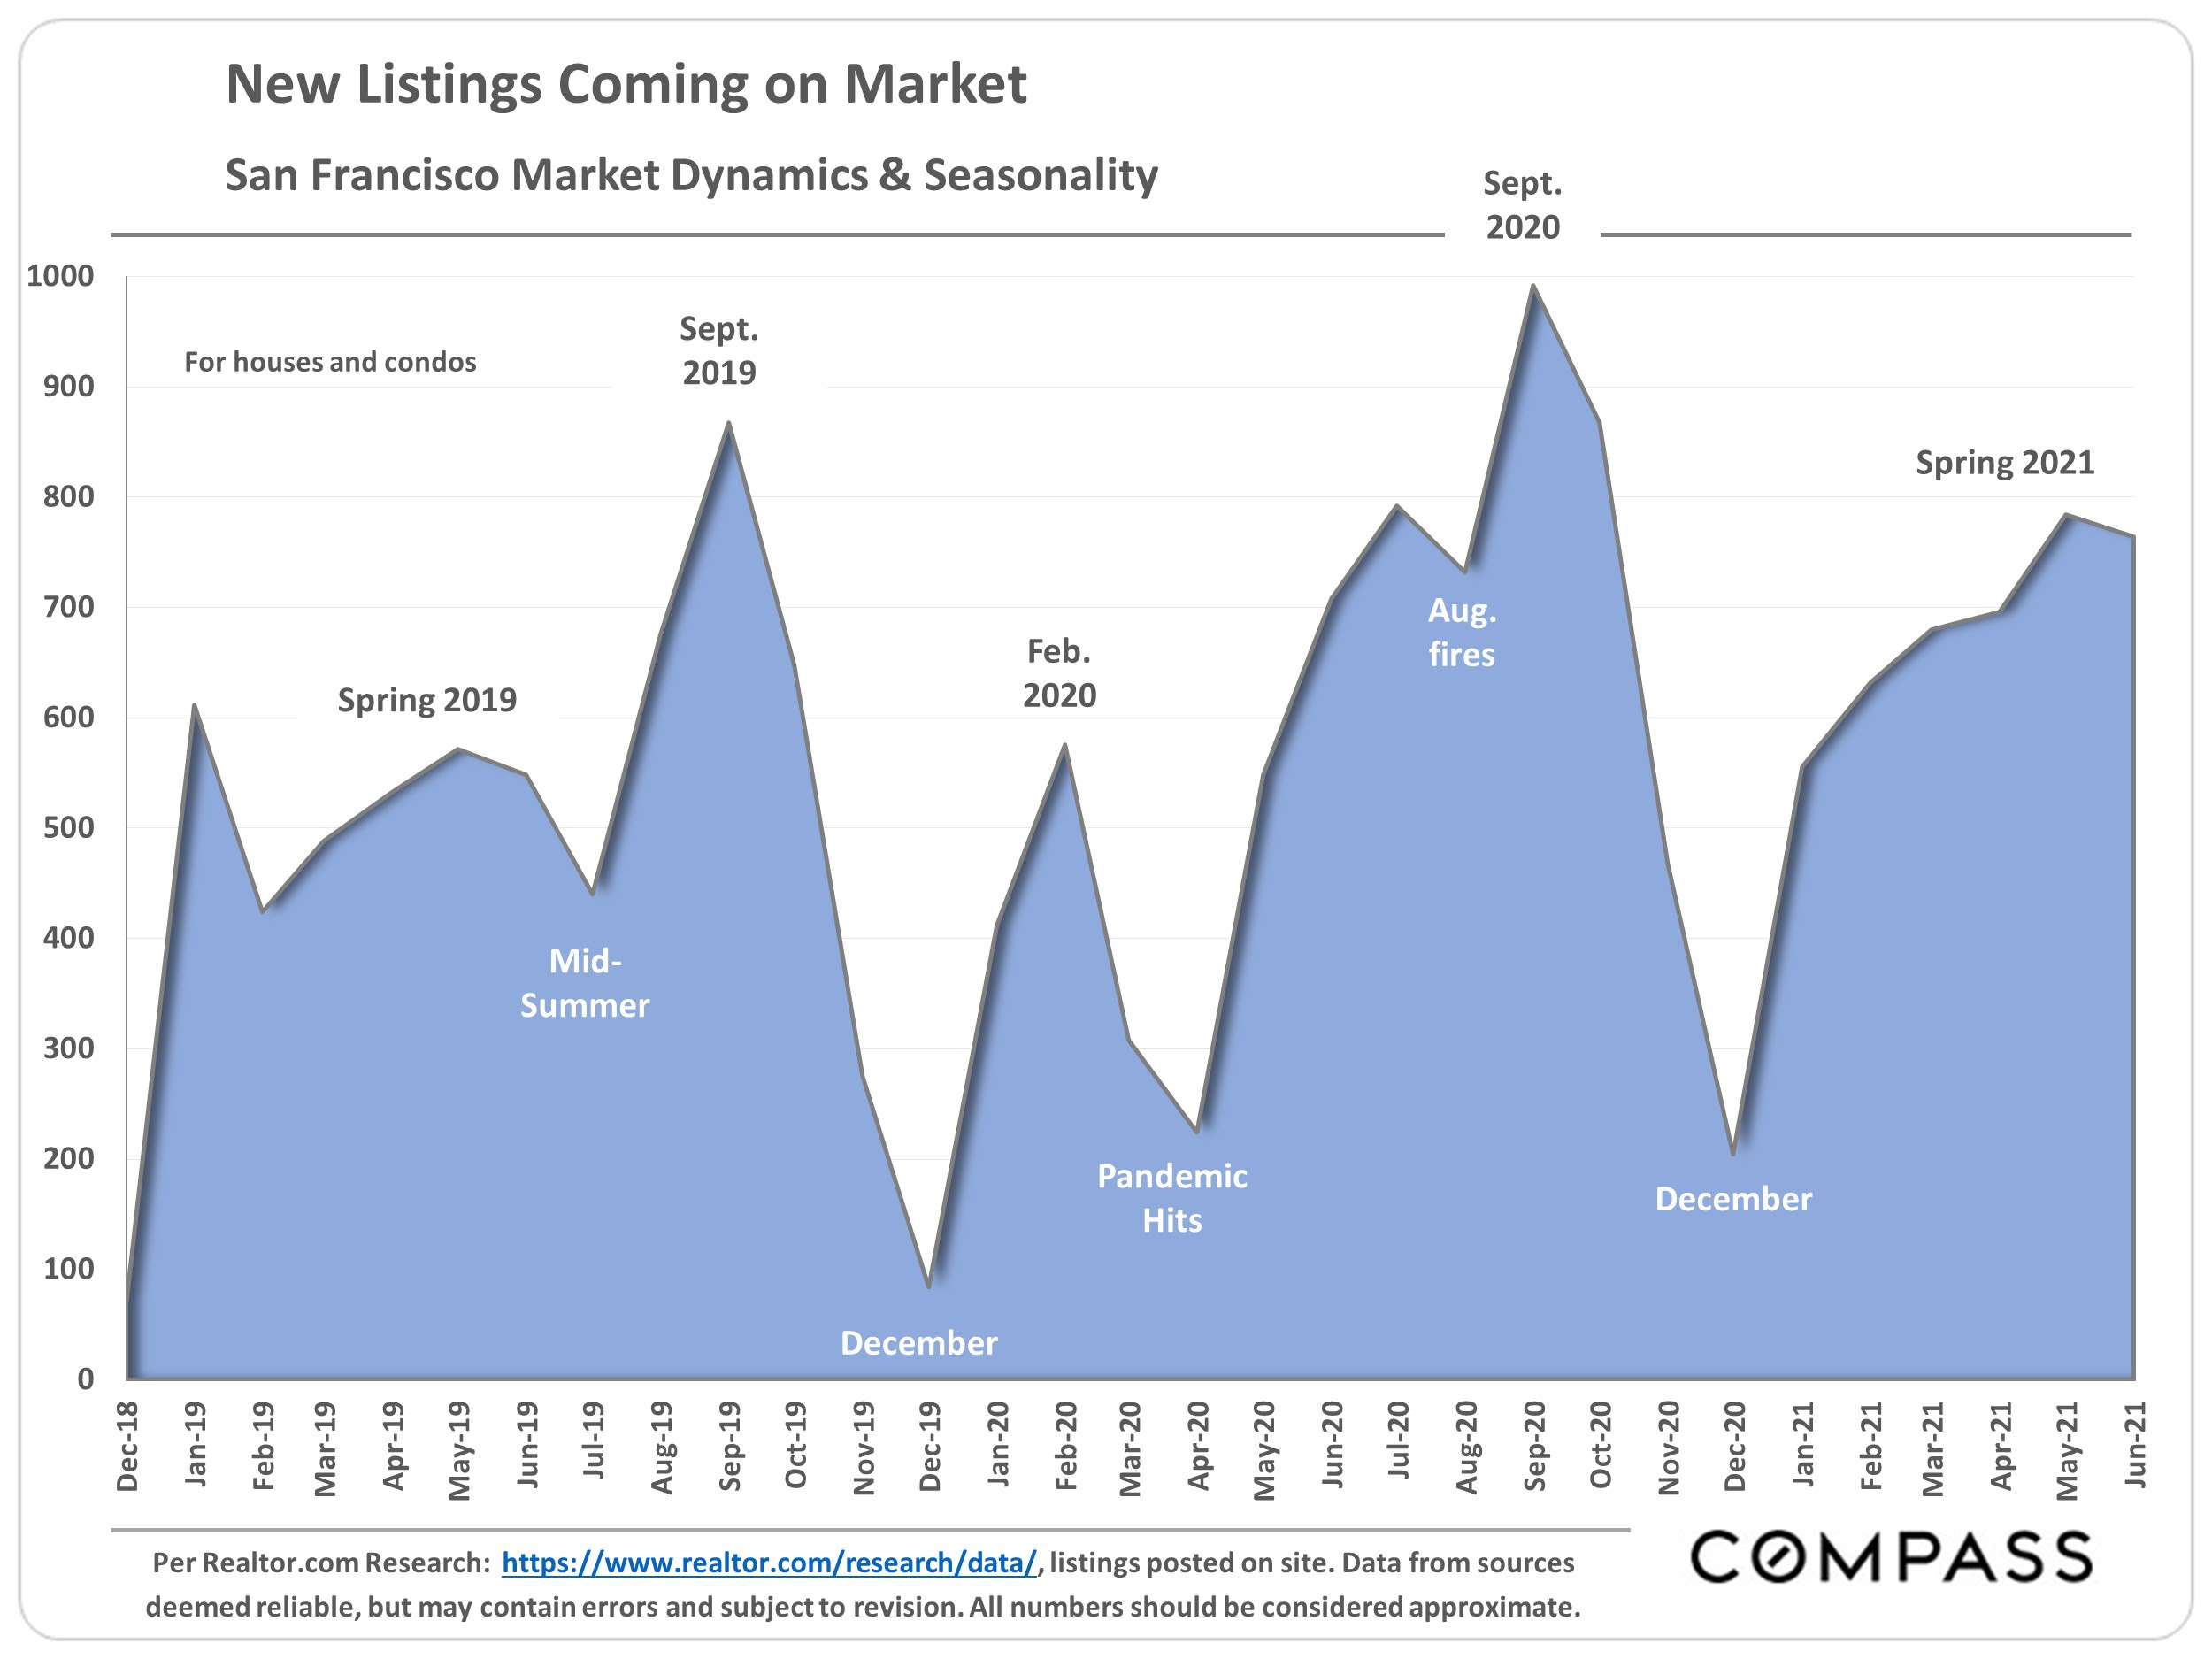
Chart of San Francisco monthly new listings, with seasonal peaks and dips from December 2018 to June 2021.
San Francisco active listings bar chart, January 2018–June 2021, peaking in October 2020.
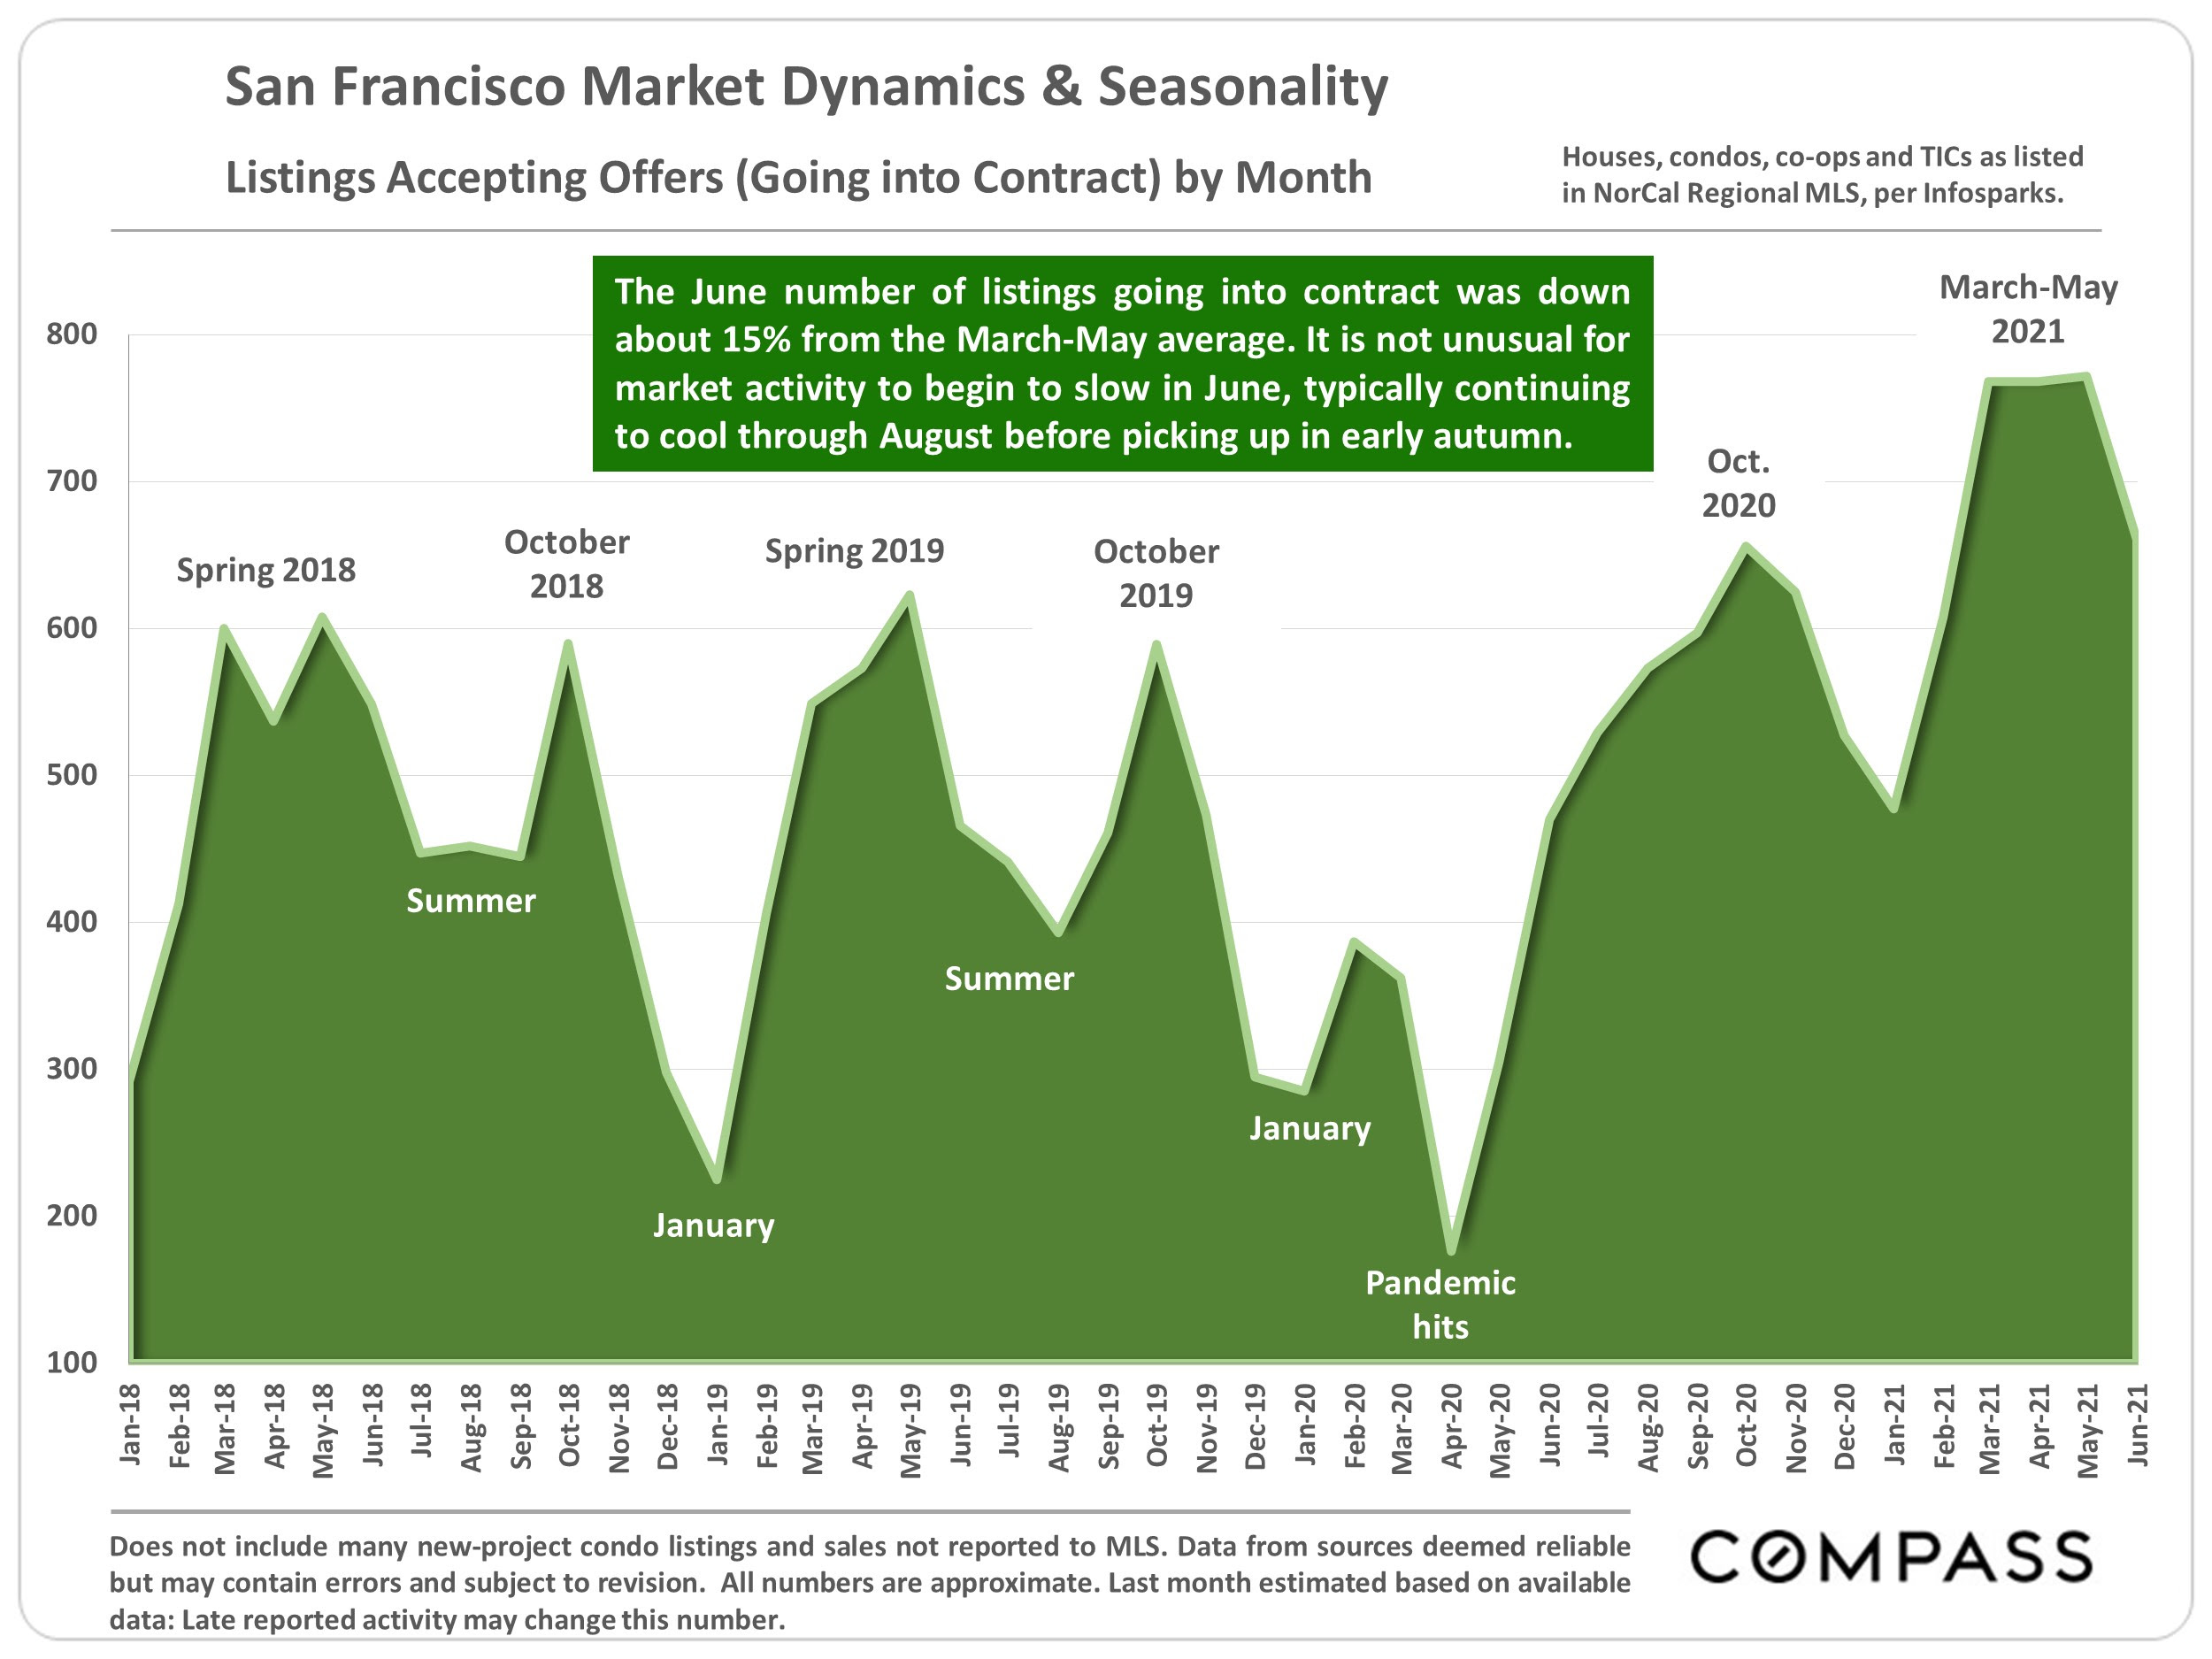
San Francisco monthly listings chart, showing seasonal fluctuations and a pandemic-related low in April 2020.
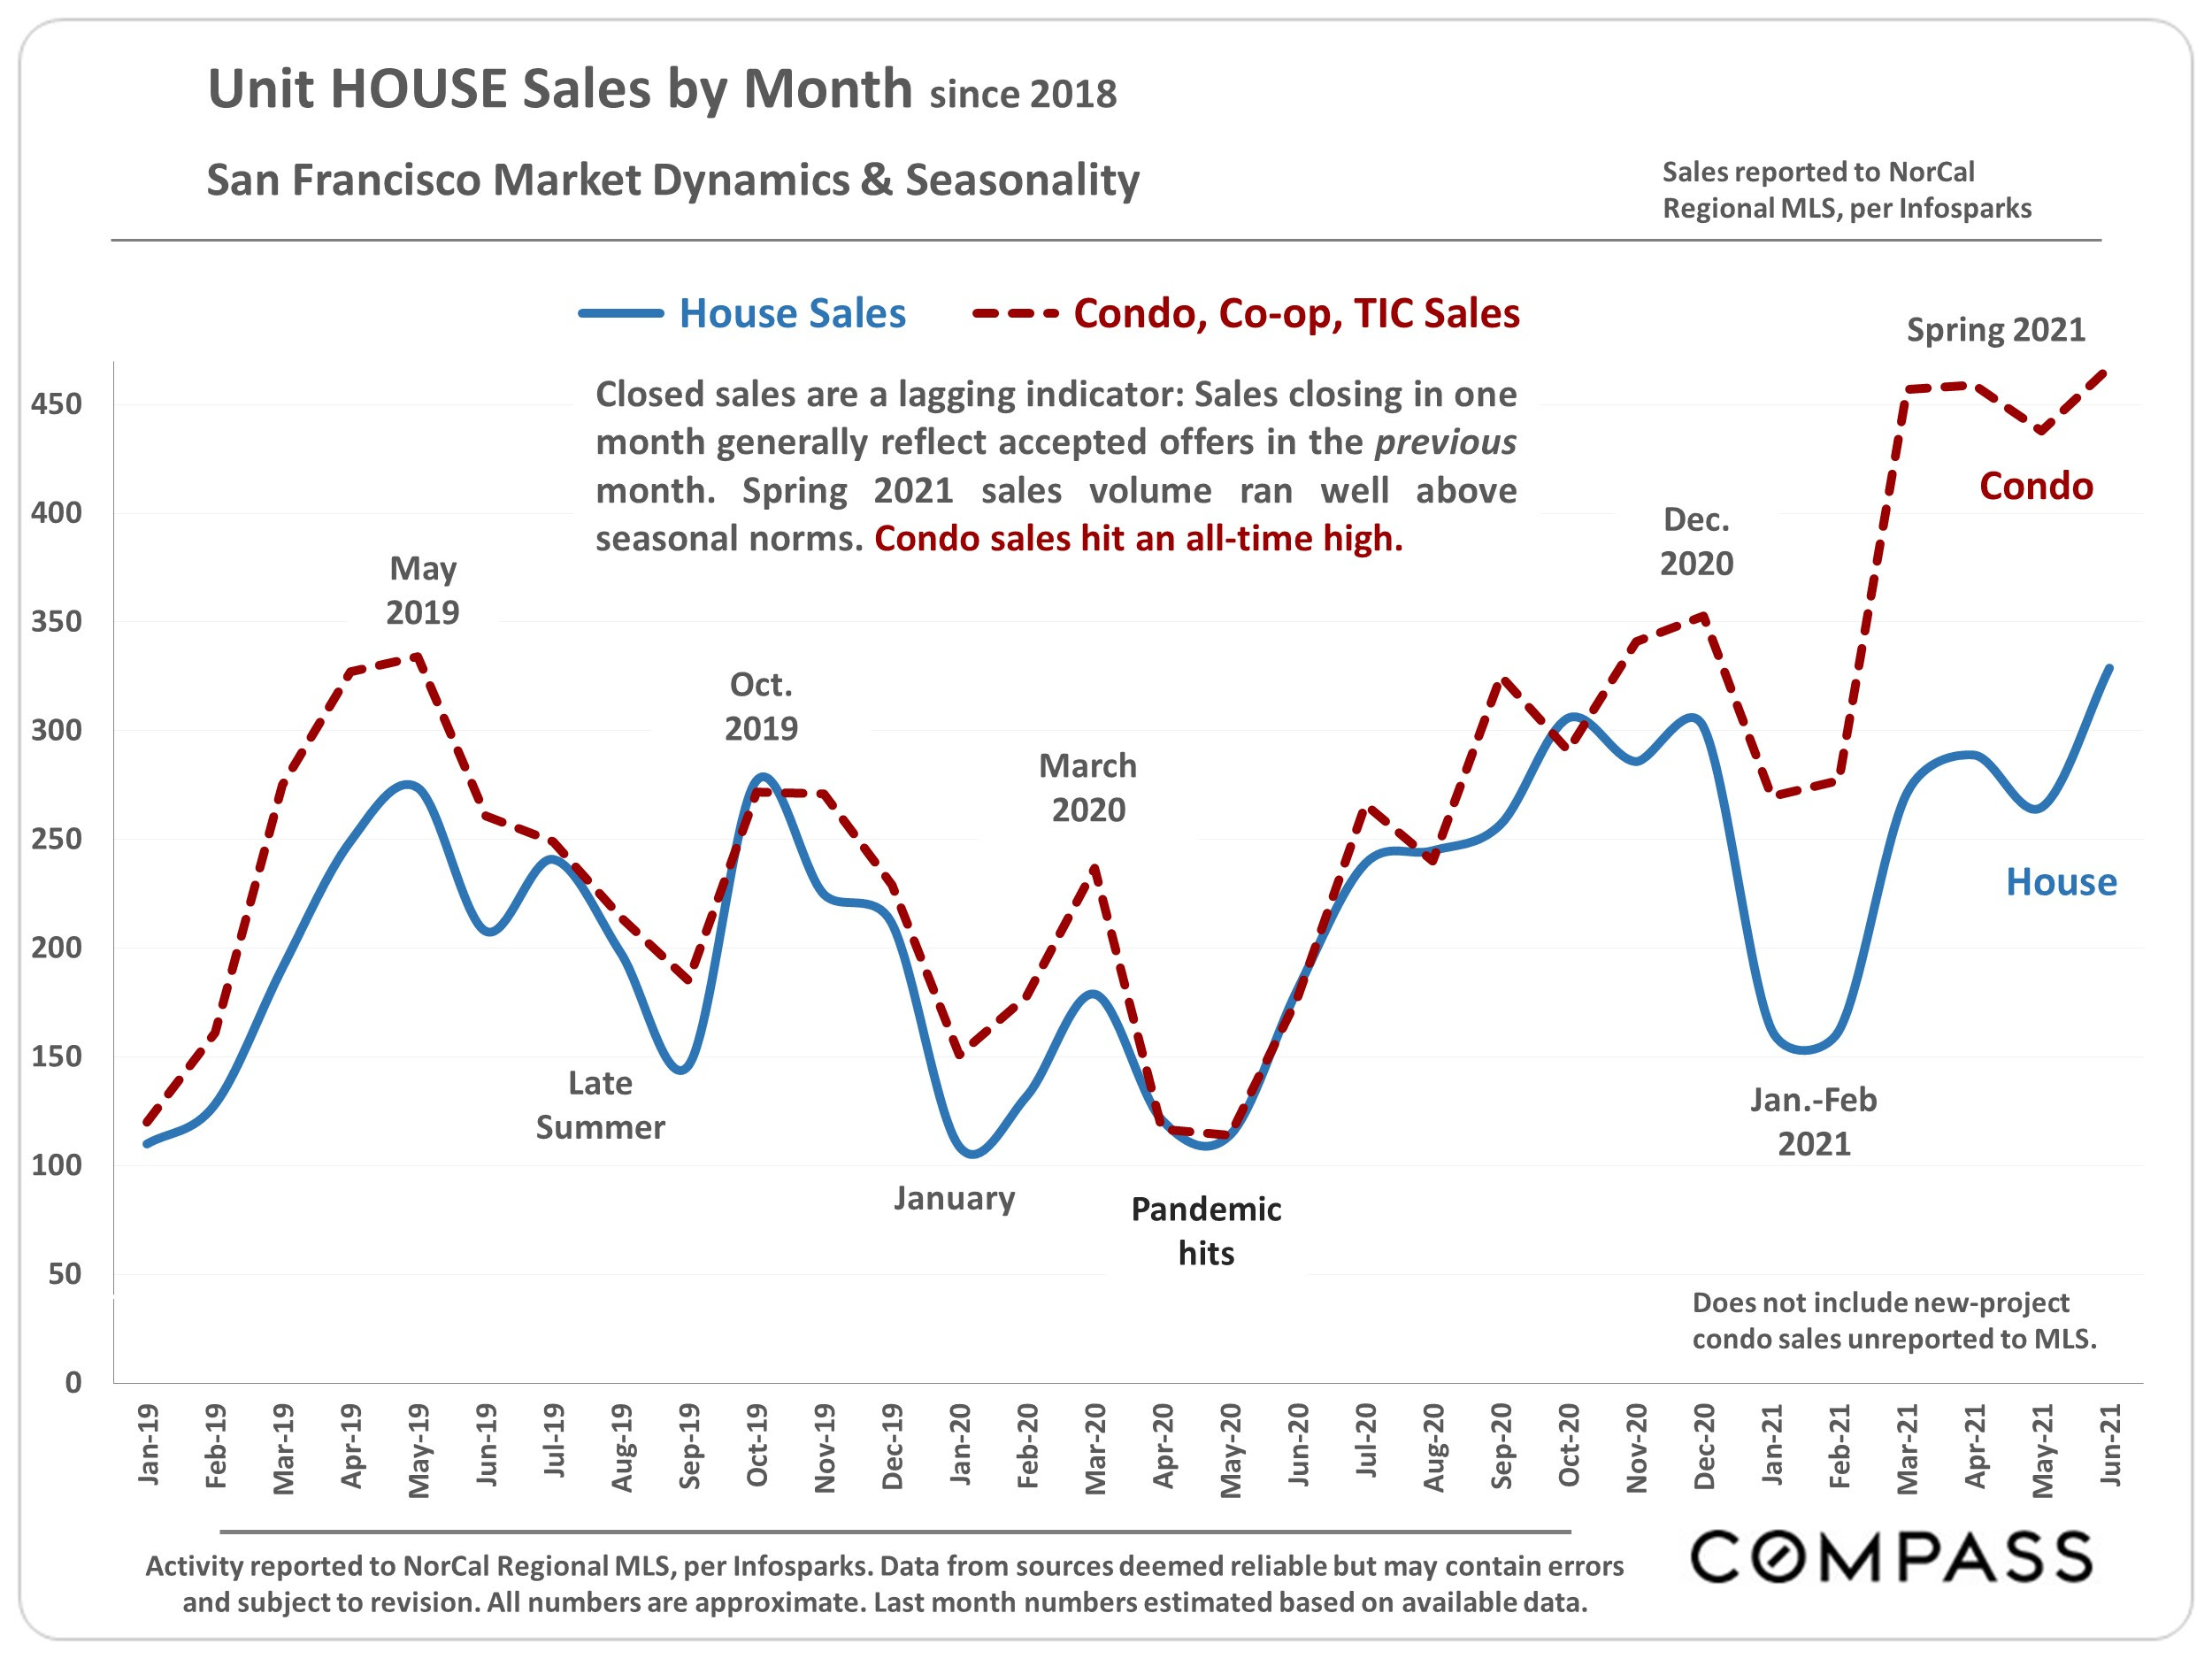
San Francisco monthly house and condo sales chart, showing record-high condo sales in spring 2021.
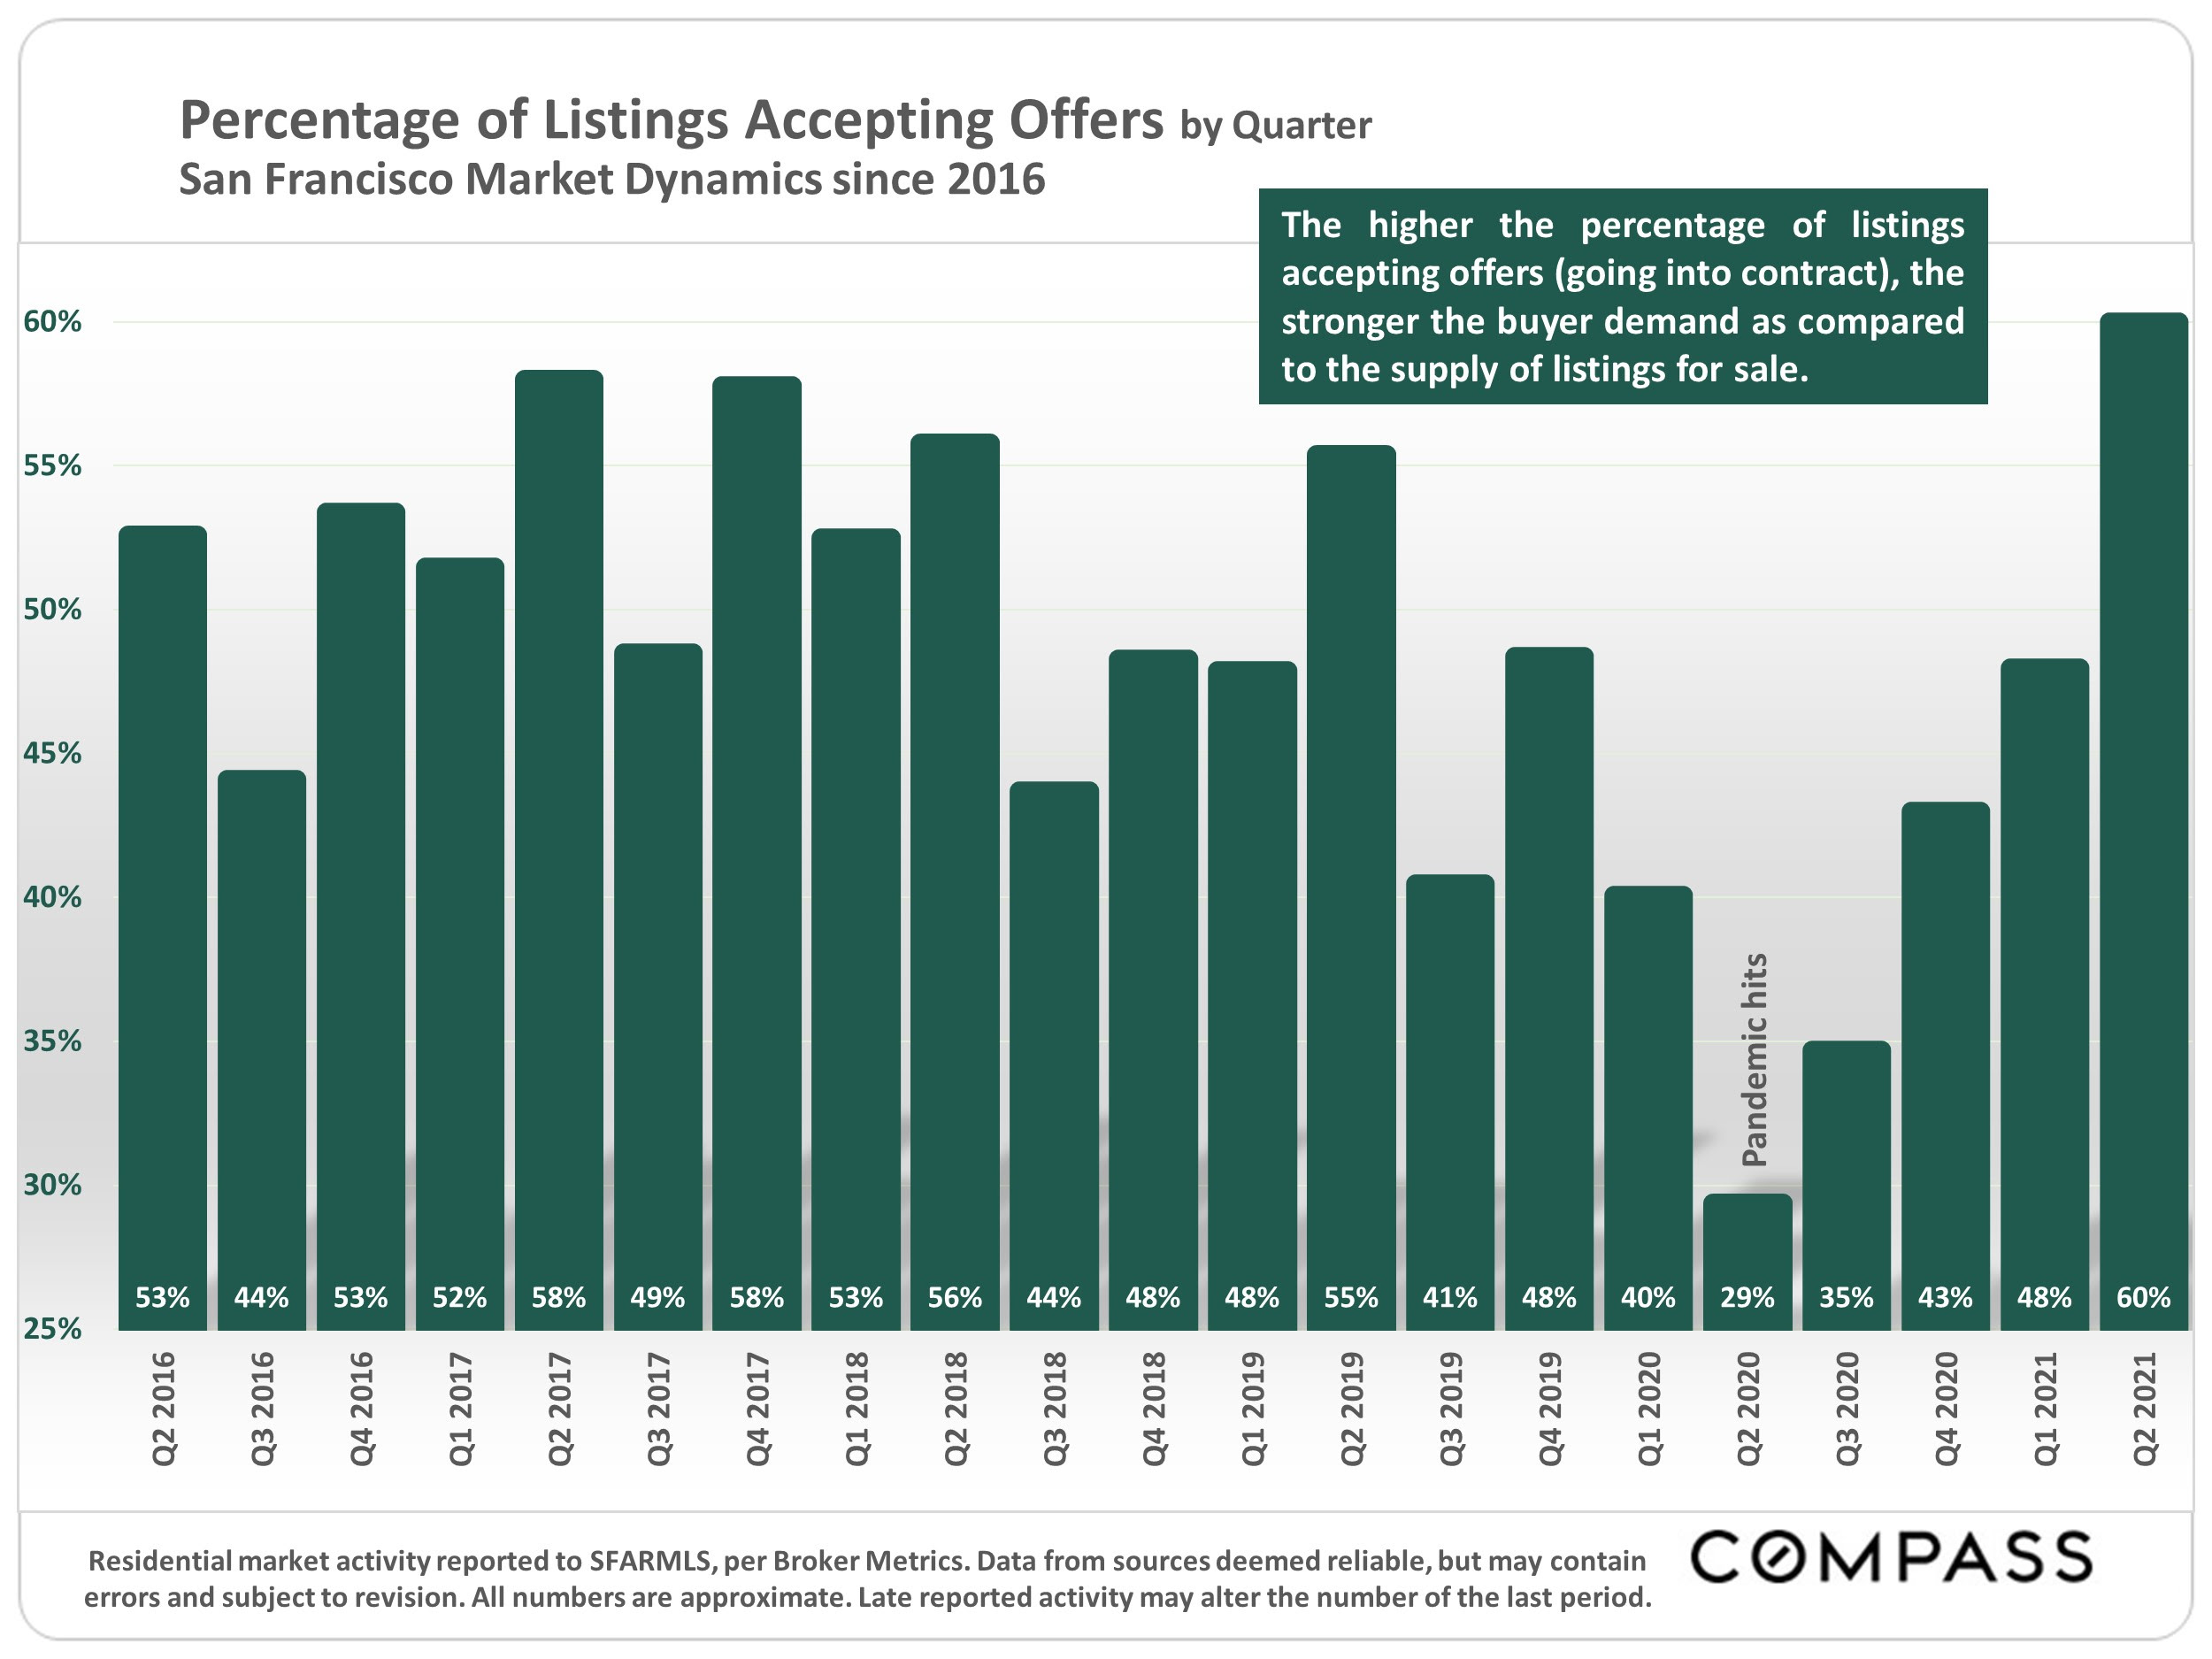
Chart of San Francisco listings accepting offers by quarter, from 2016 to 2021, with a pandemic-era dip and recovery.
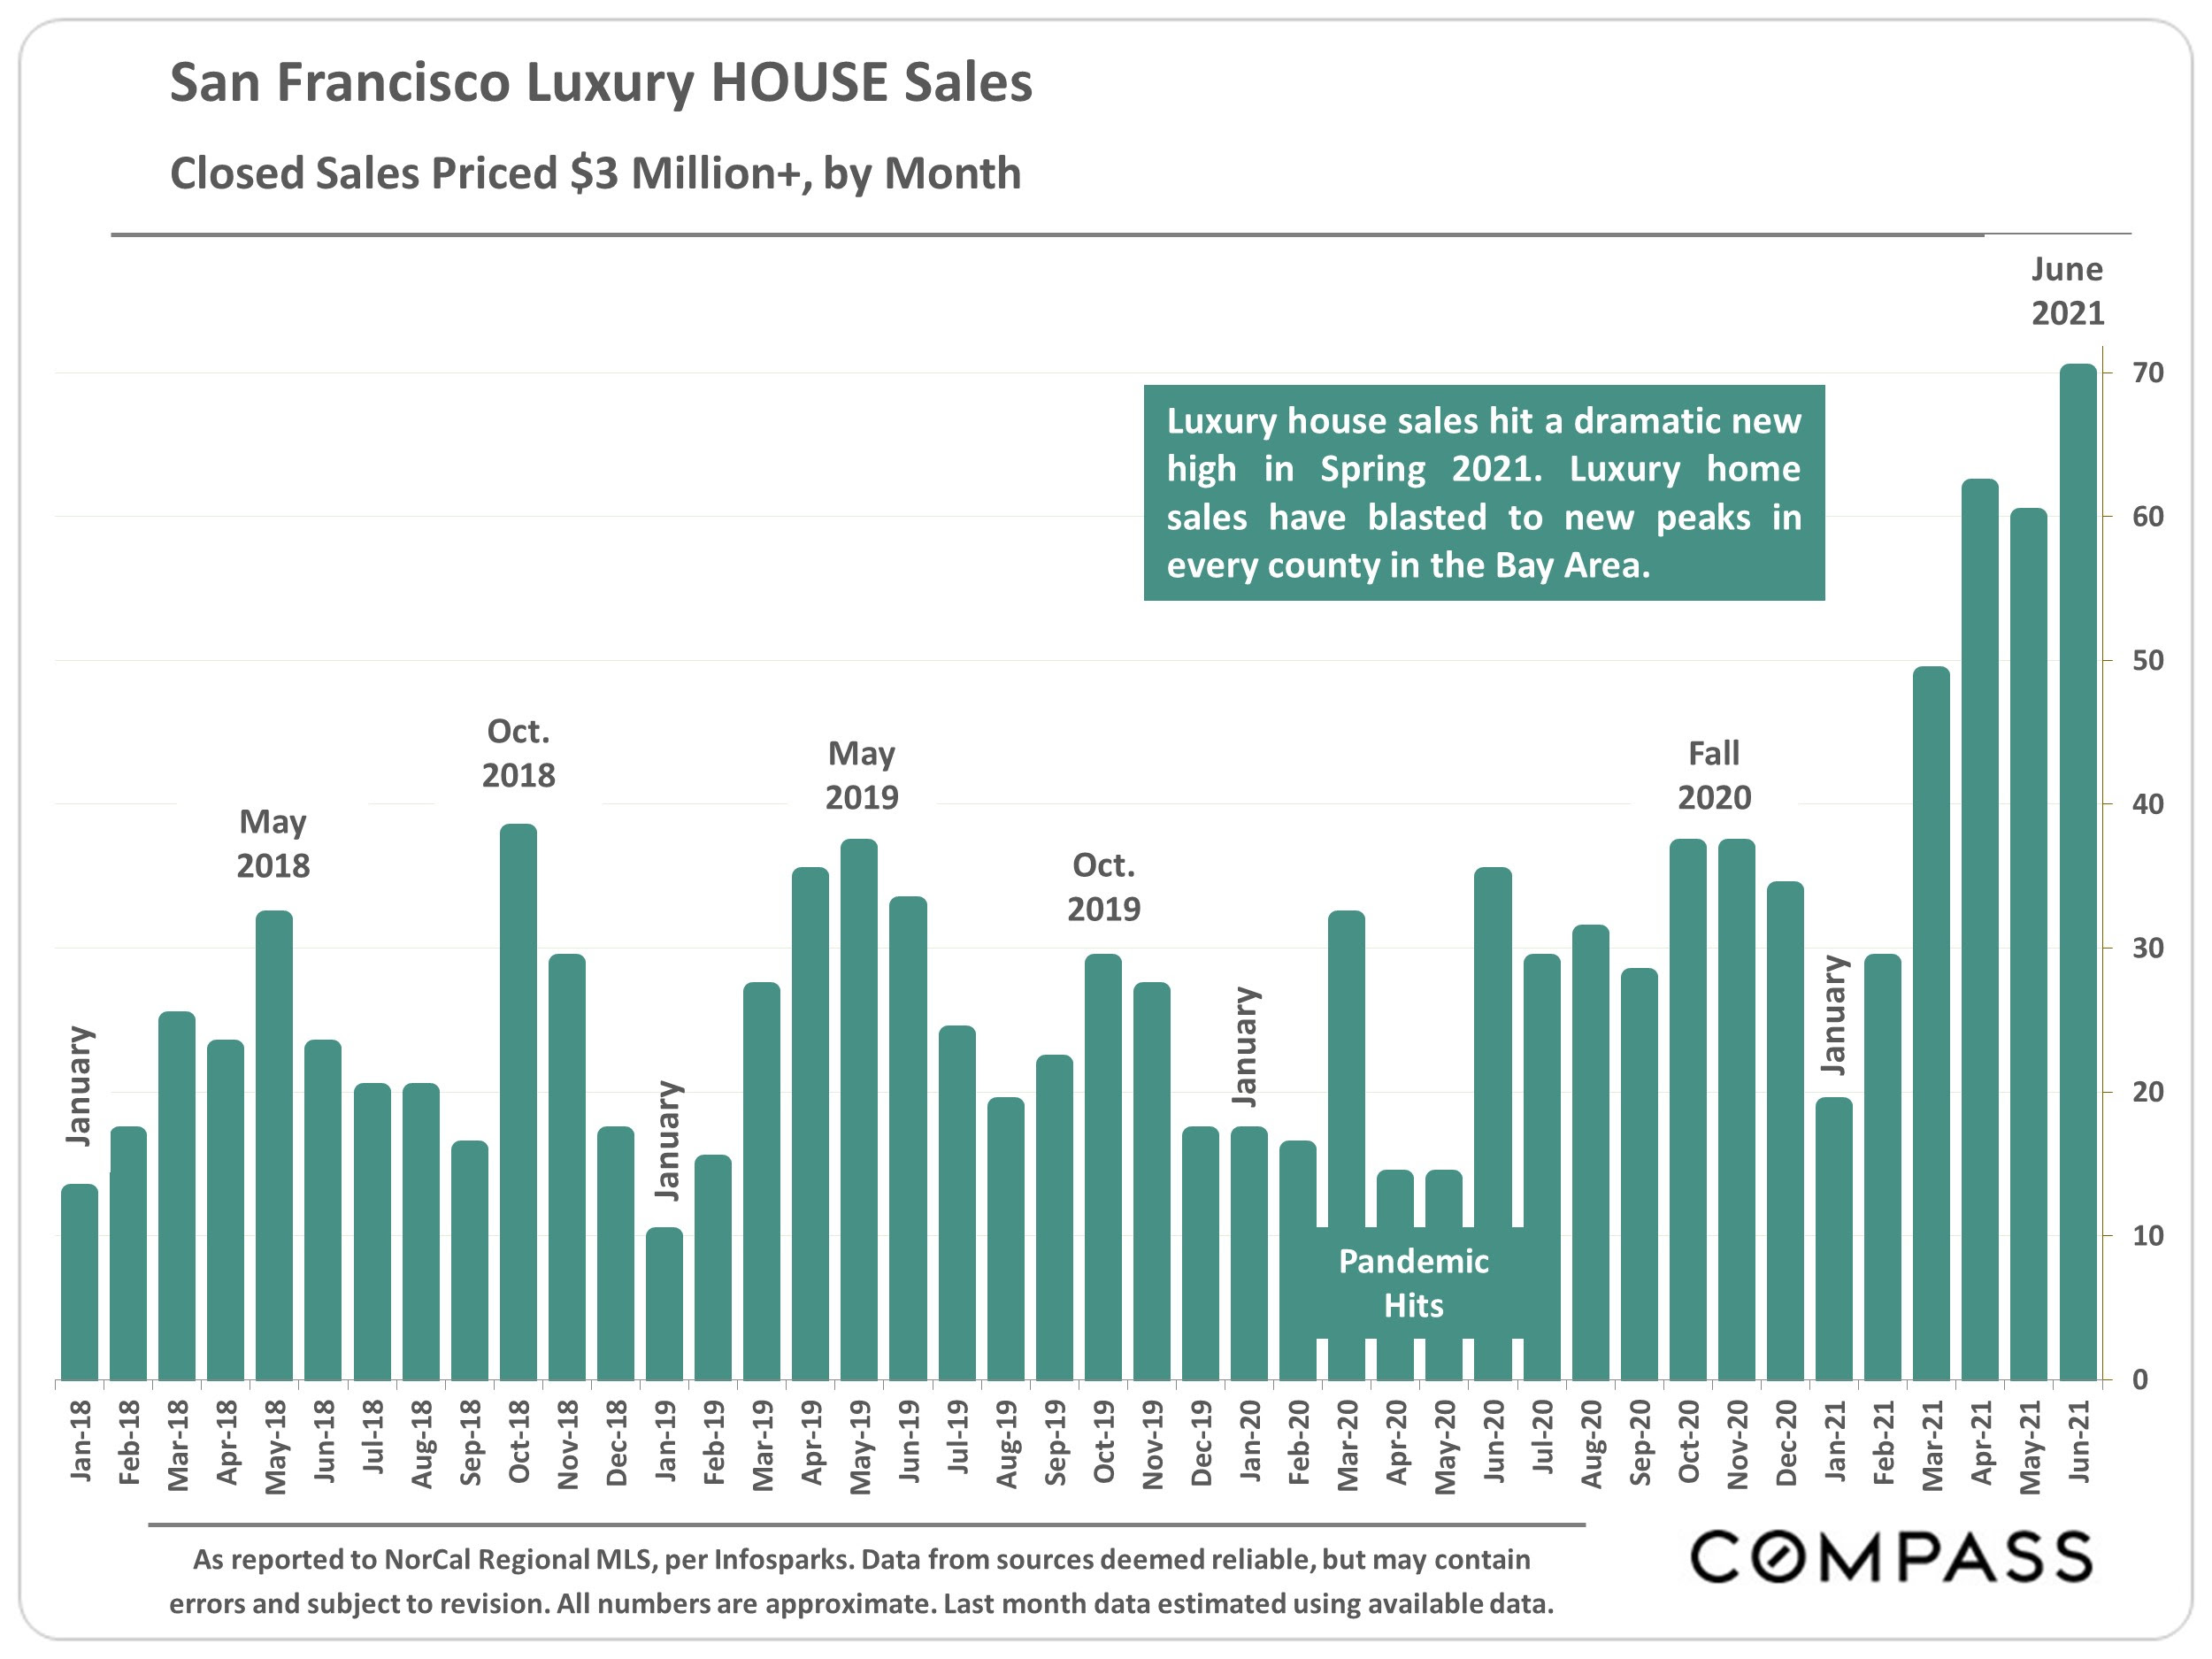
Bar chart of San Francisco $3 million-plus home sales by month, rising to a high in June 2021.
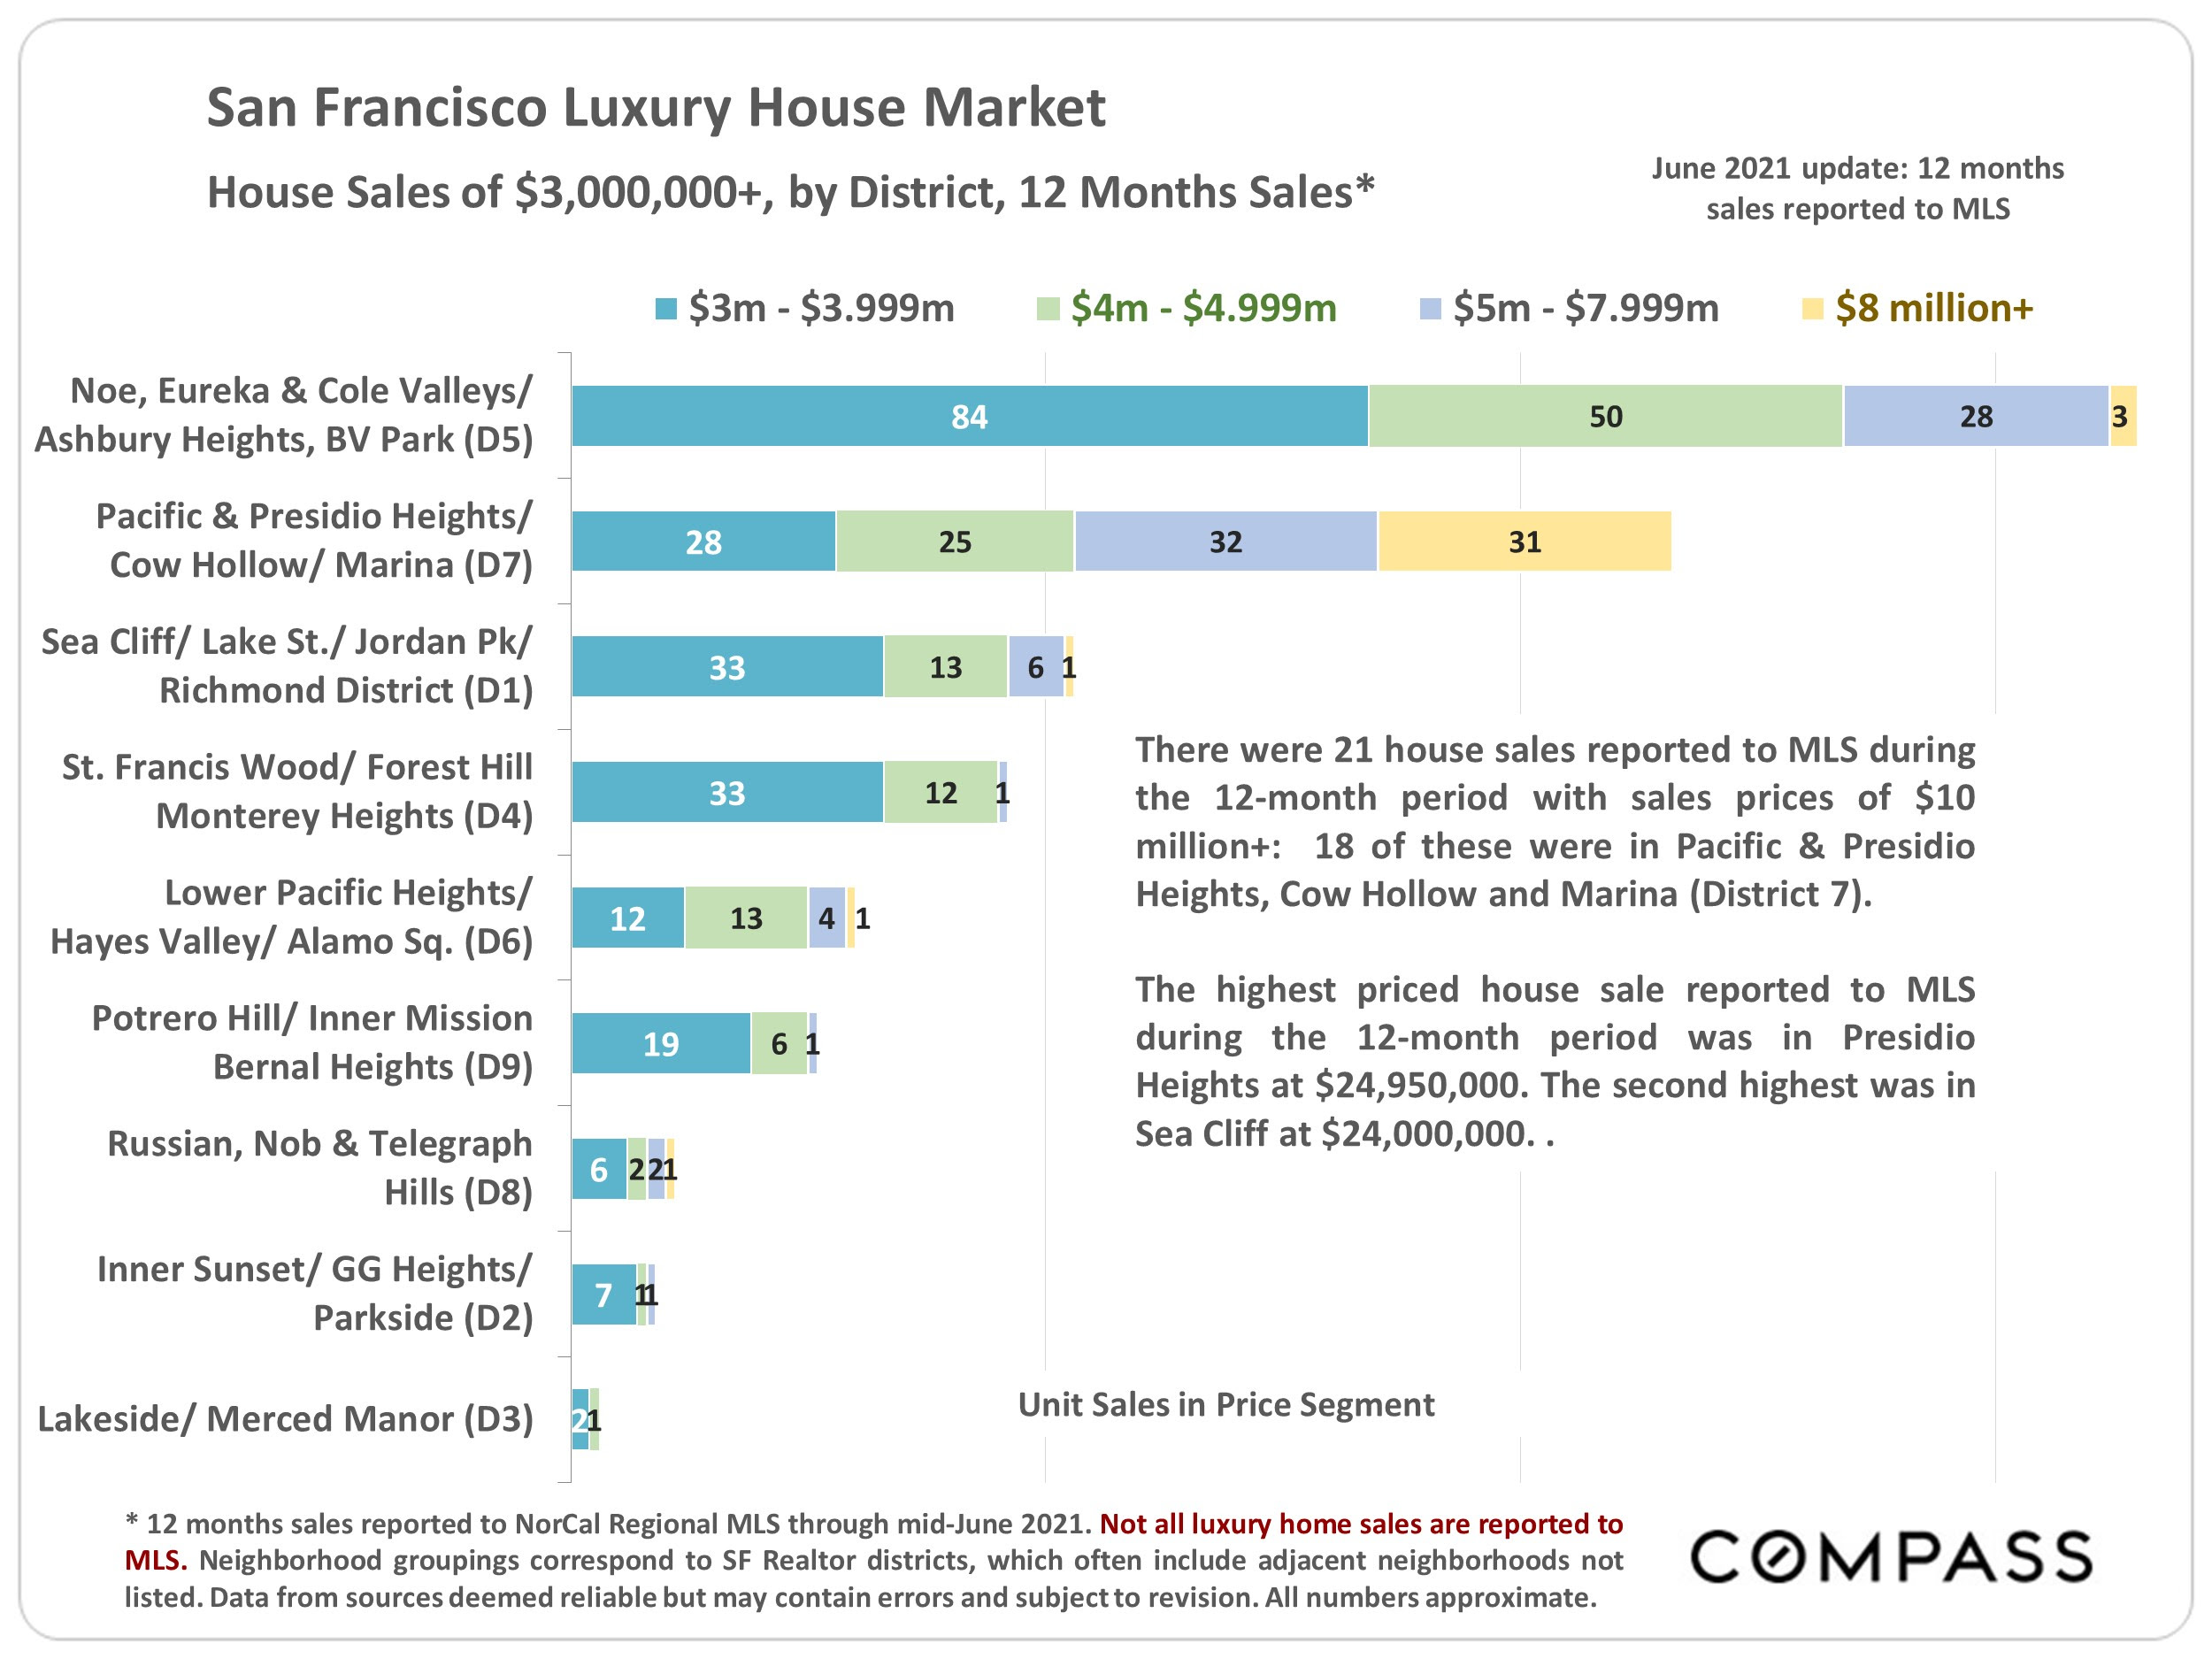
Chart of luxury house sales by San Francisco district and price segment, with notes on $10 million-plus sales.
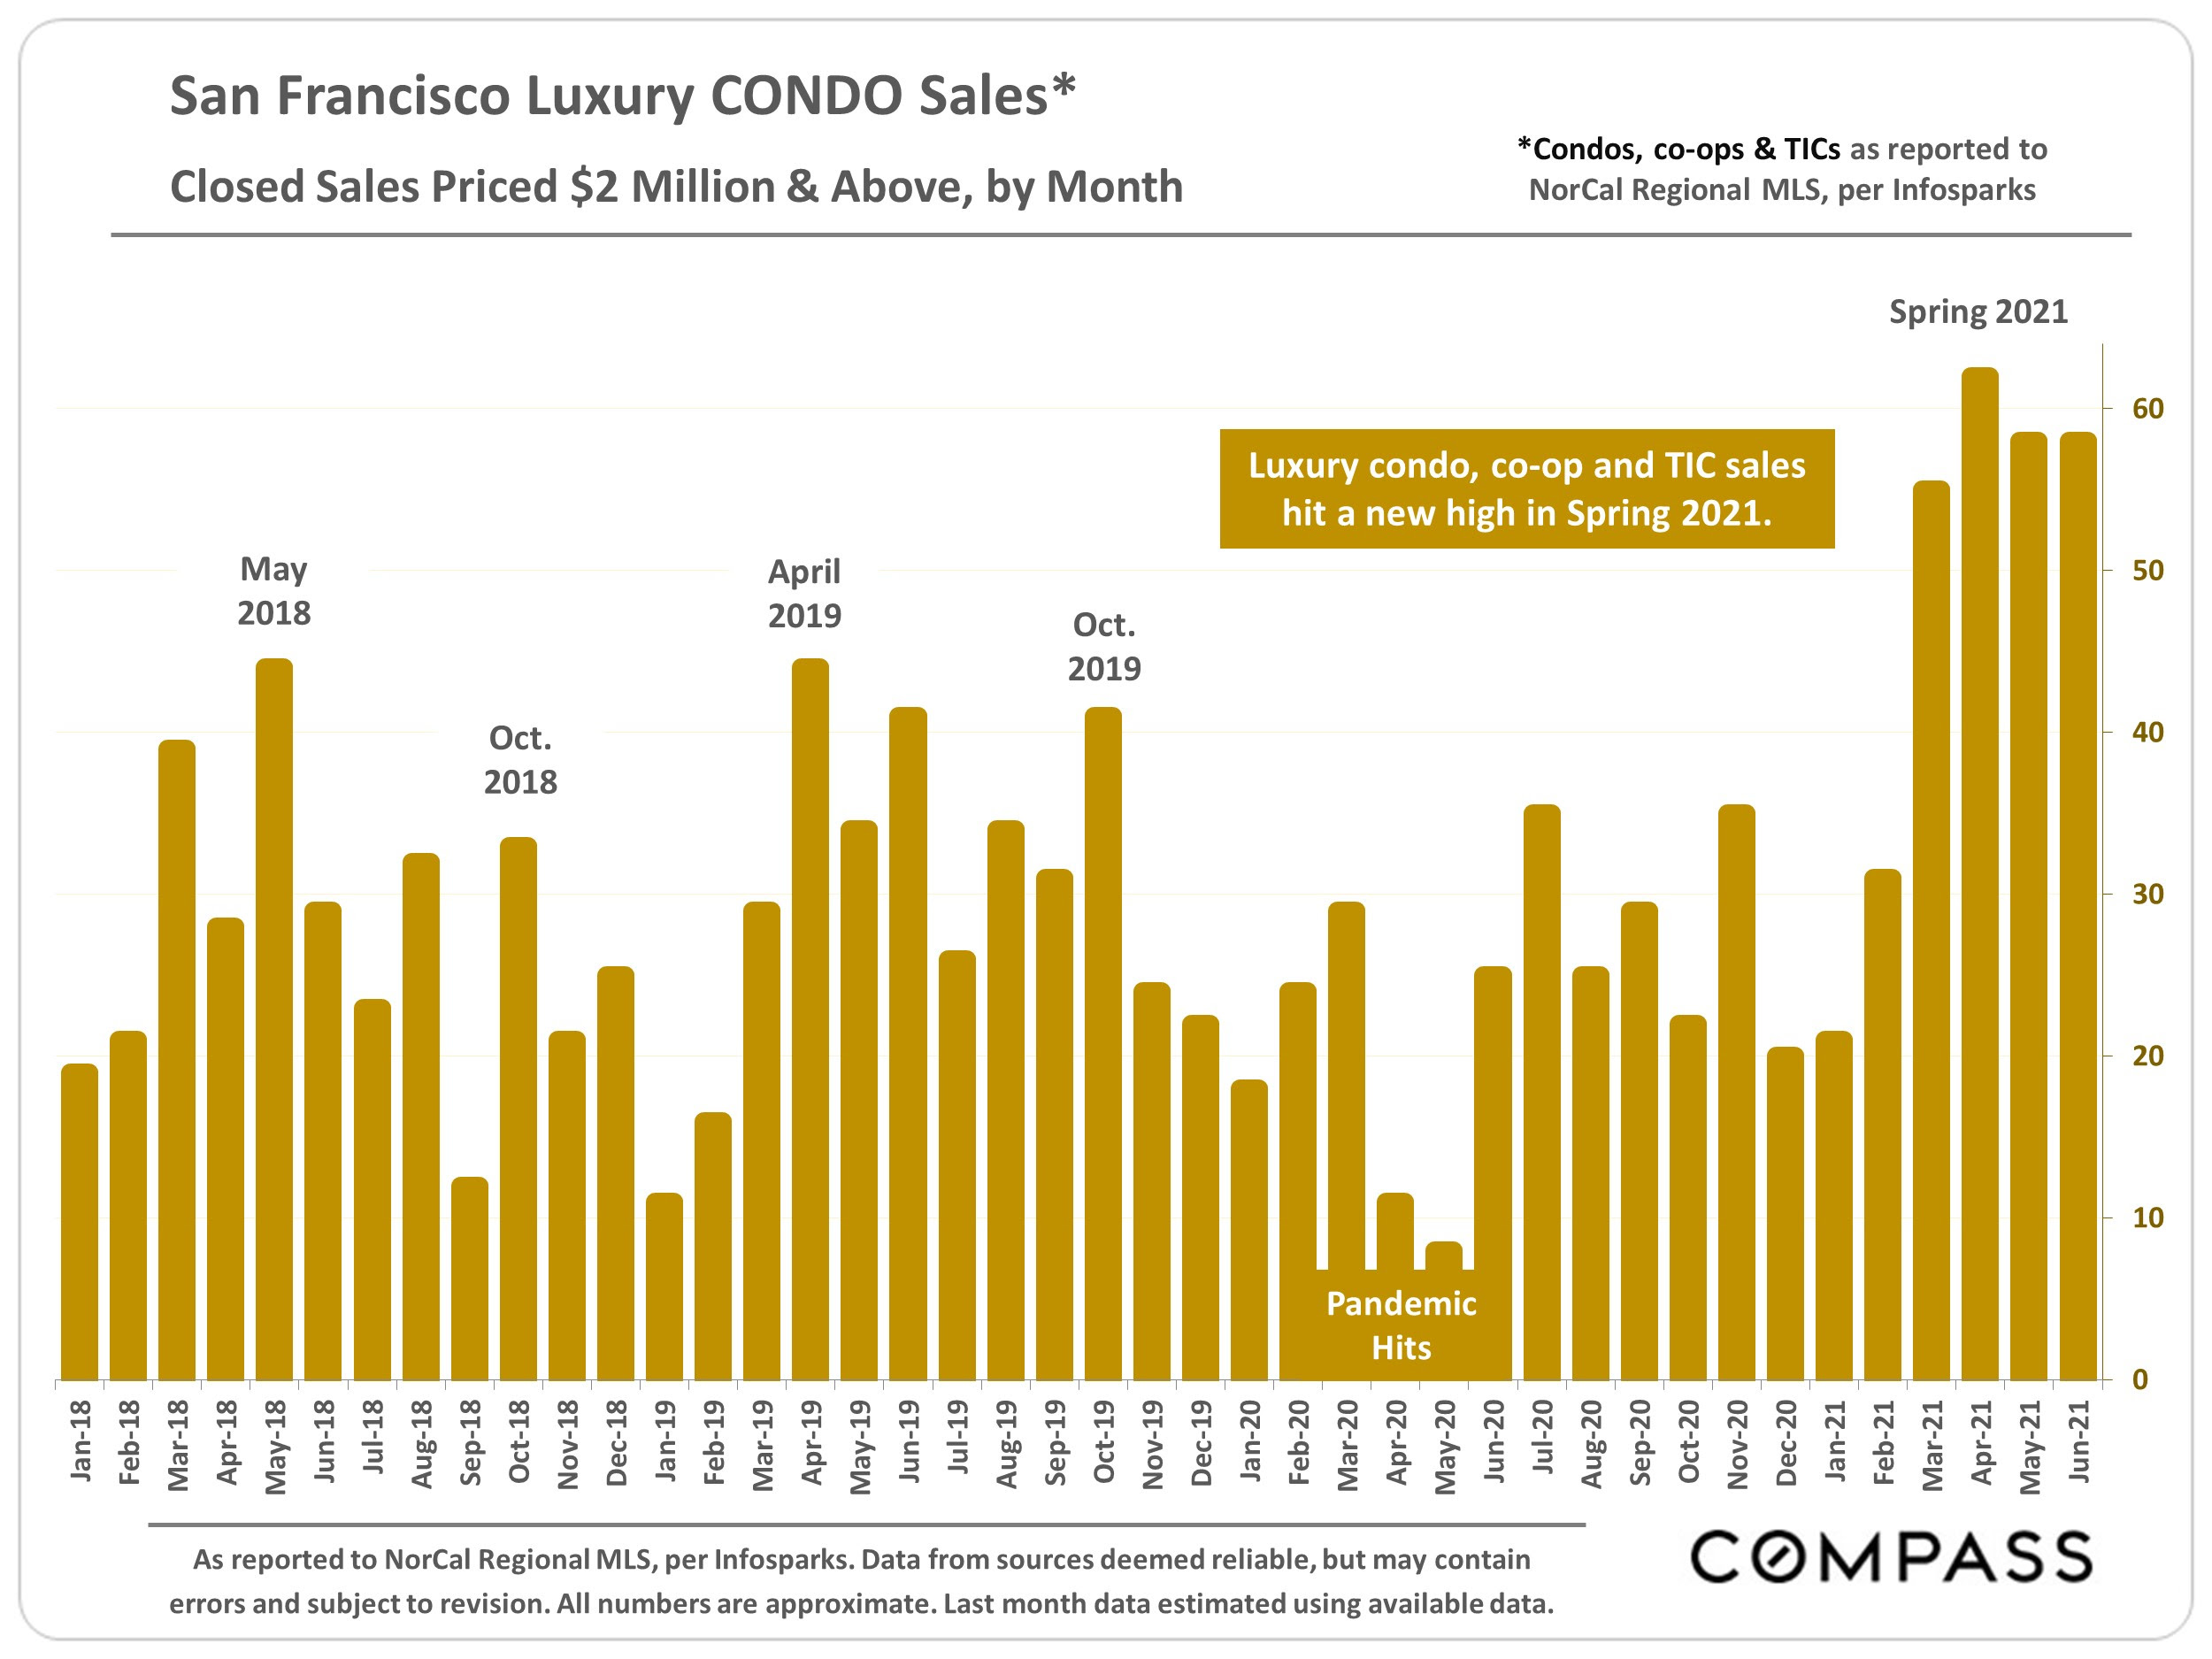
Bar chart of San Francisco luxury condo sales, with a record high in spring 2021 and a pandemic dip in 2020.
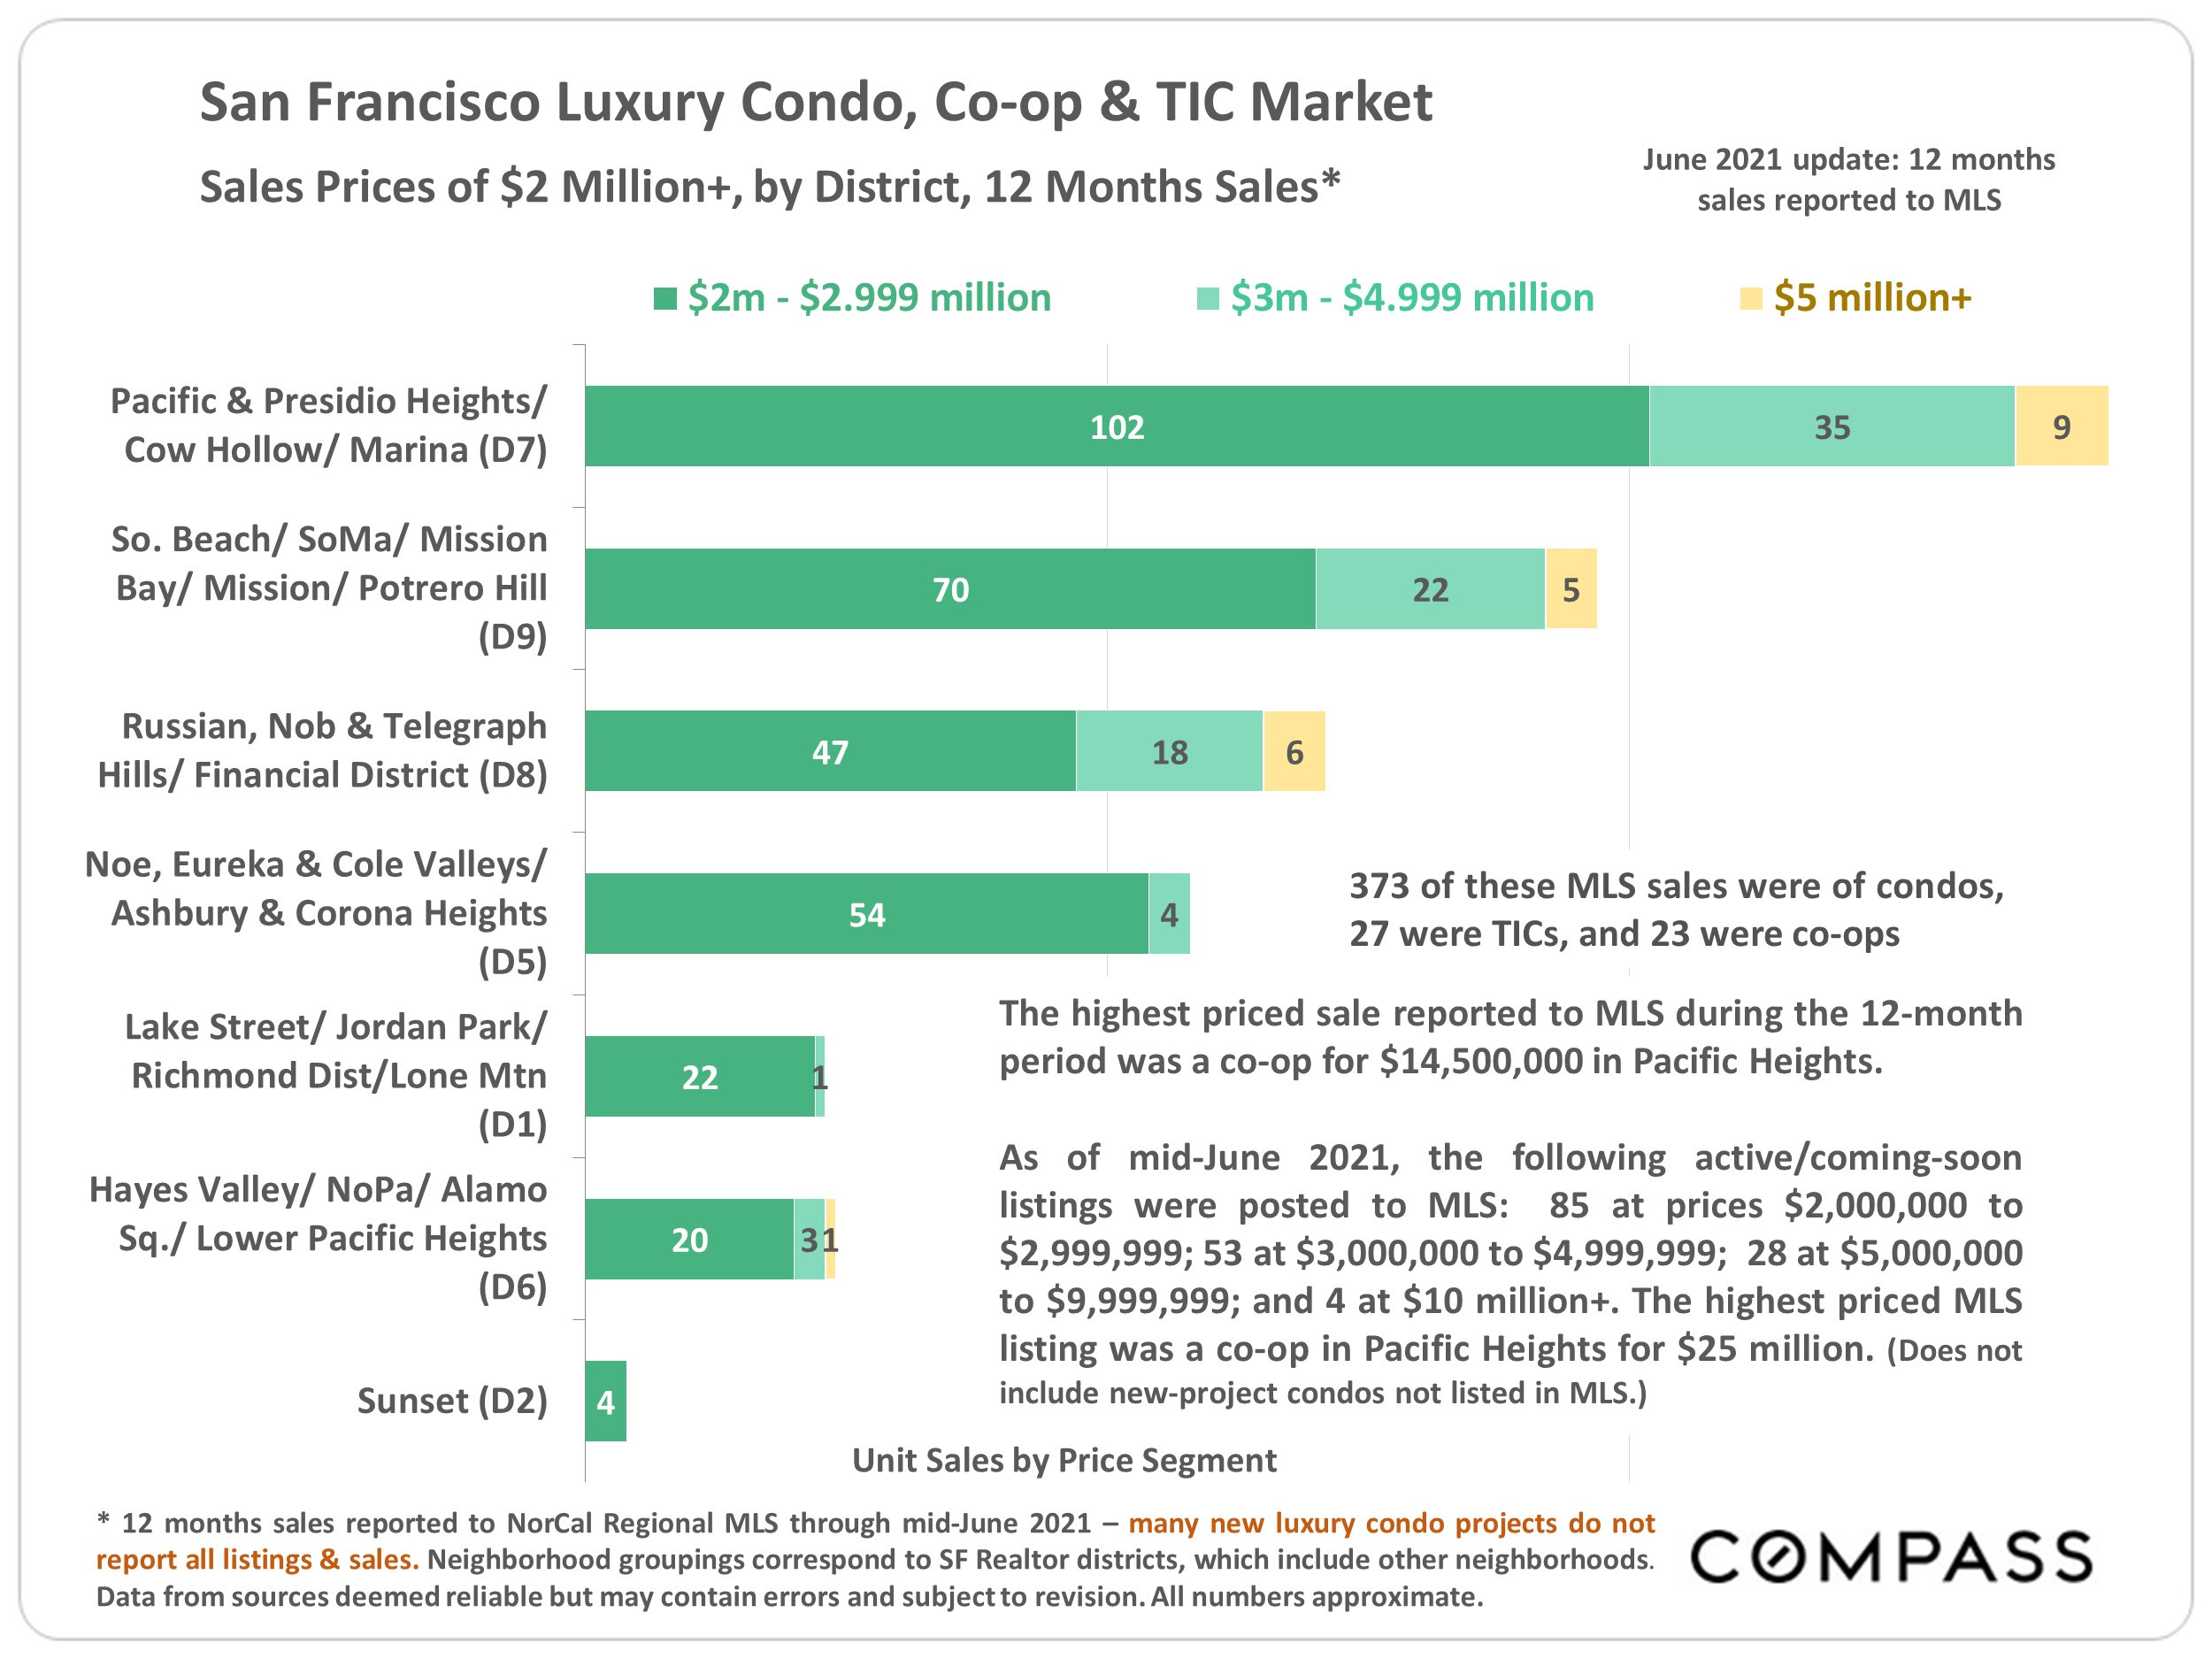
Chart of San Francisco luxury home sales by district and price segment, with Pacific Heights leading.
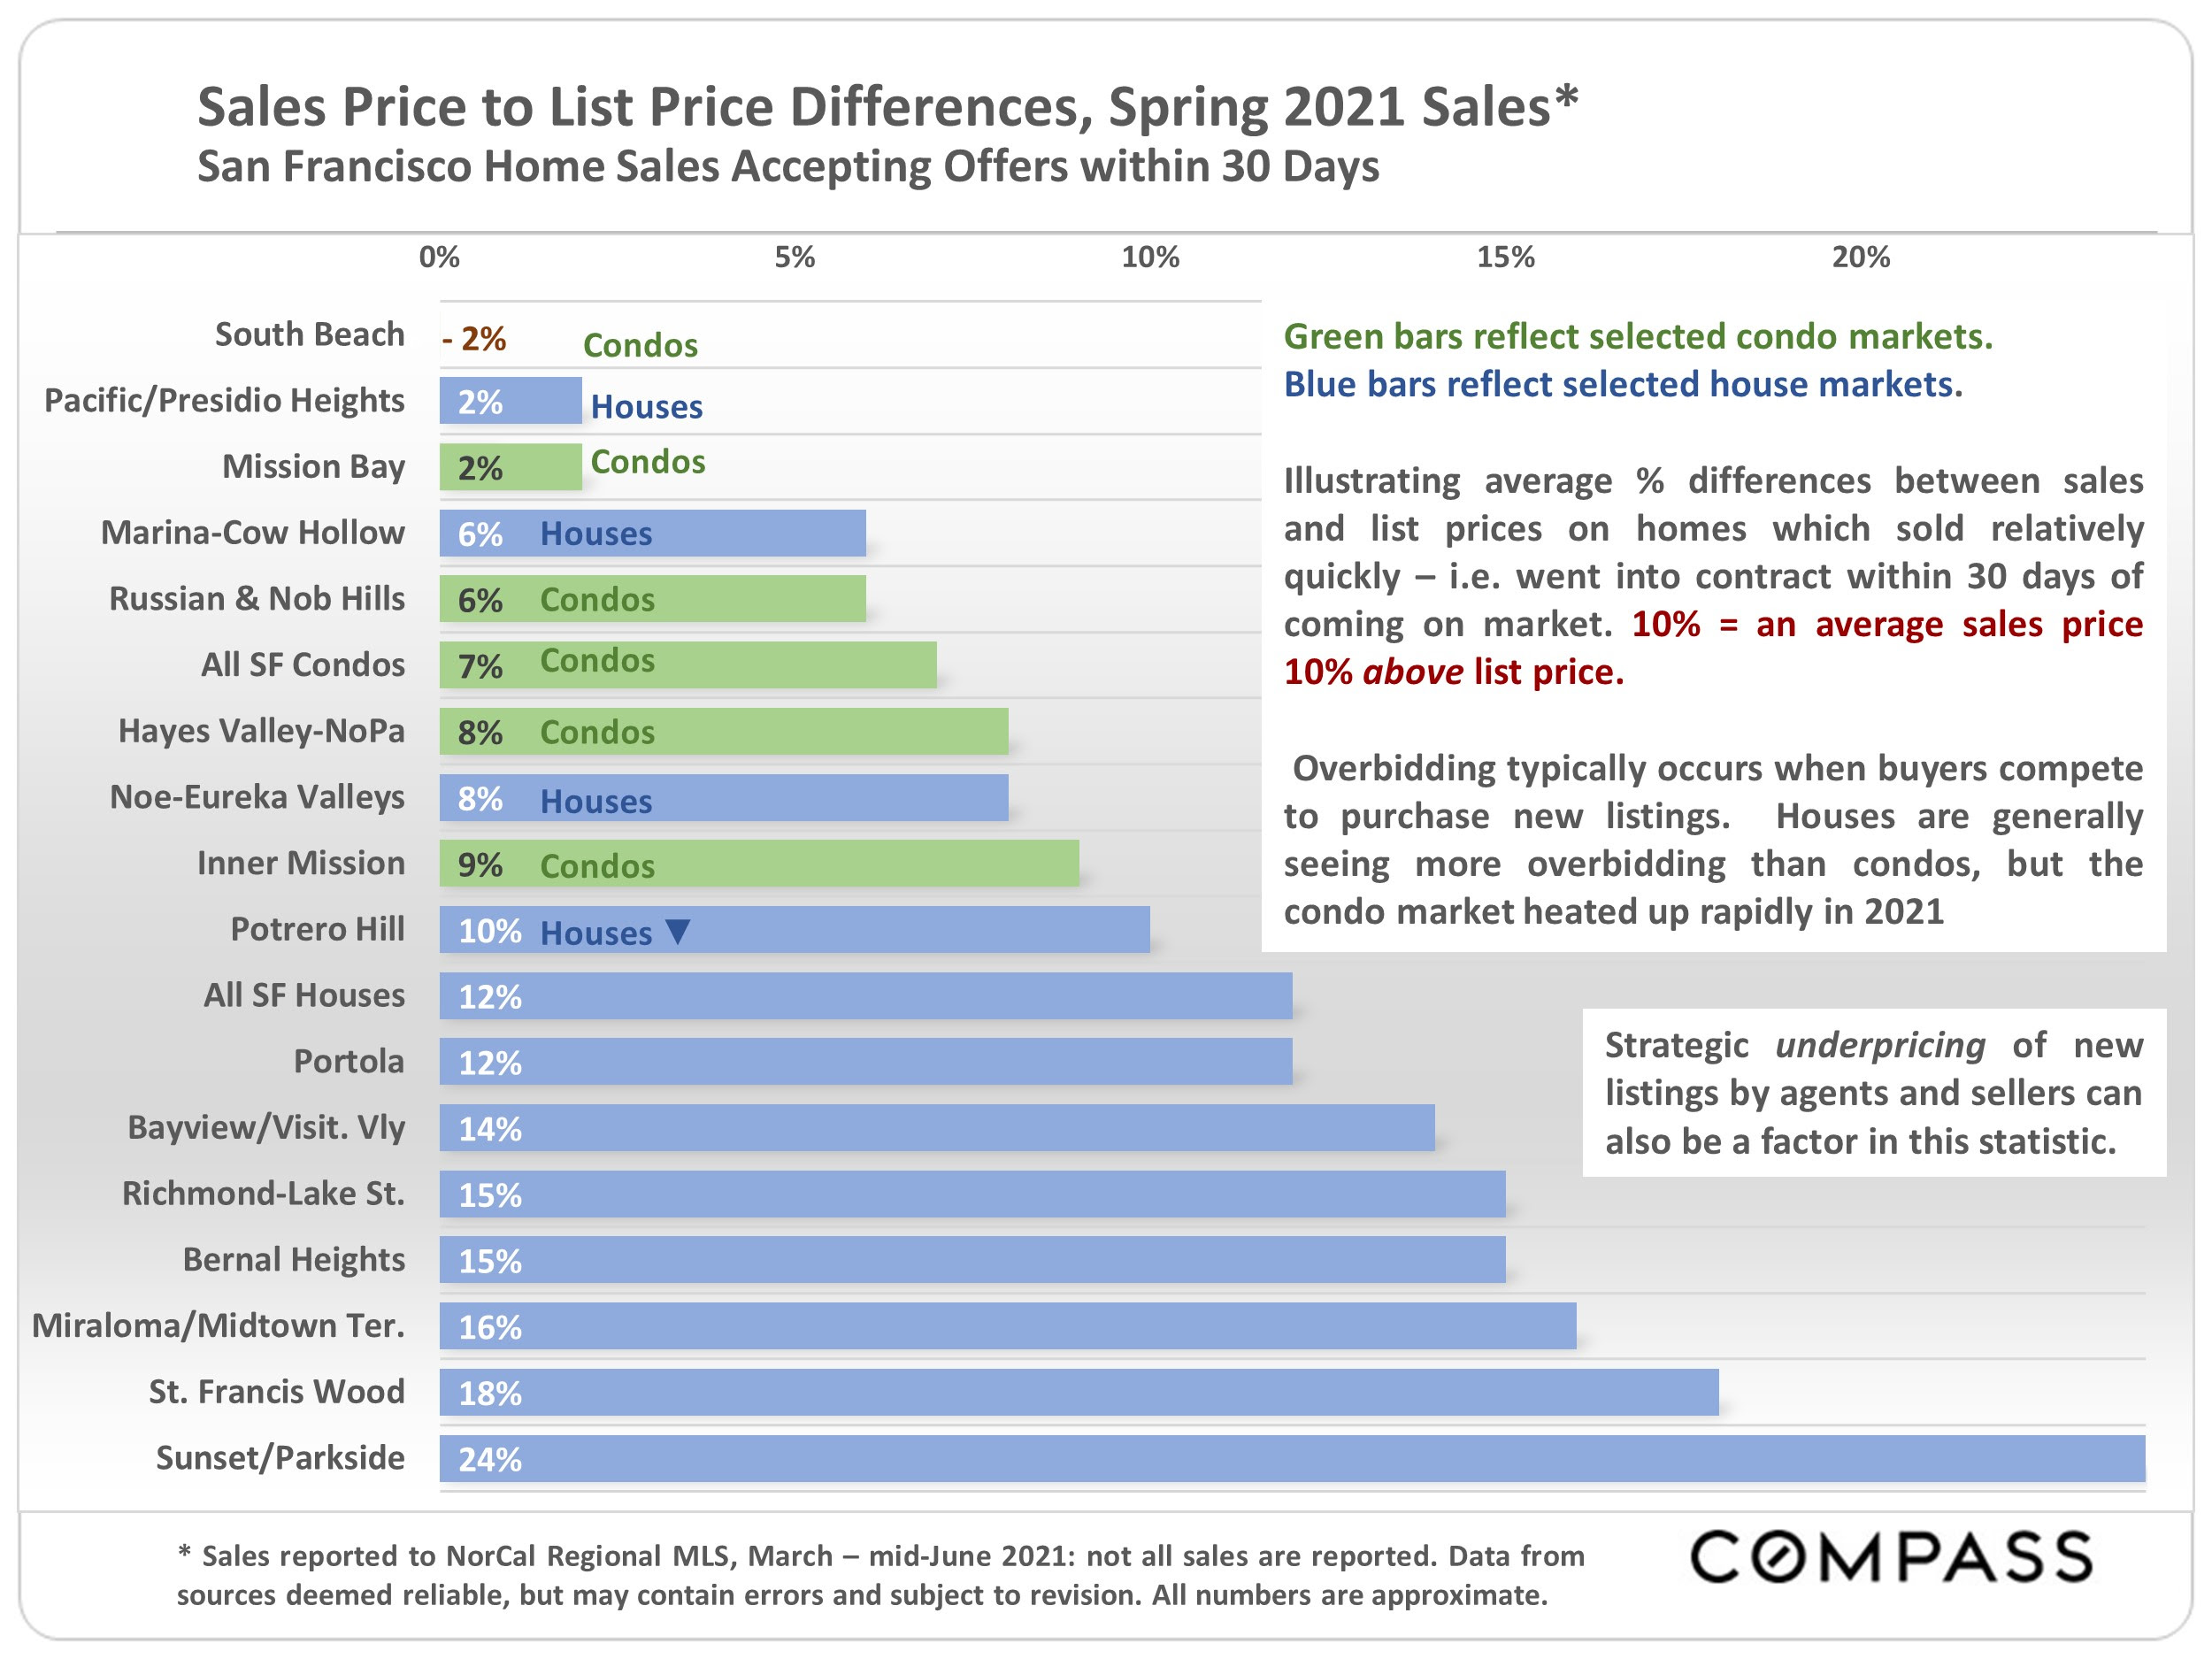
Chart of San Francisco spring 2021 sale-to-list price differences, with Sunset/Parkside highest at 24%.
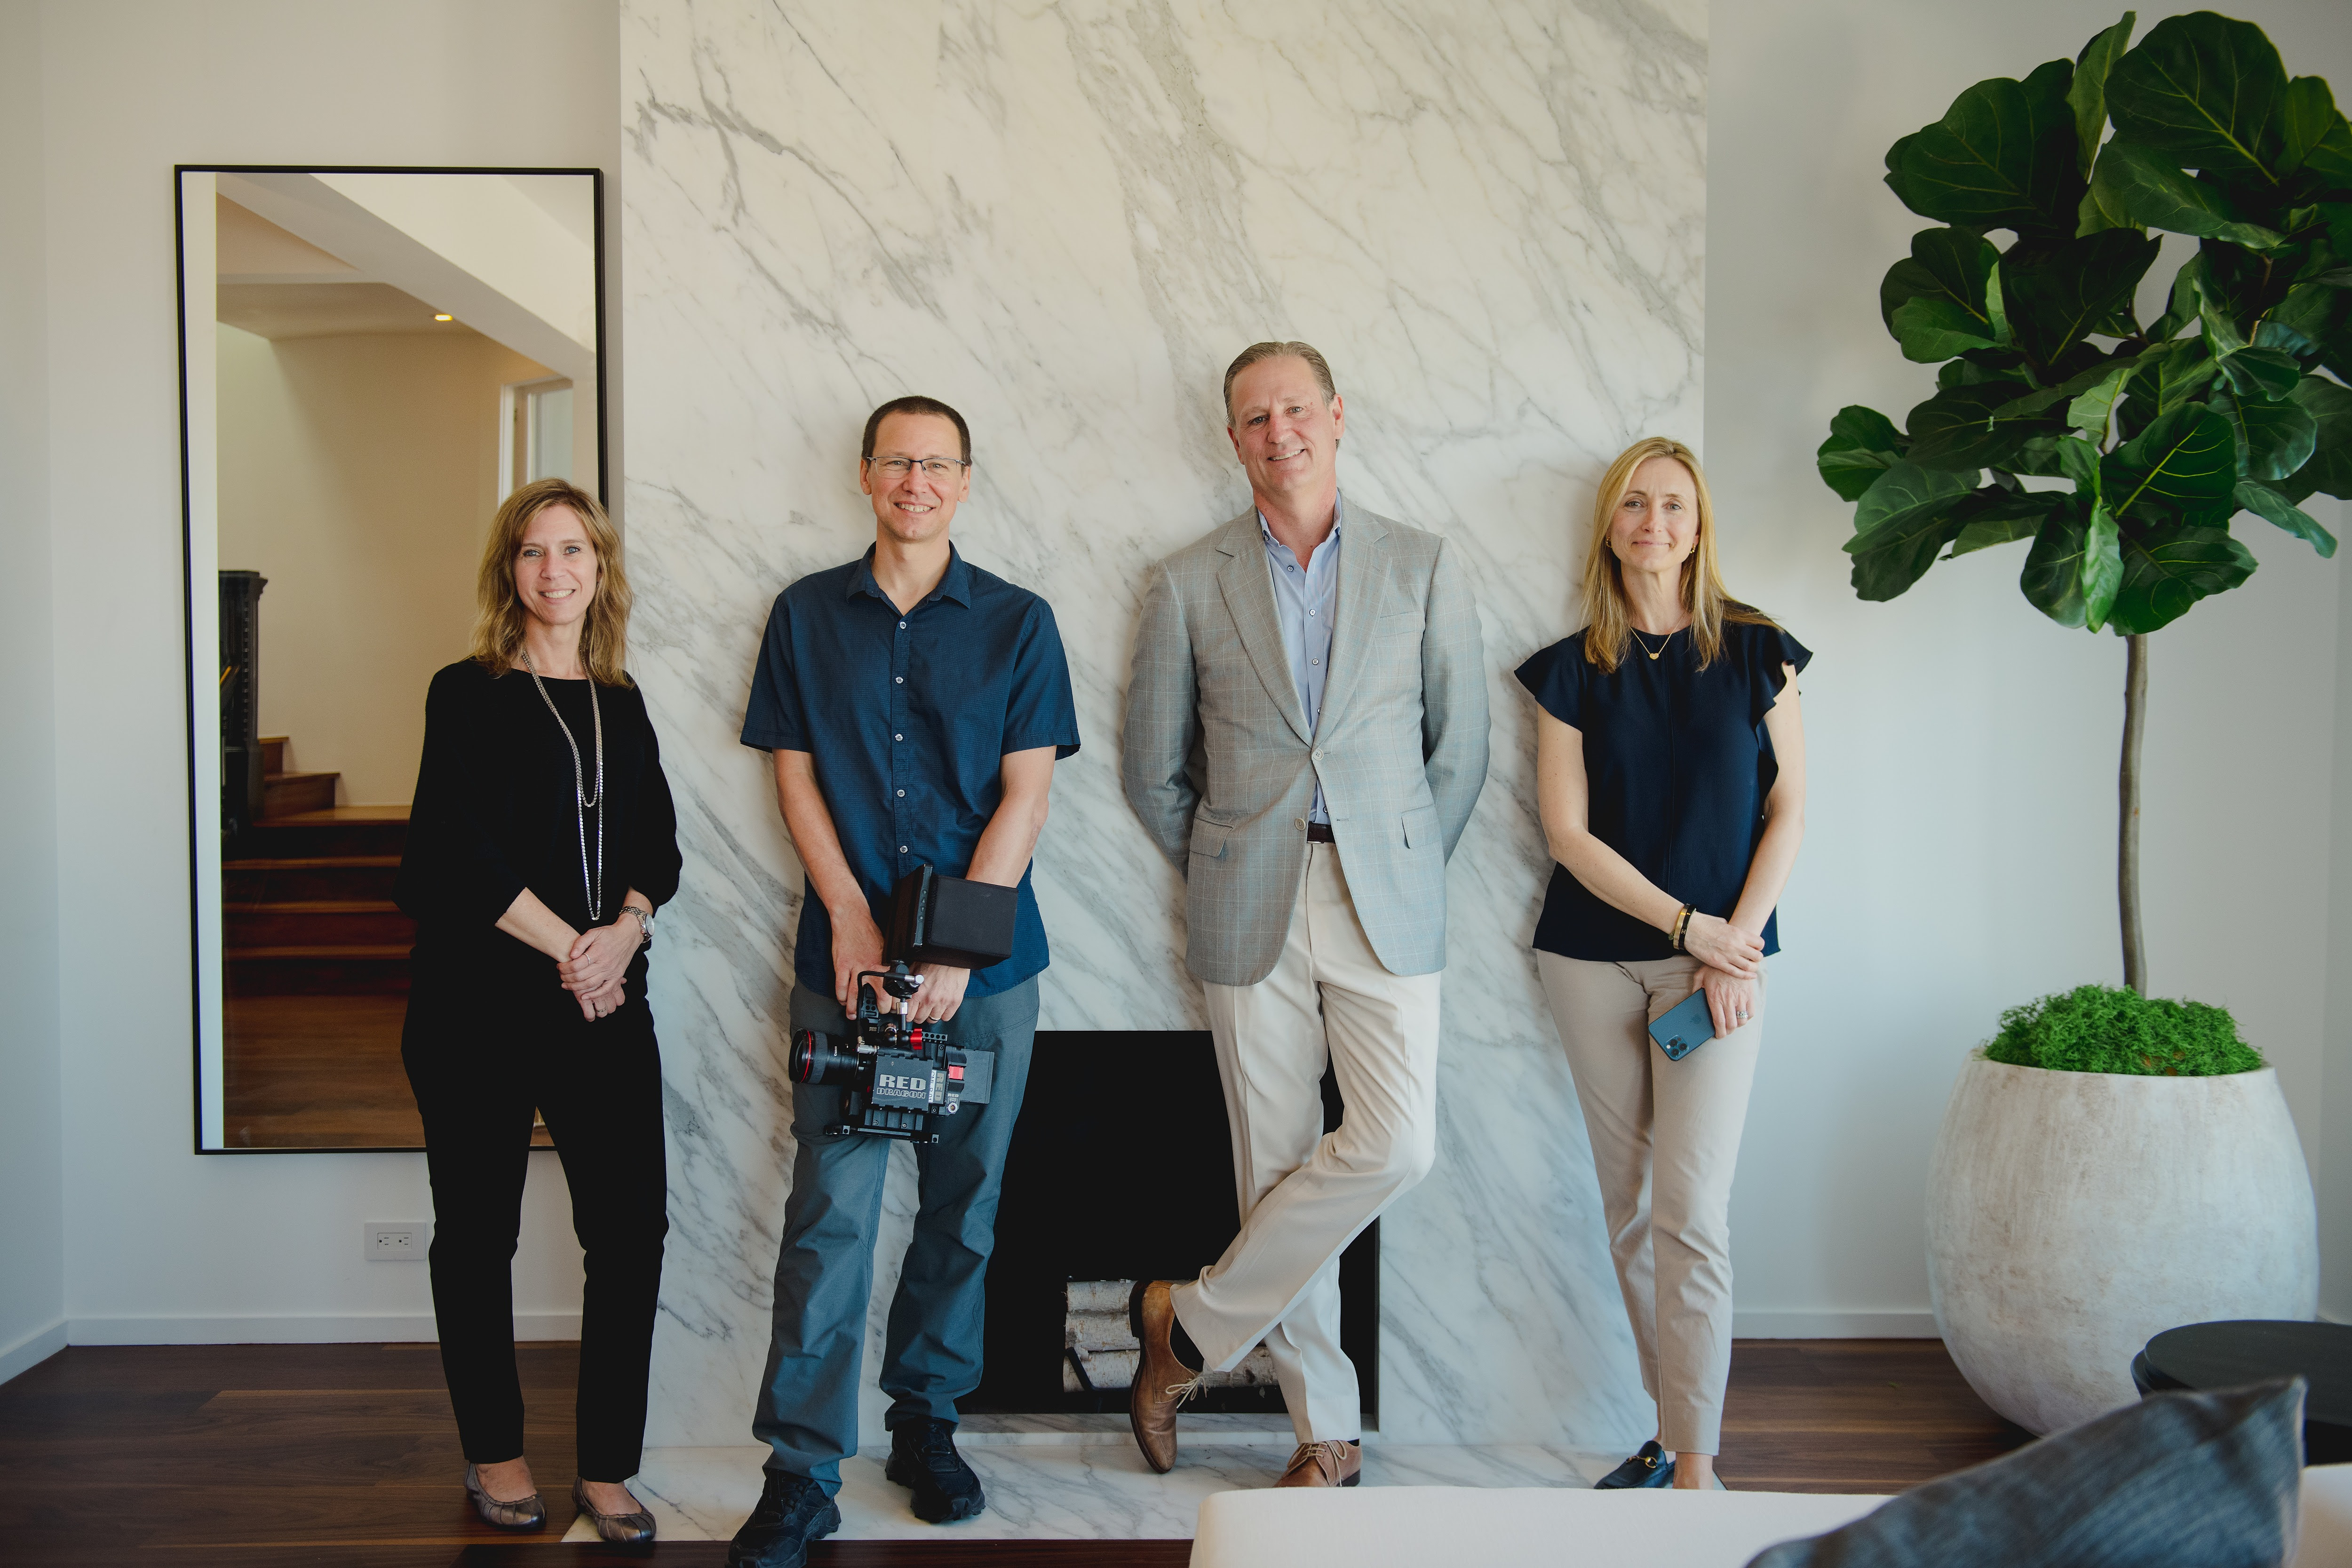
Four adults pose in a modern living room; one holds a cinema camera.

My Team and I would like to wish you a safe and relaxing summer!

all the best,

Max

Man in a gray suit and brown tie standing outdoors against a blue sky.

Follow Us On Instagram