
Max Armour
August 2021 San Francisco Real Estate Report cover, with a kite surfer near the Golden Gate Bridge.

San Francisco August

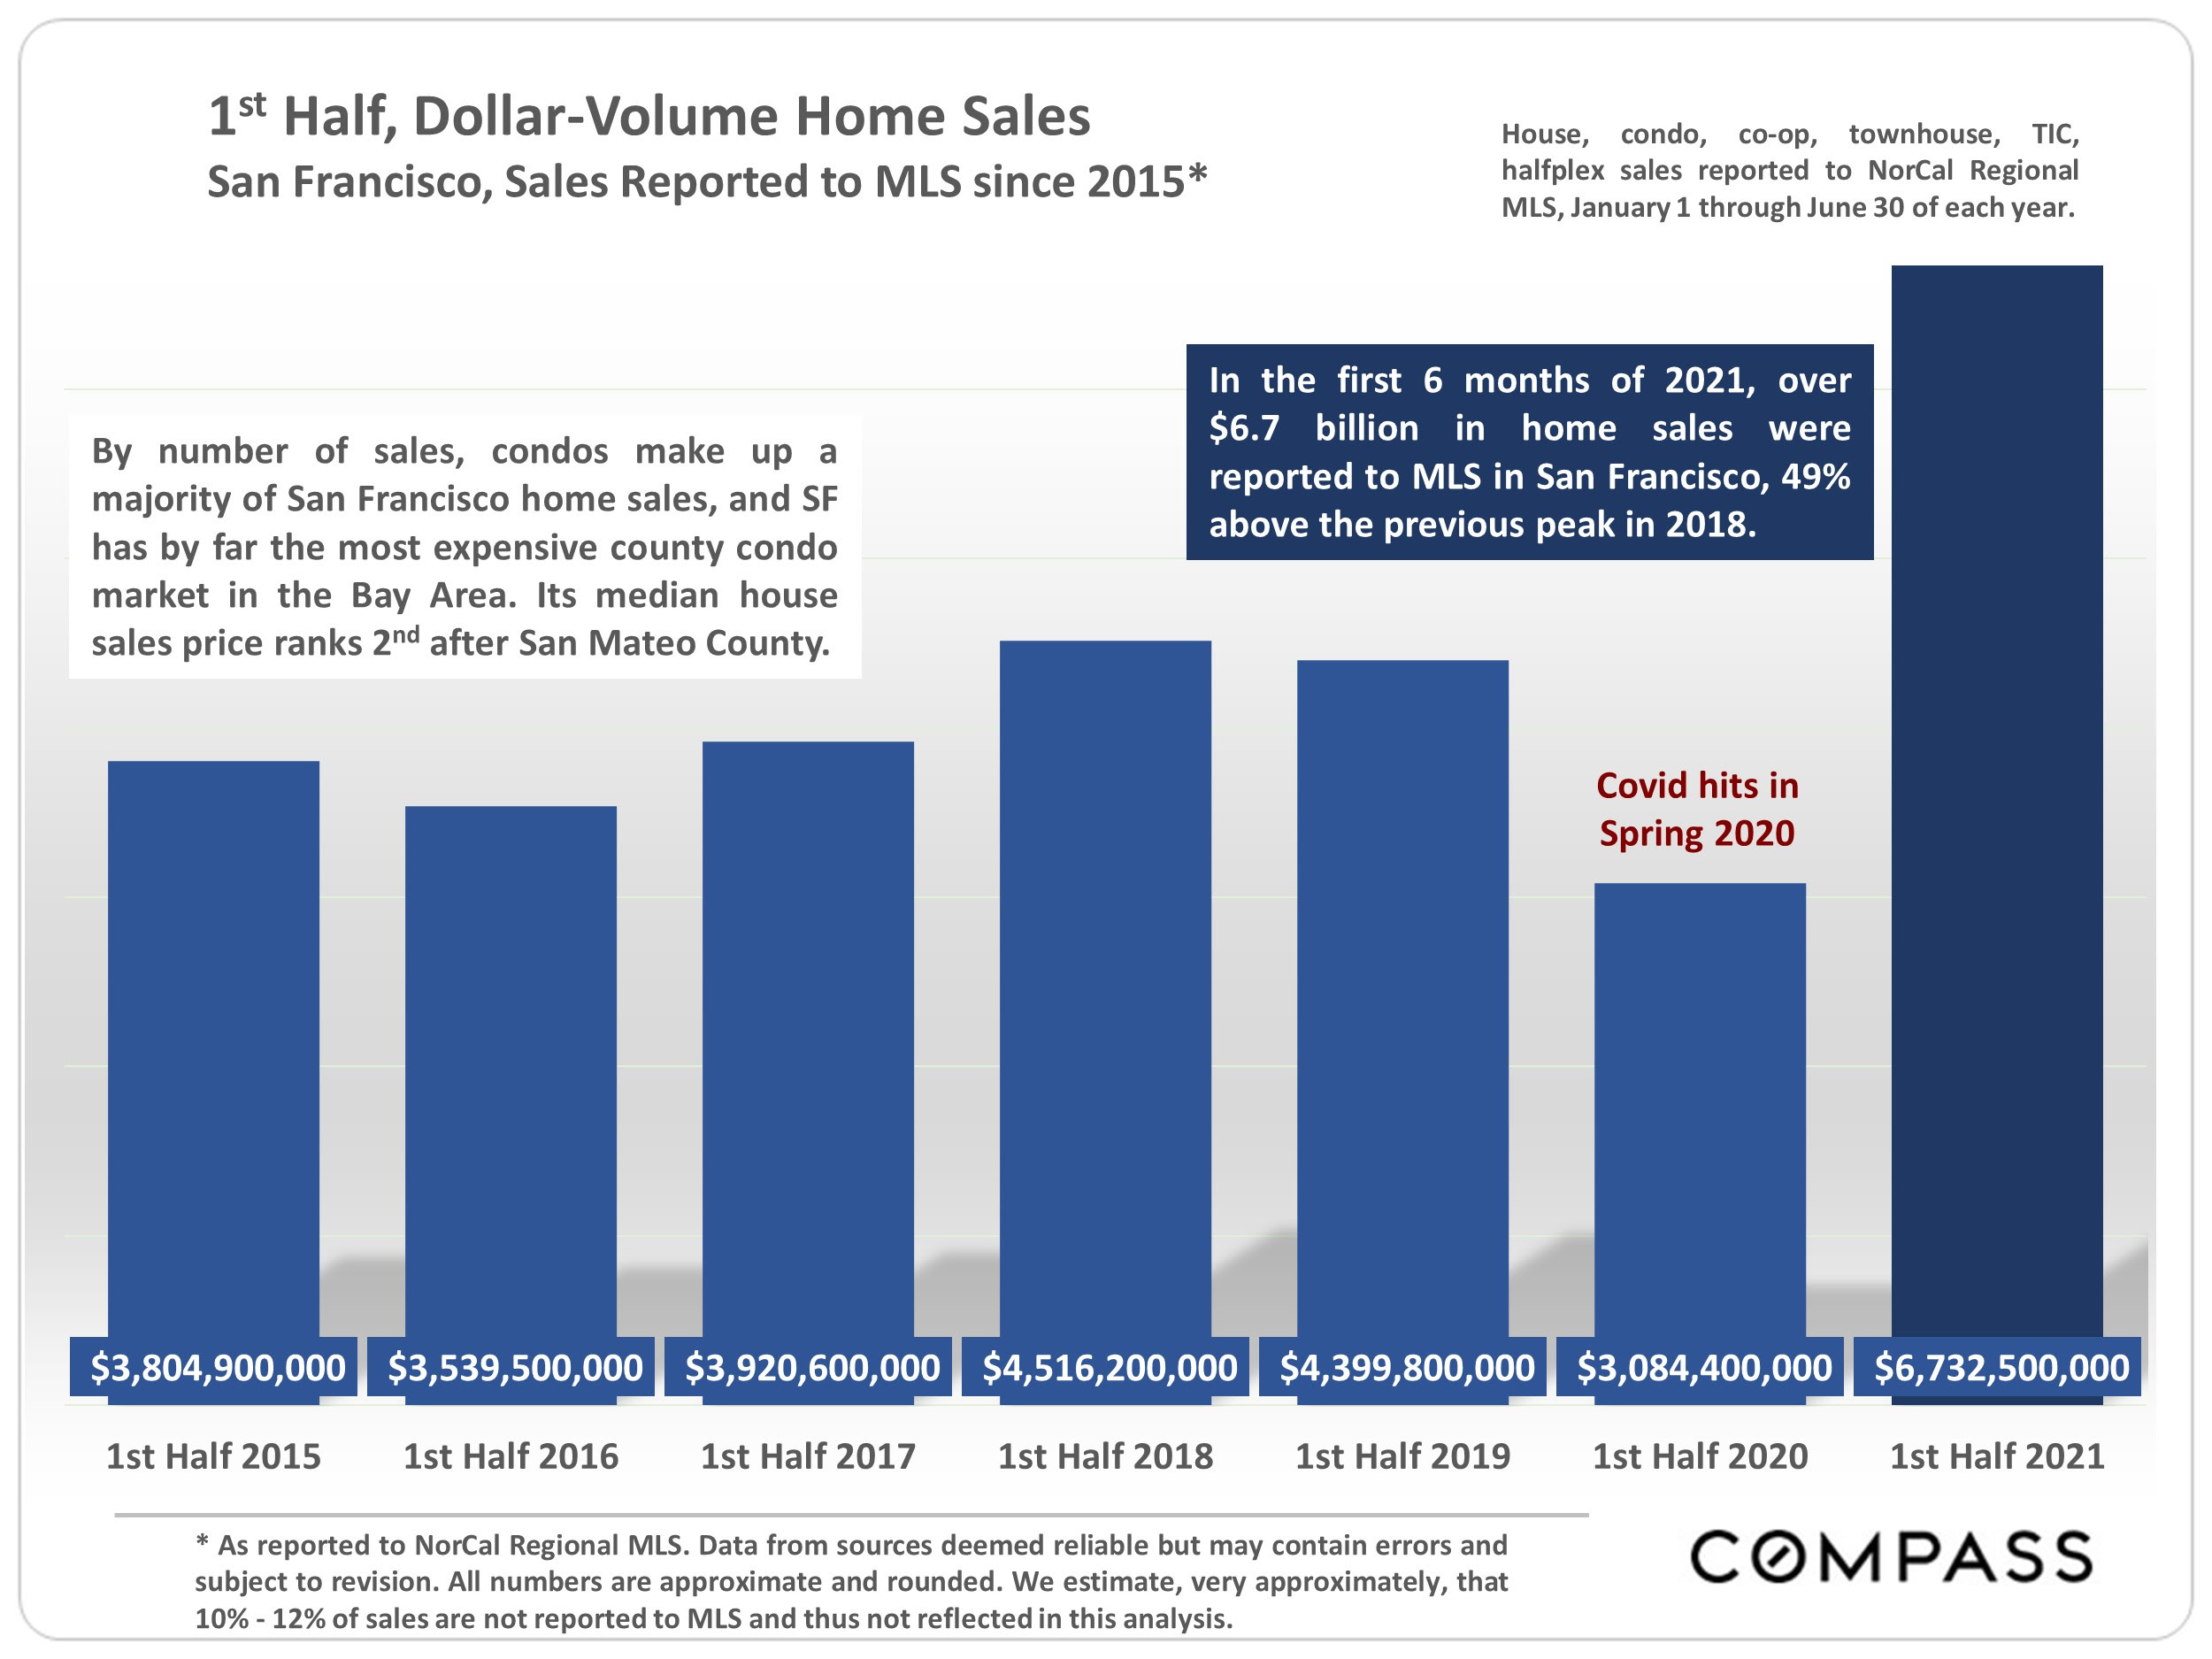
1st Half, Dollar-Volume Home Sales
 
San Francisco Real Estate August 2021 Report
Bar chart of San Francisco first-half home sales from 2015–2021, peaking at $6.73 billion in 2021.
San Francisco chart of rolling home listings and sales volumes from 2005 to July 2021, with pandemic-era highs highlighted.
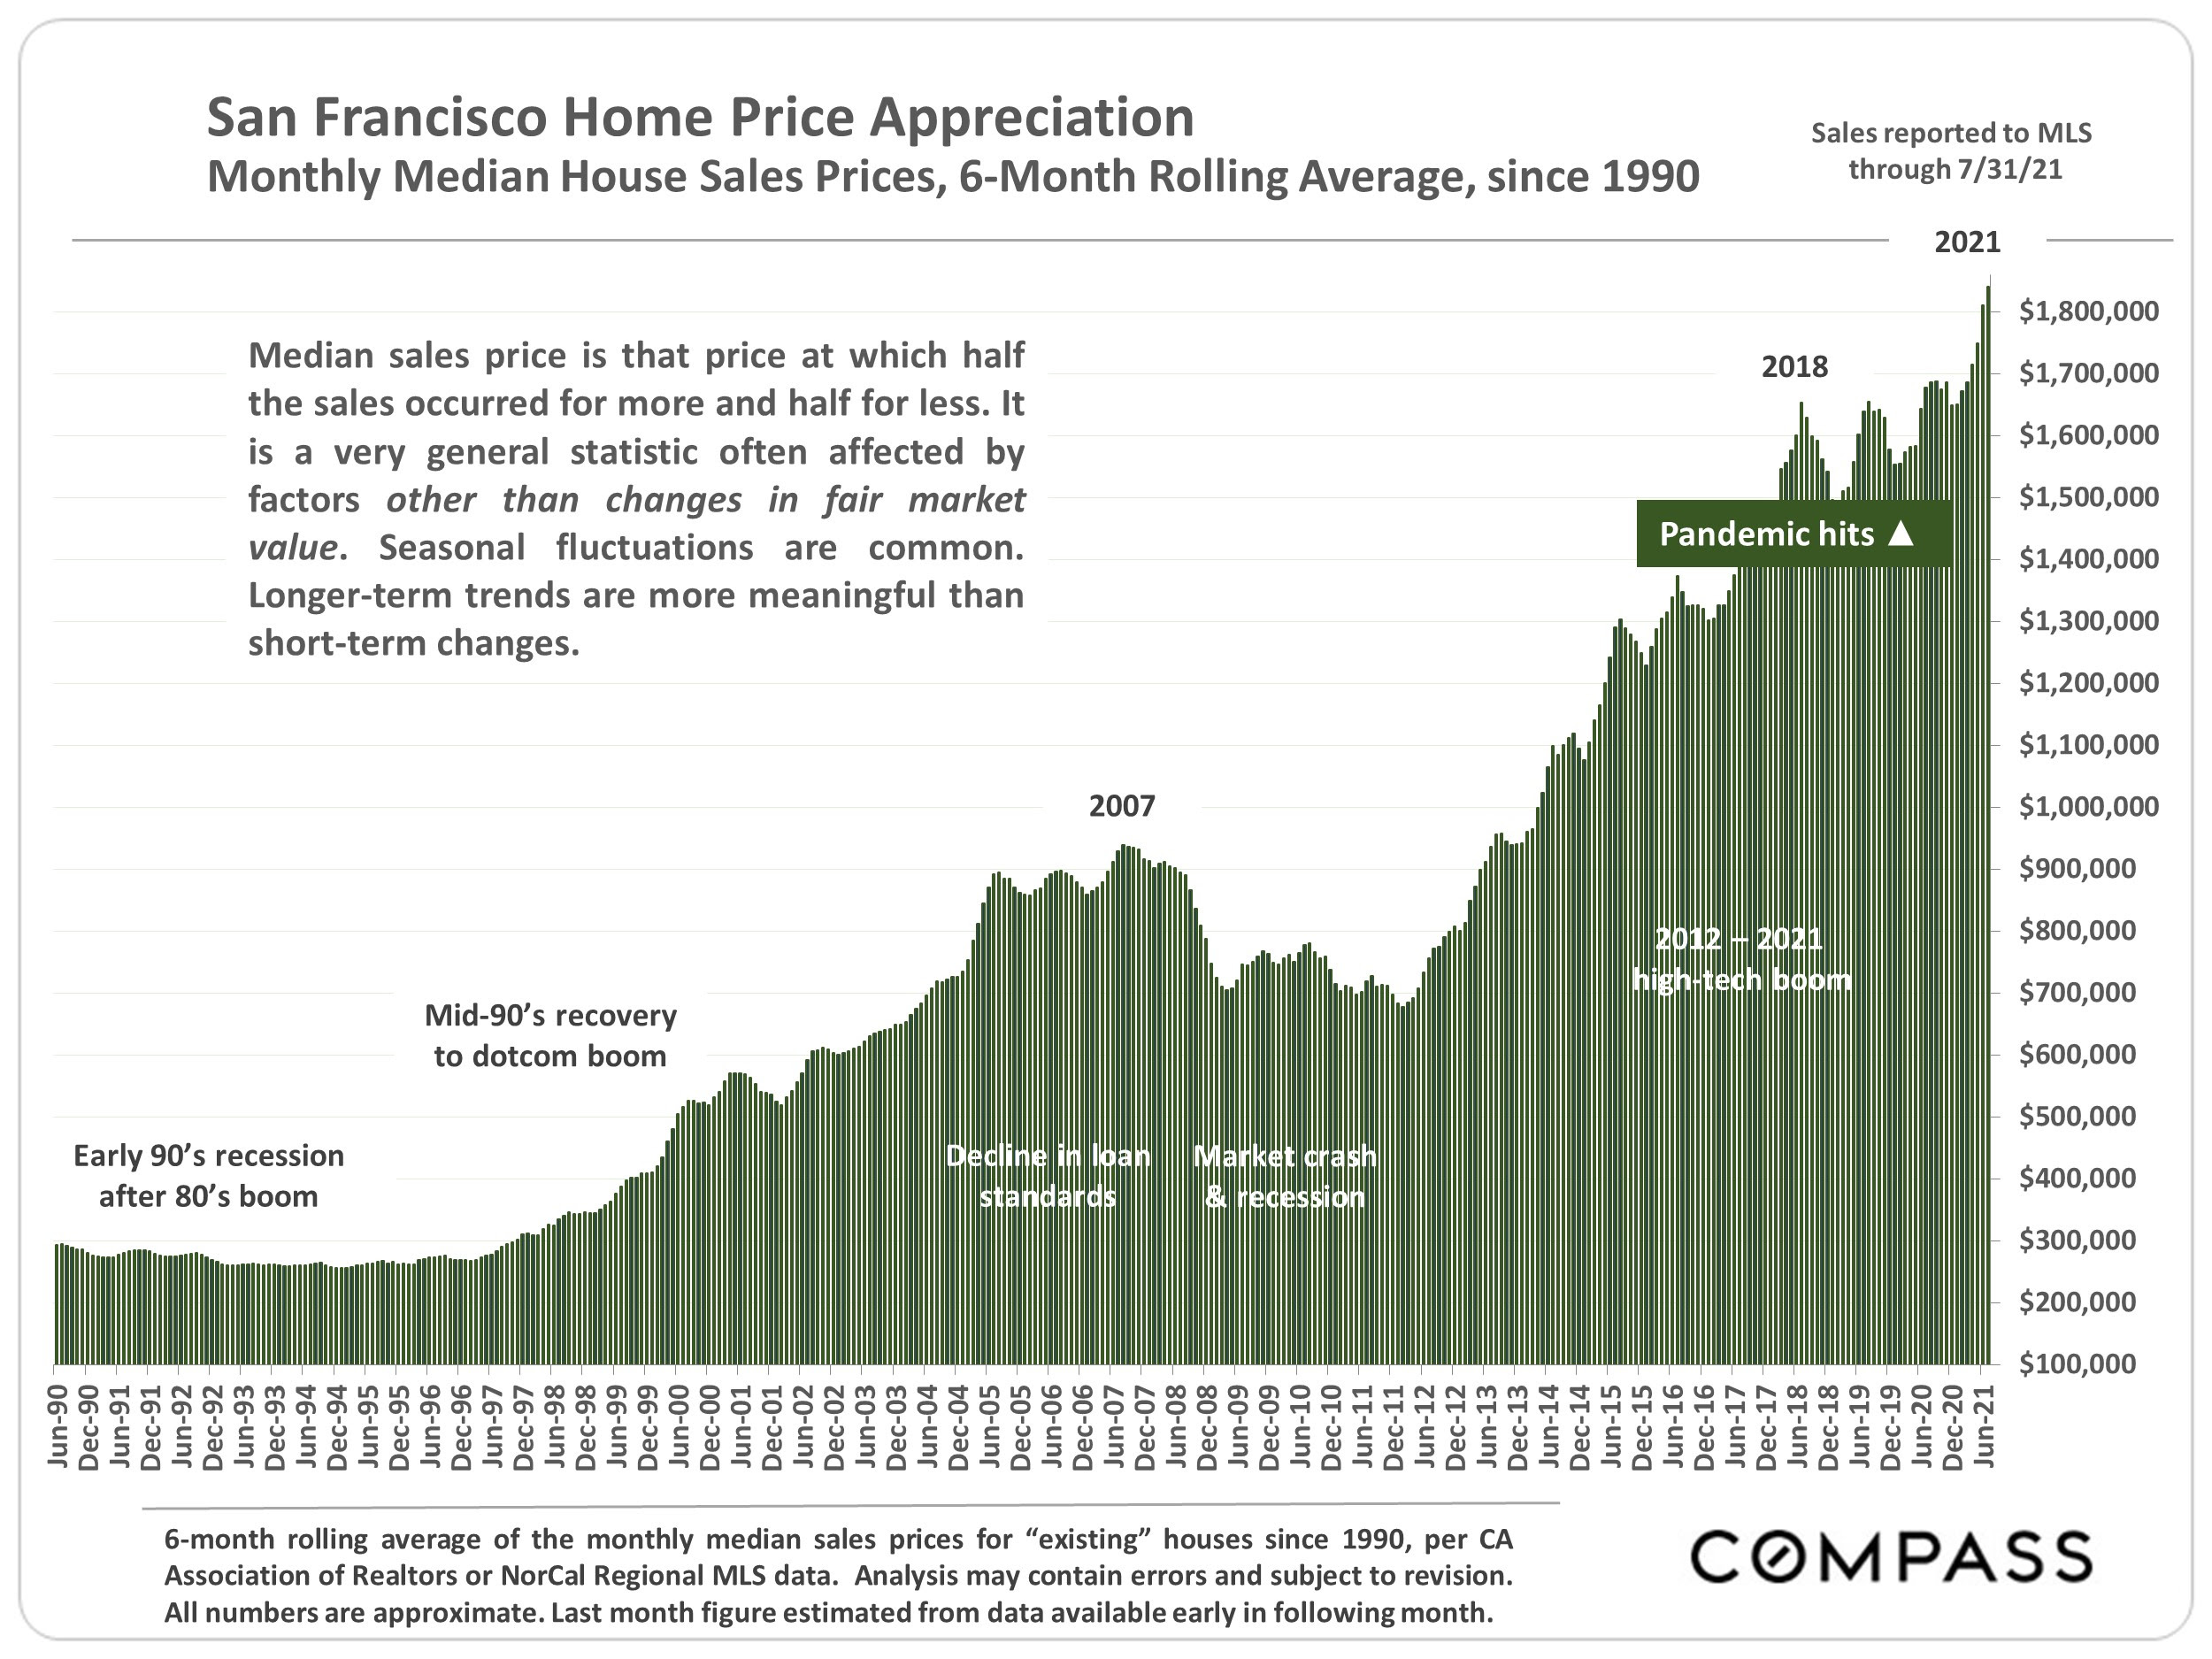
Chart of San Francisco median home prices from 1990 to 2021, showing steep appreciation.
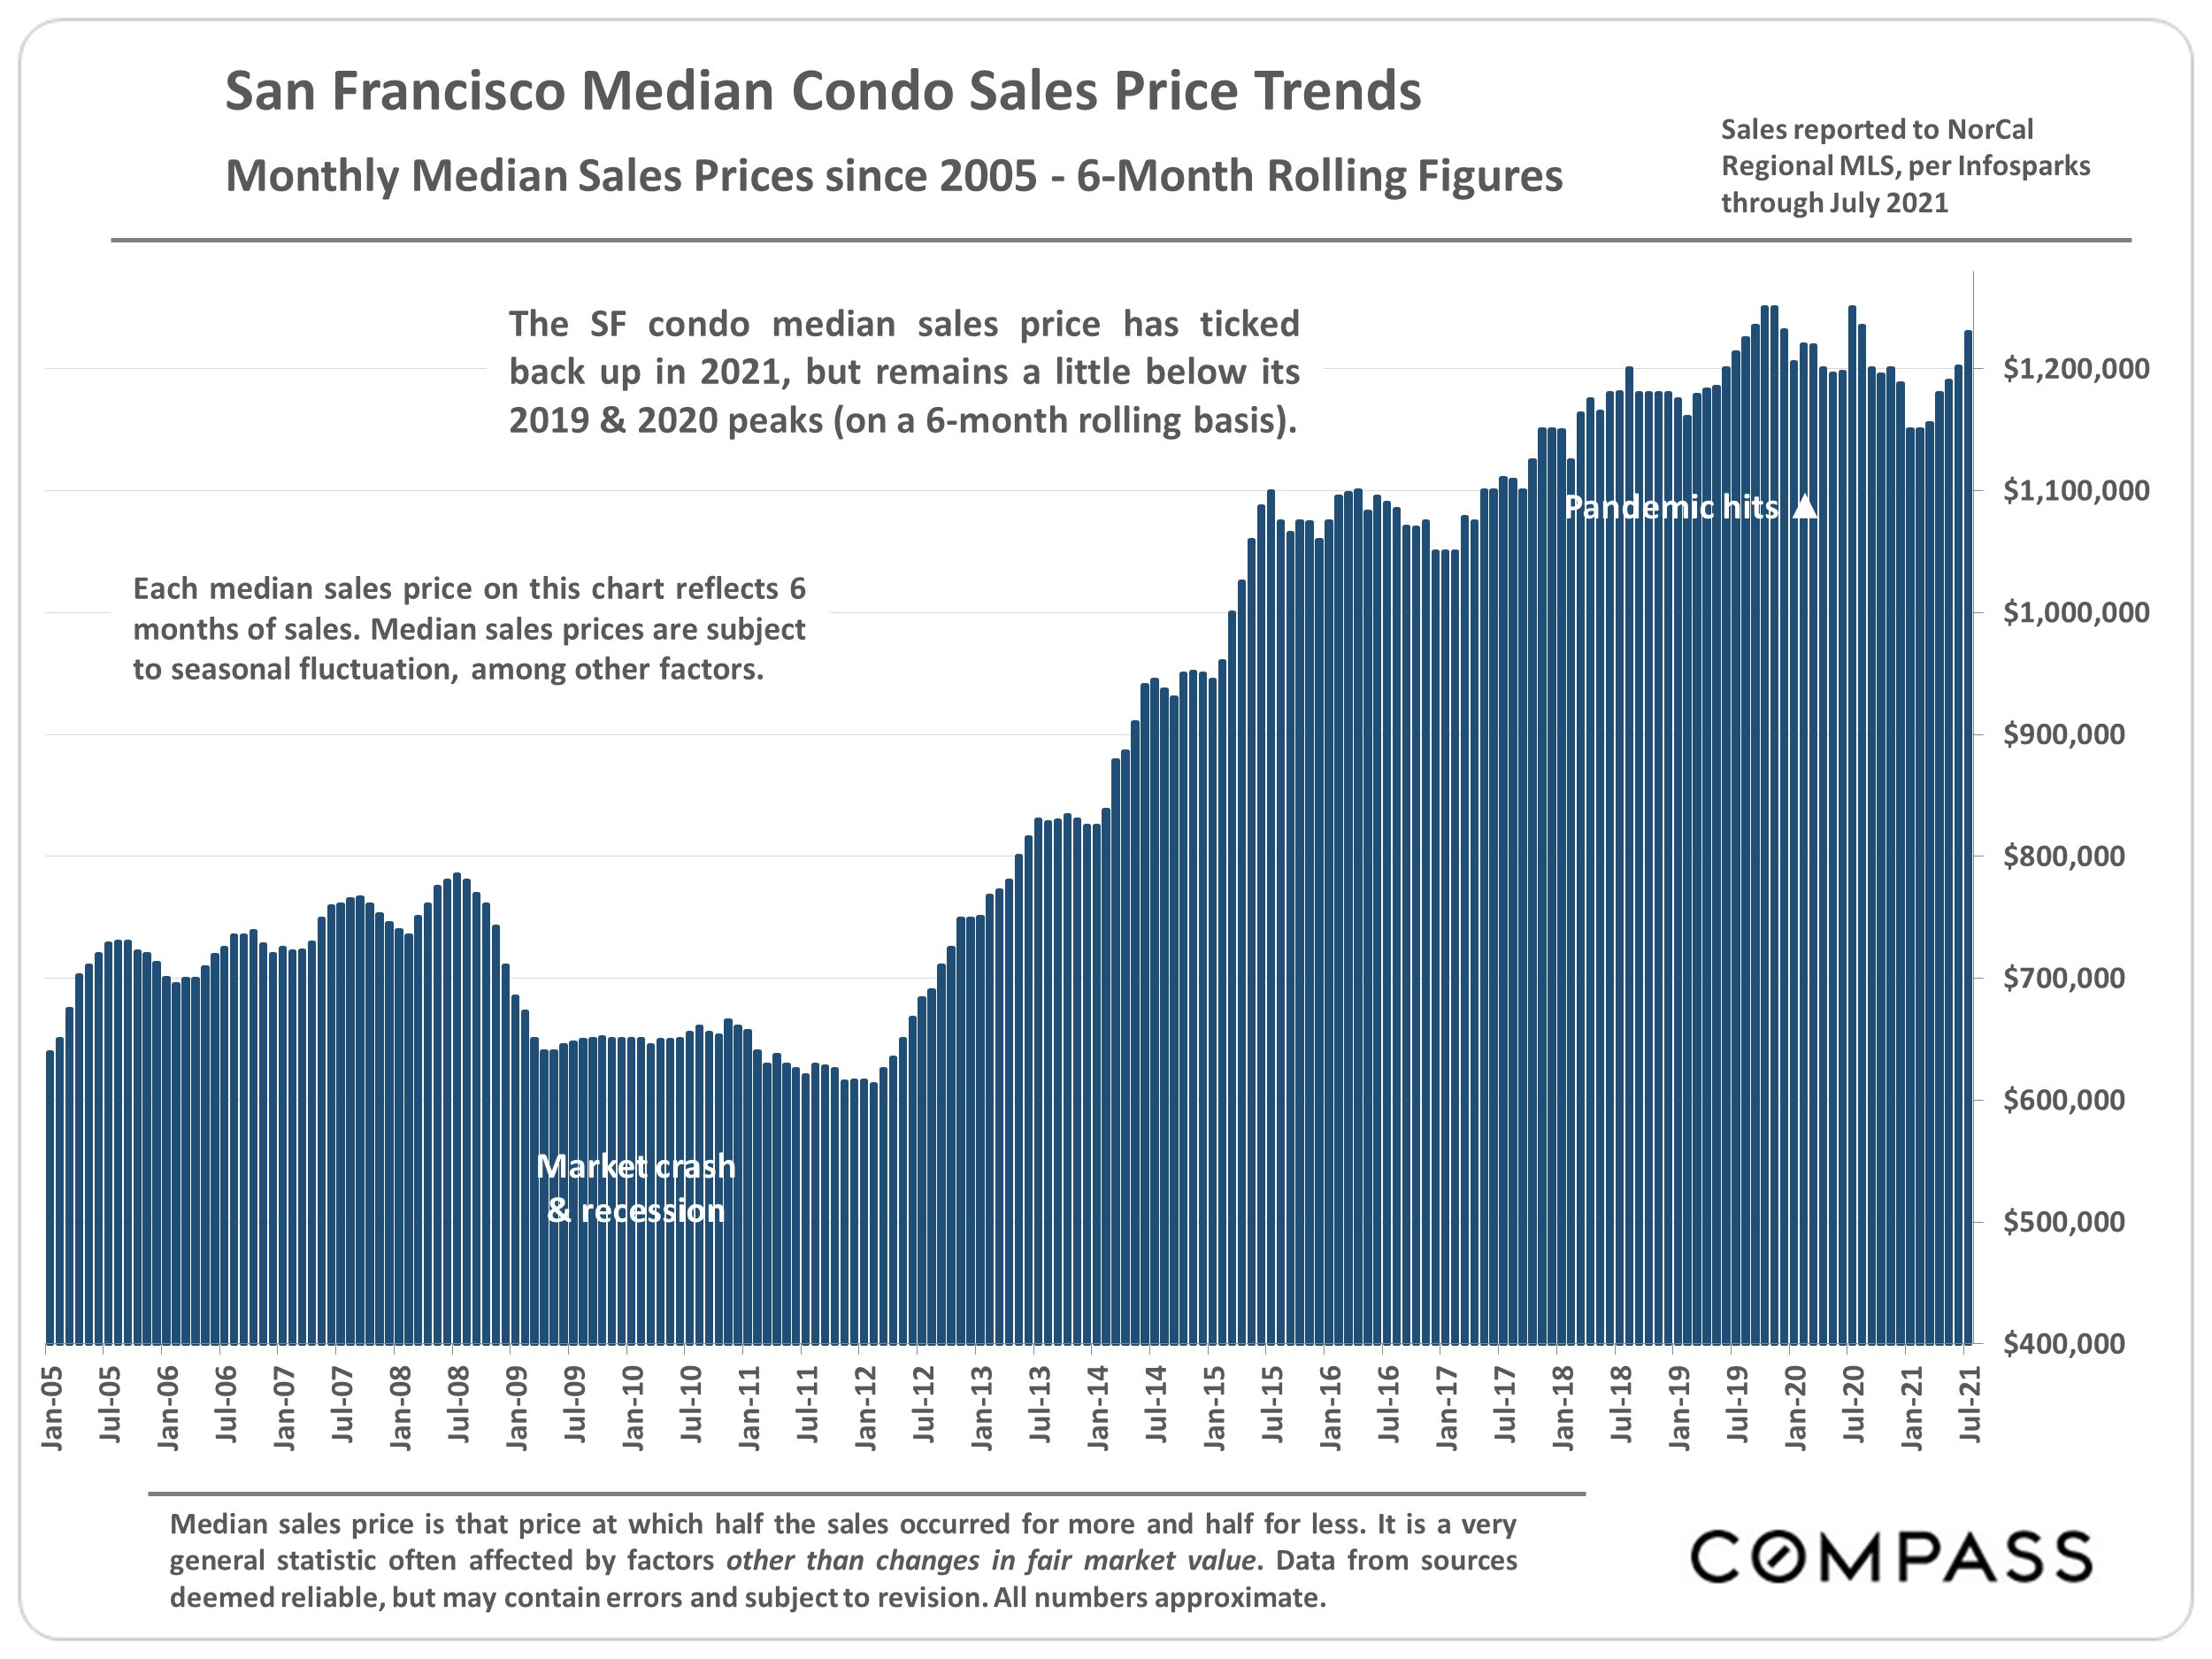
Bar chart of San Francisco median condo prices, 2005–2021: prices rise to over $1.2 million before a slight dip in 2021.
Color-coded San Francisco neighborhood map labeled Median Home Sales Prices, with plus-sign markers and a home price map link.
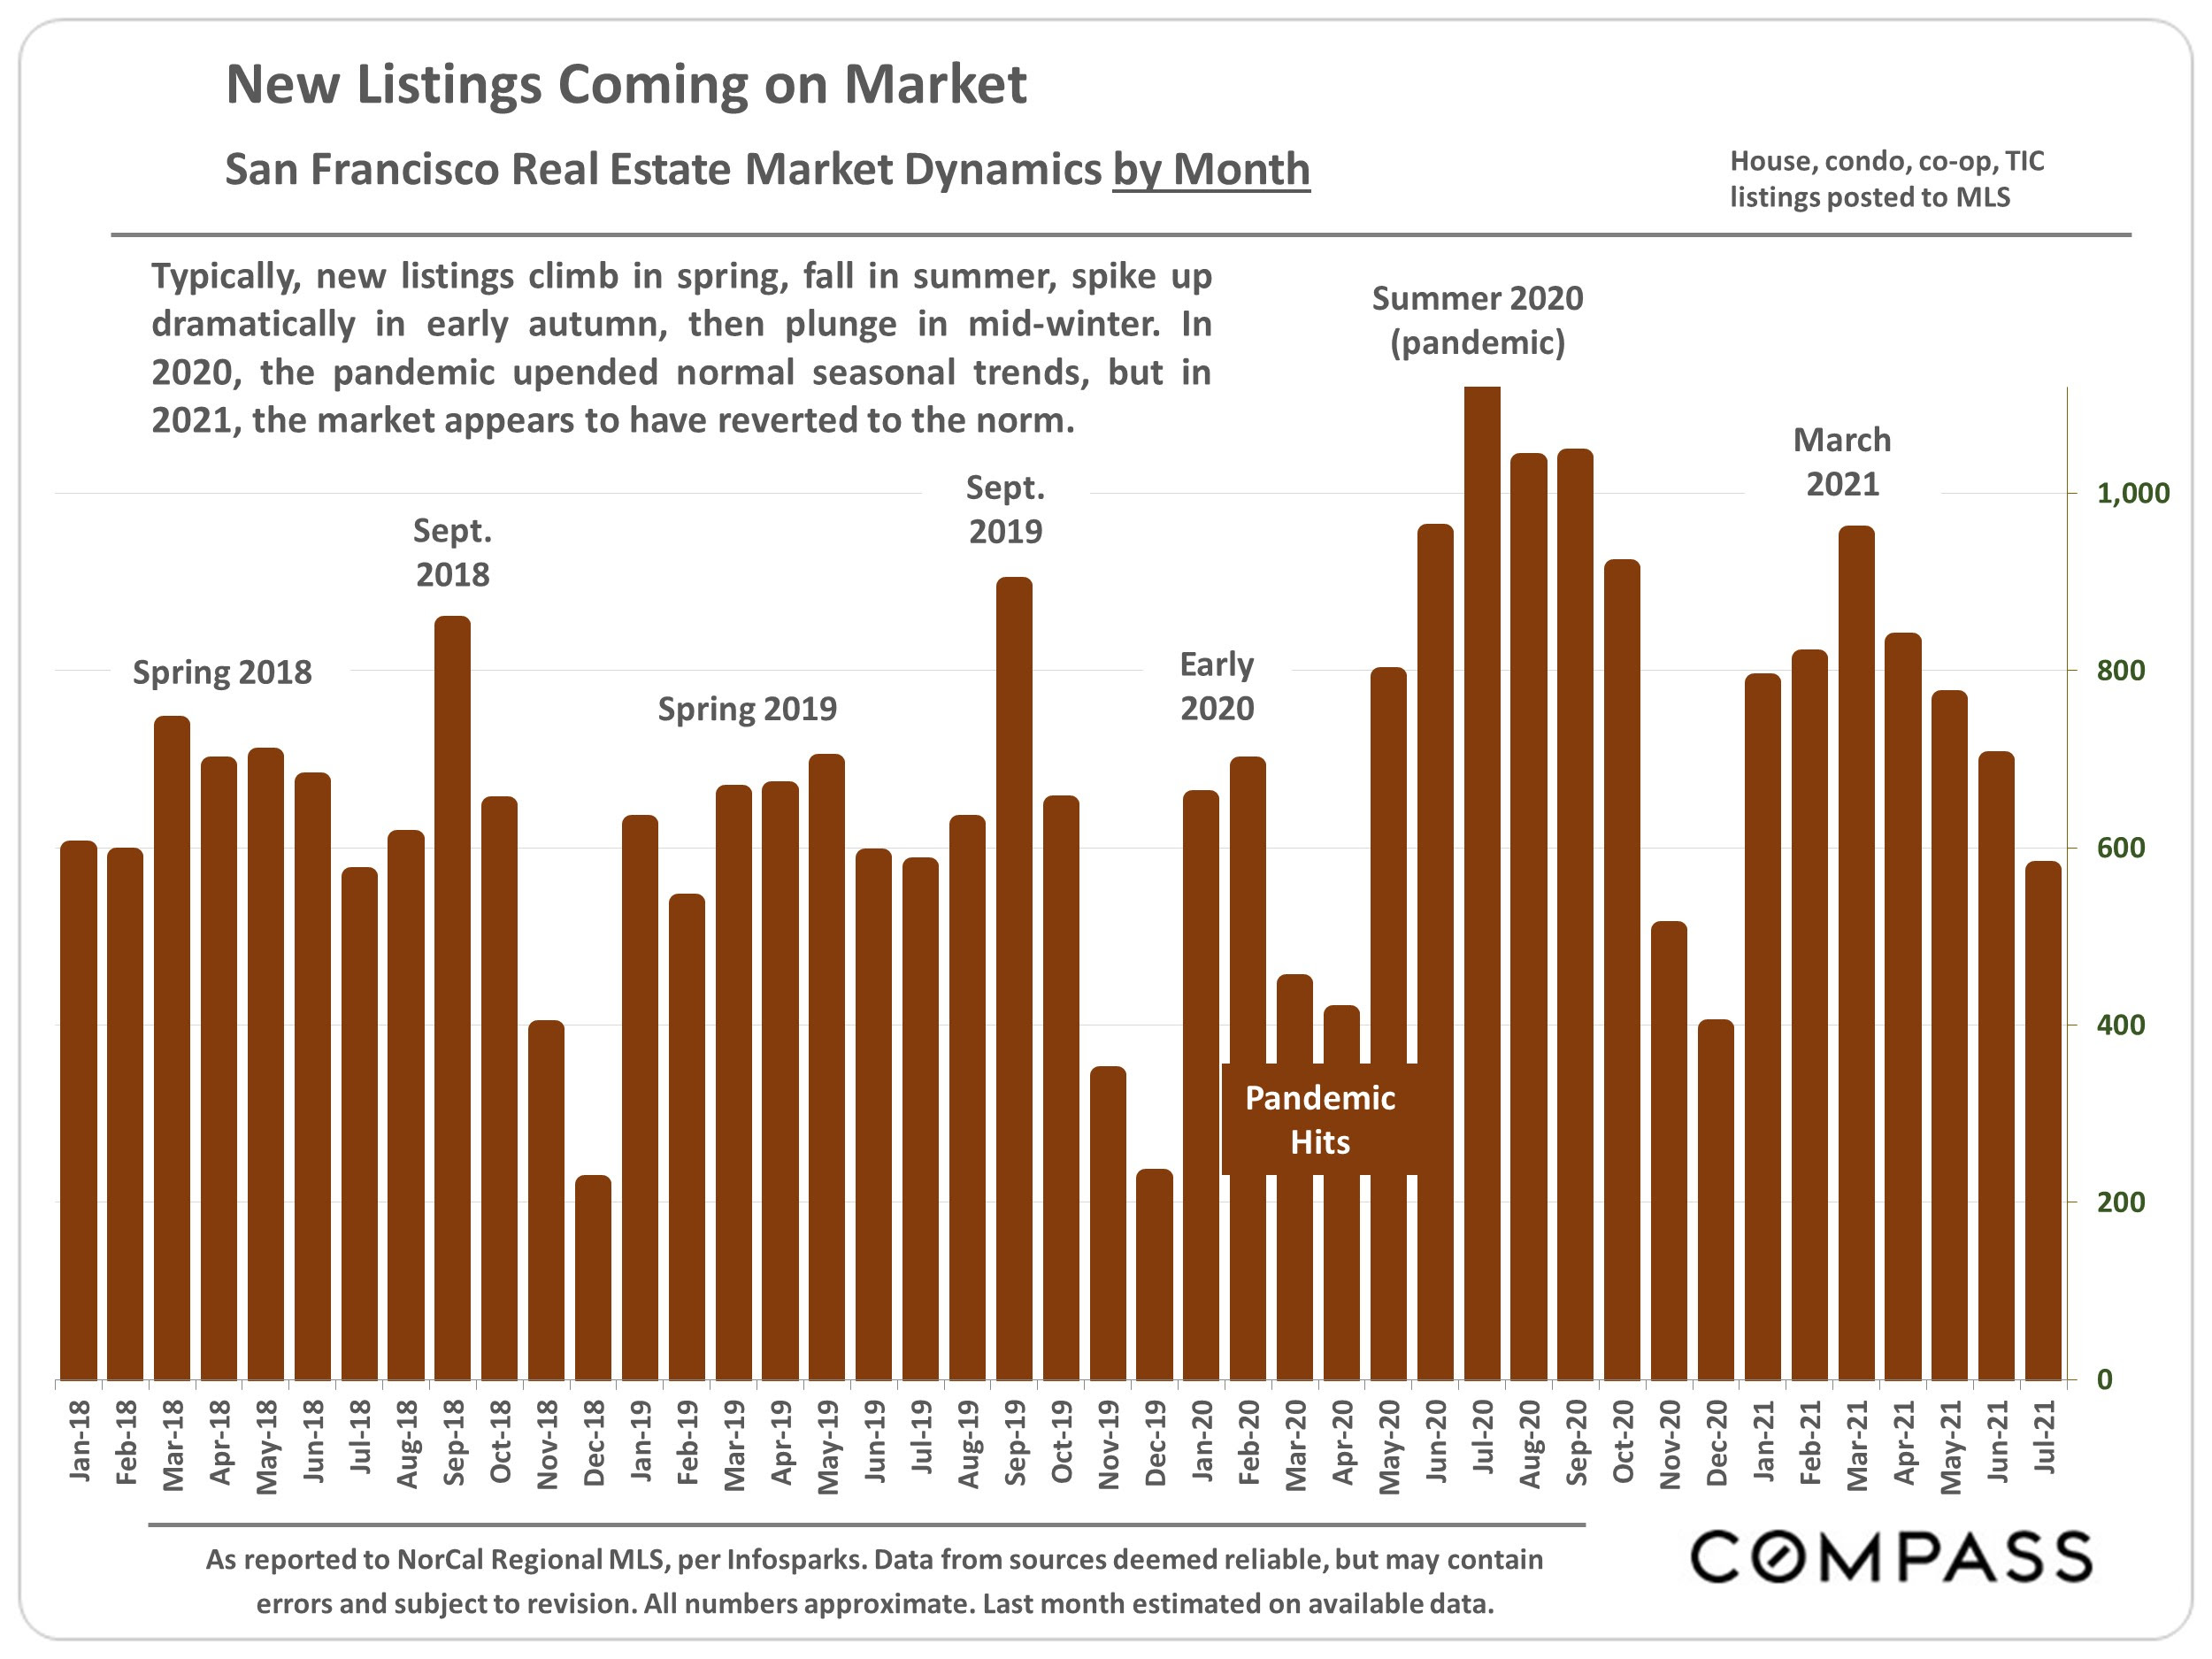
Bar chart of monthly San Francisco new listings from 2018 to 2021, highlighting pandemic-era changes.
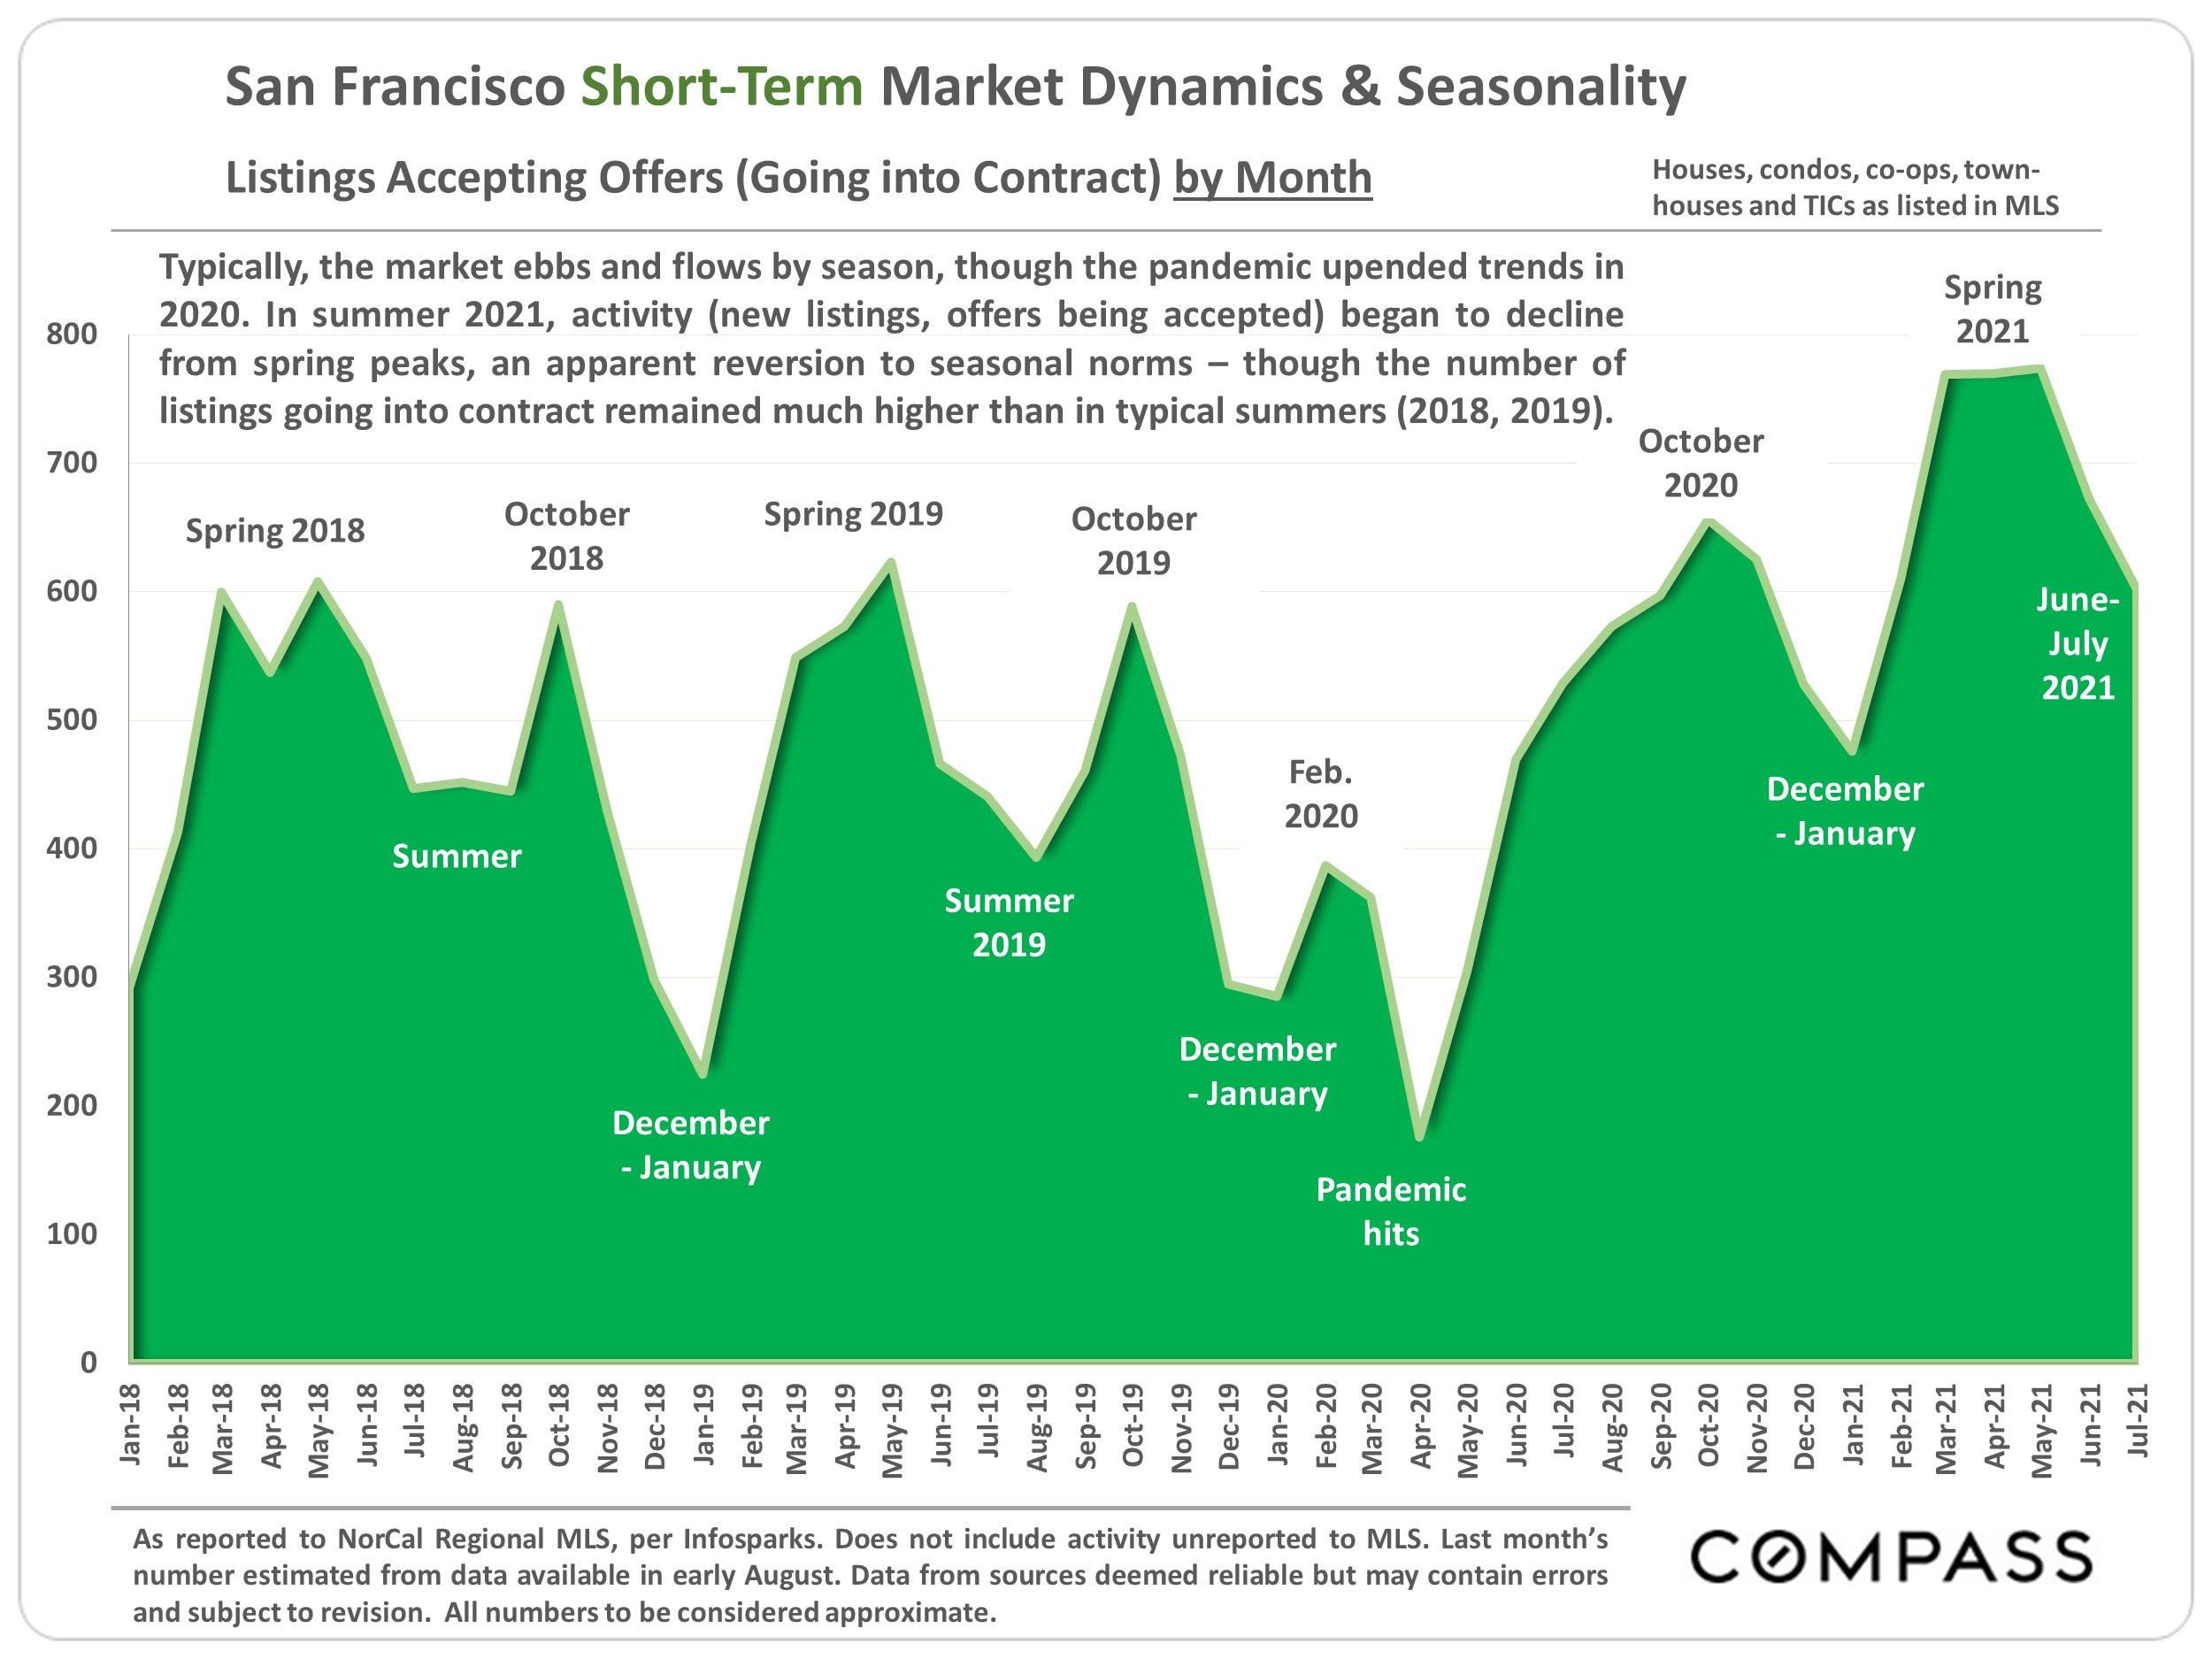
Chart of San Francisco listings going under contract monthly, showing seasonal trends and a sharp rise in spring 2021.
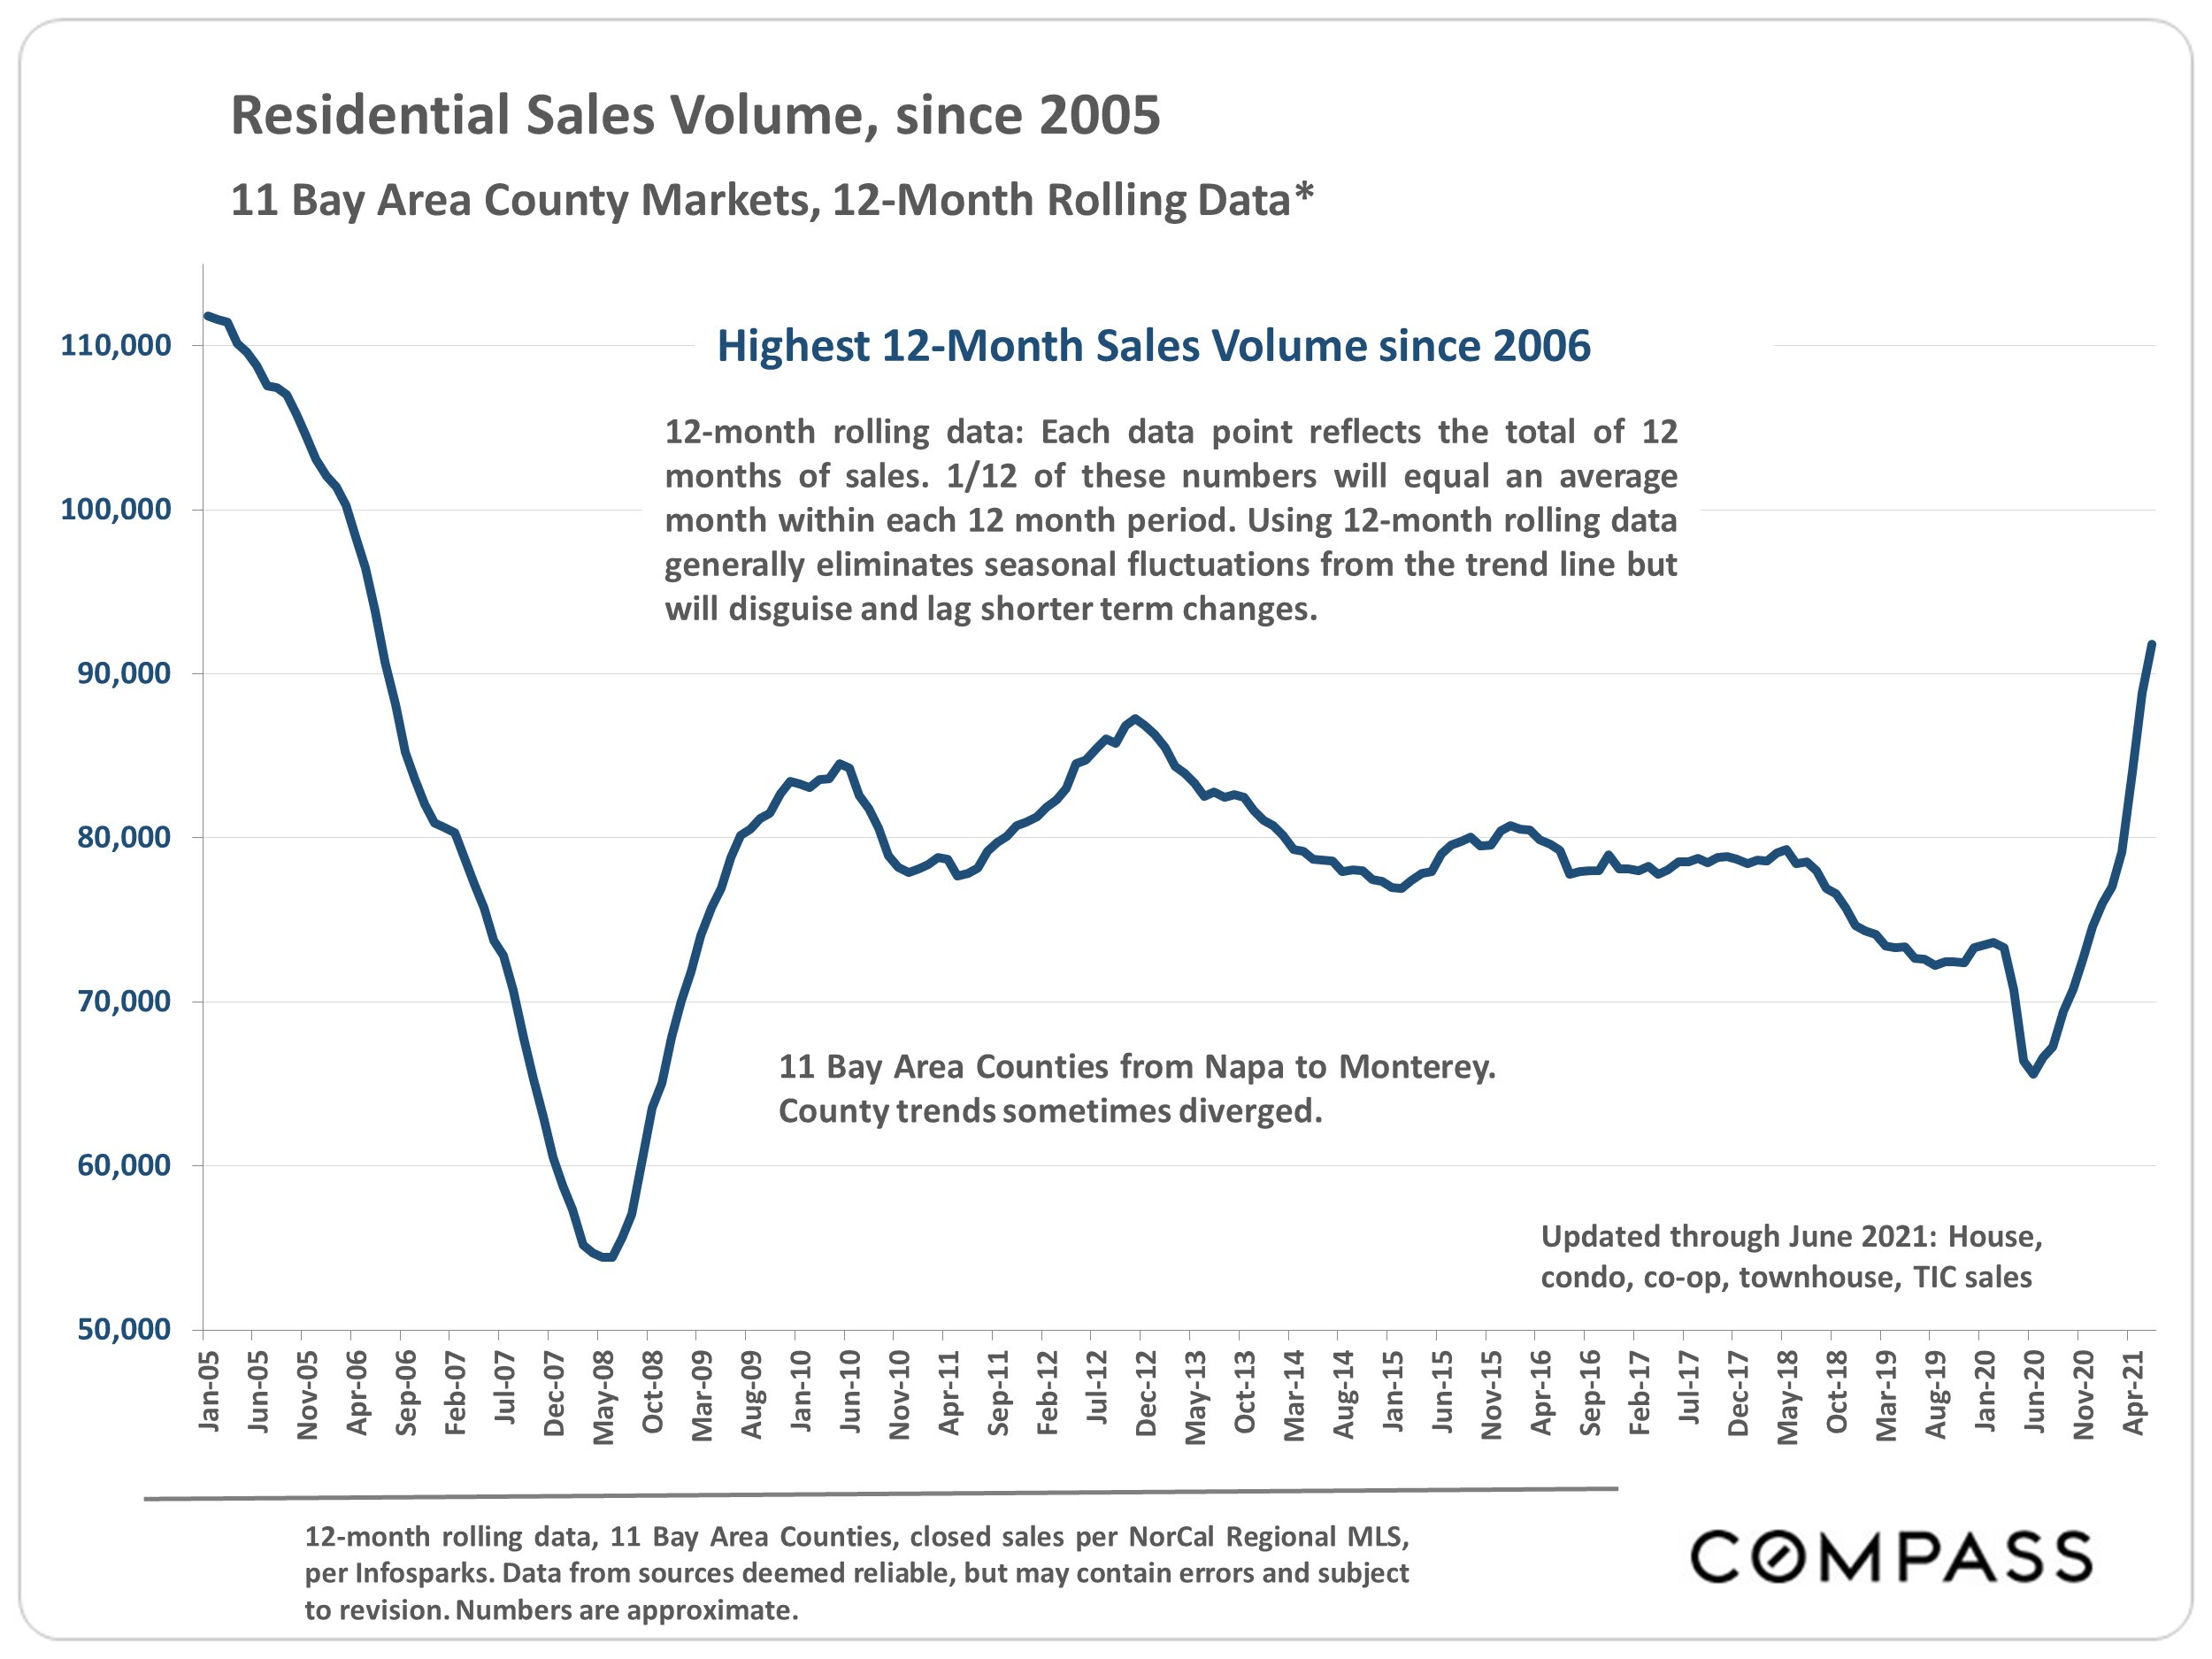
Line chart of Bay Area residential sales volume from 2005 to 2021, with a sharp rise at the end.
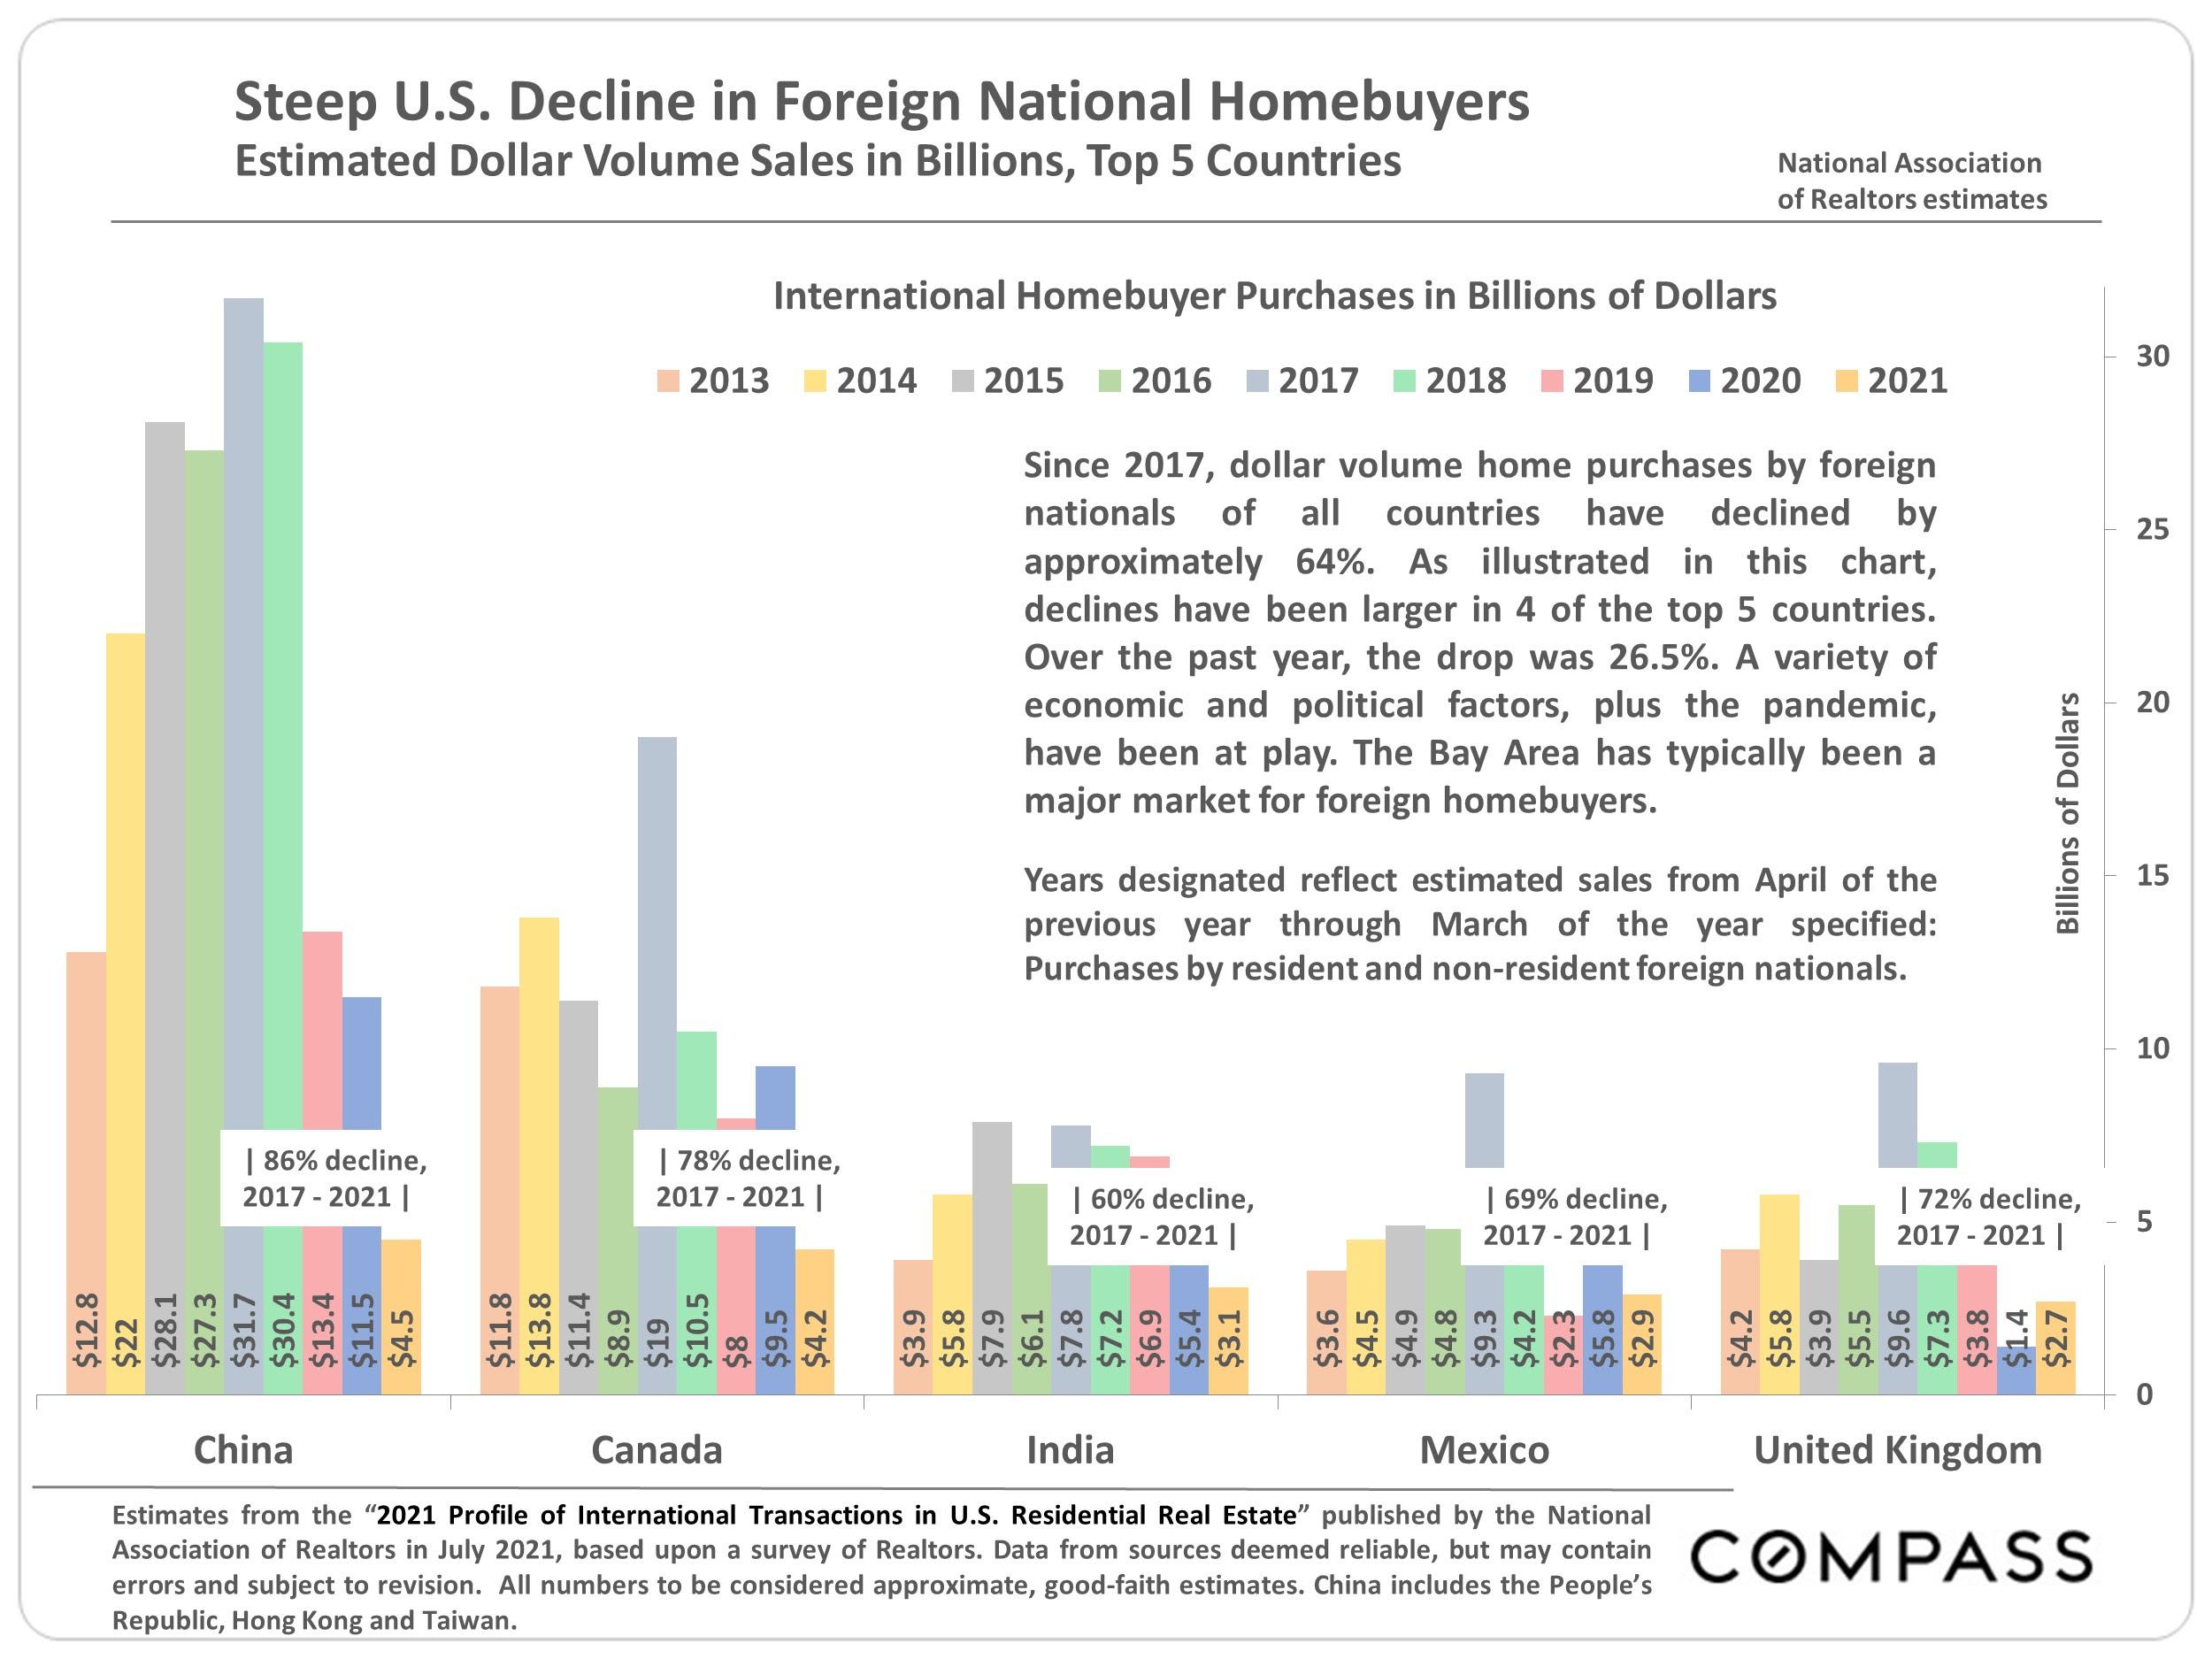
Chart of foreign homebuyer purchases by country, 2013–2021, with declines from 2017 to 2021.
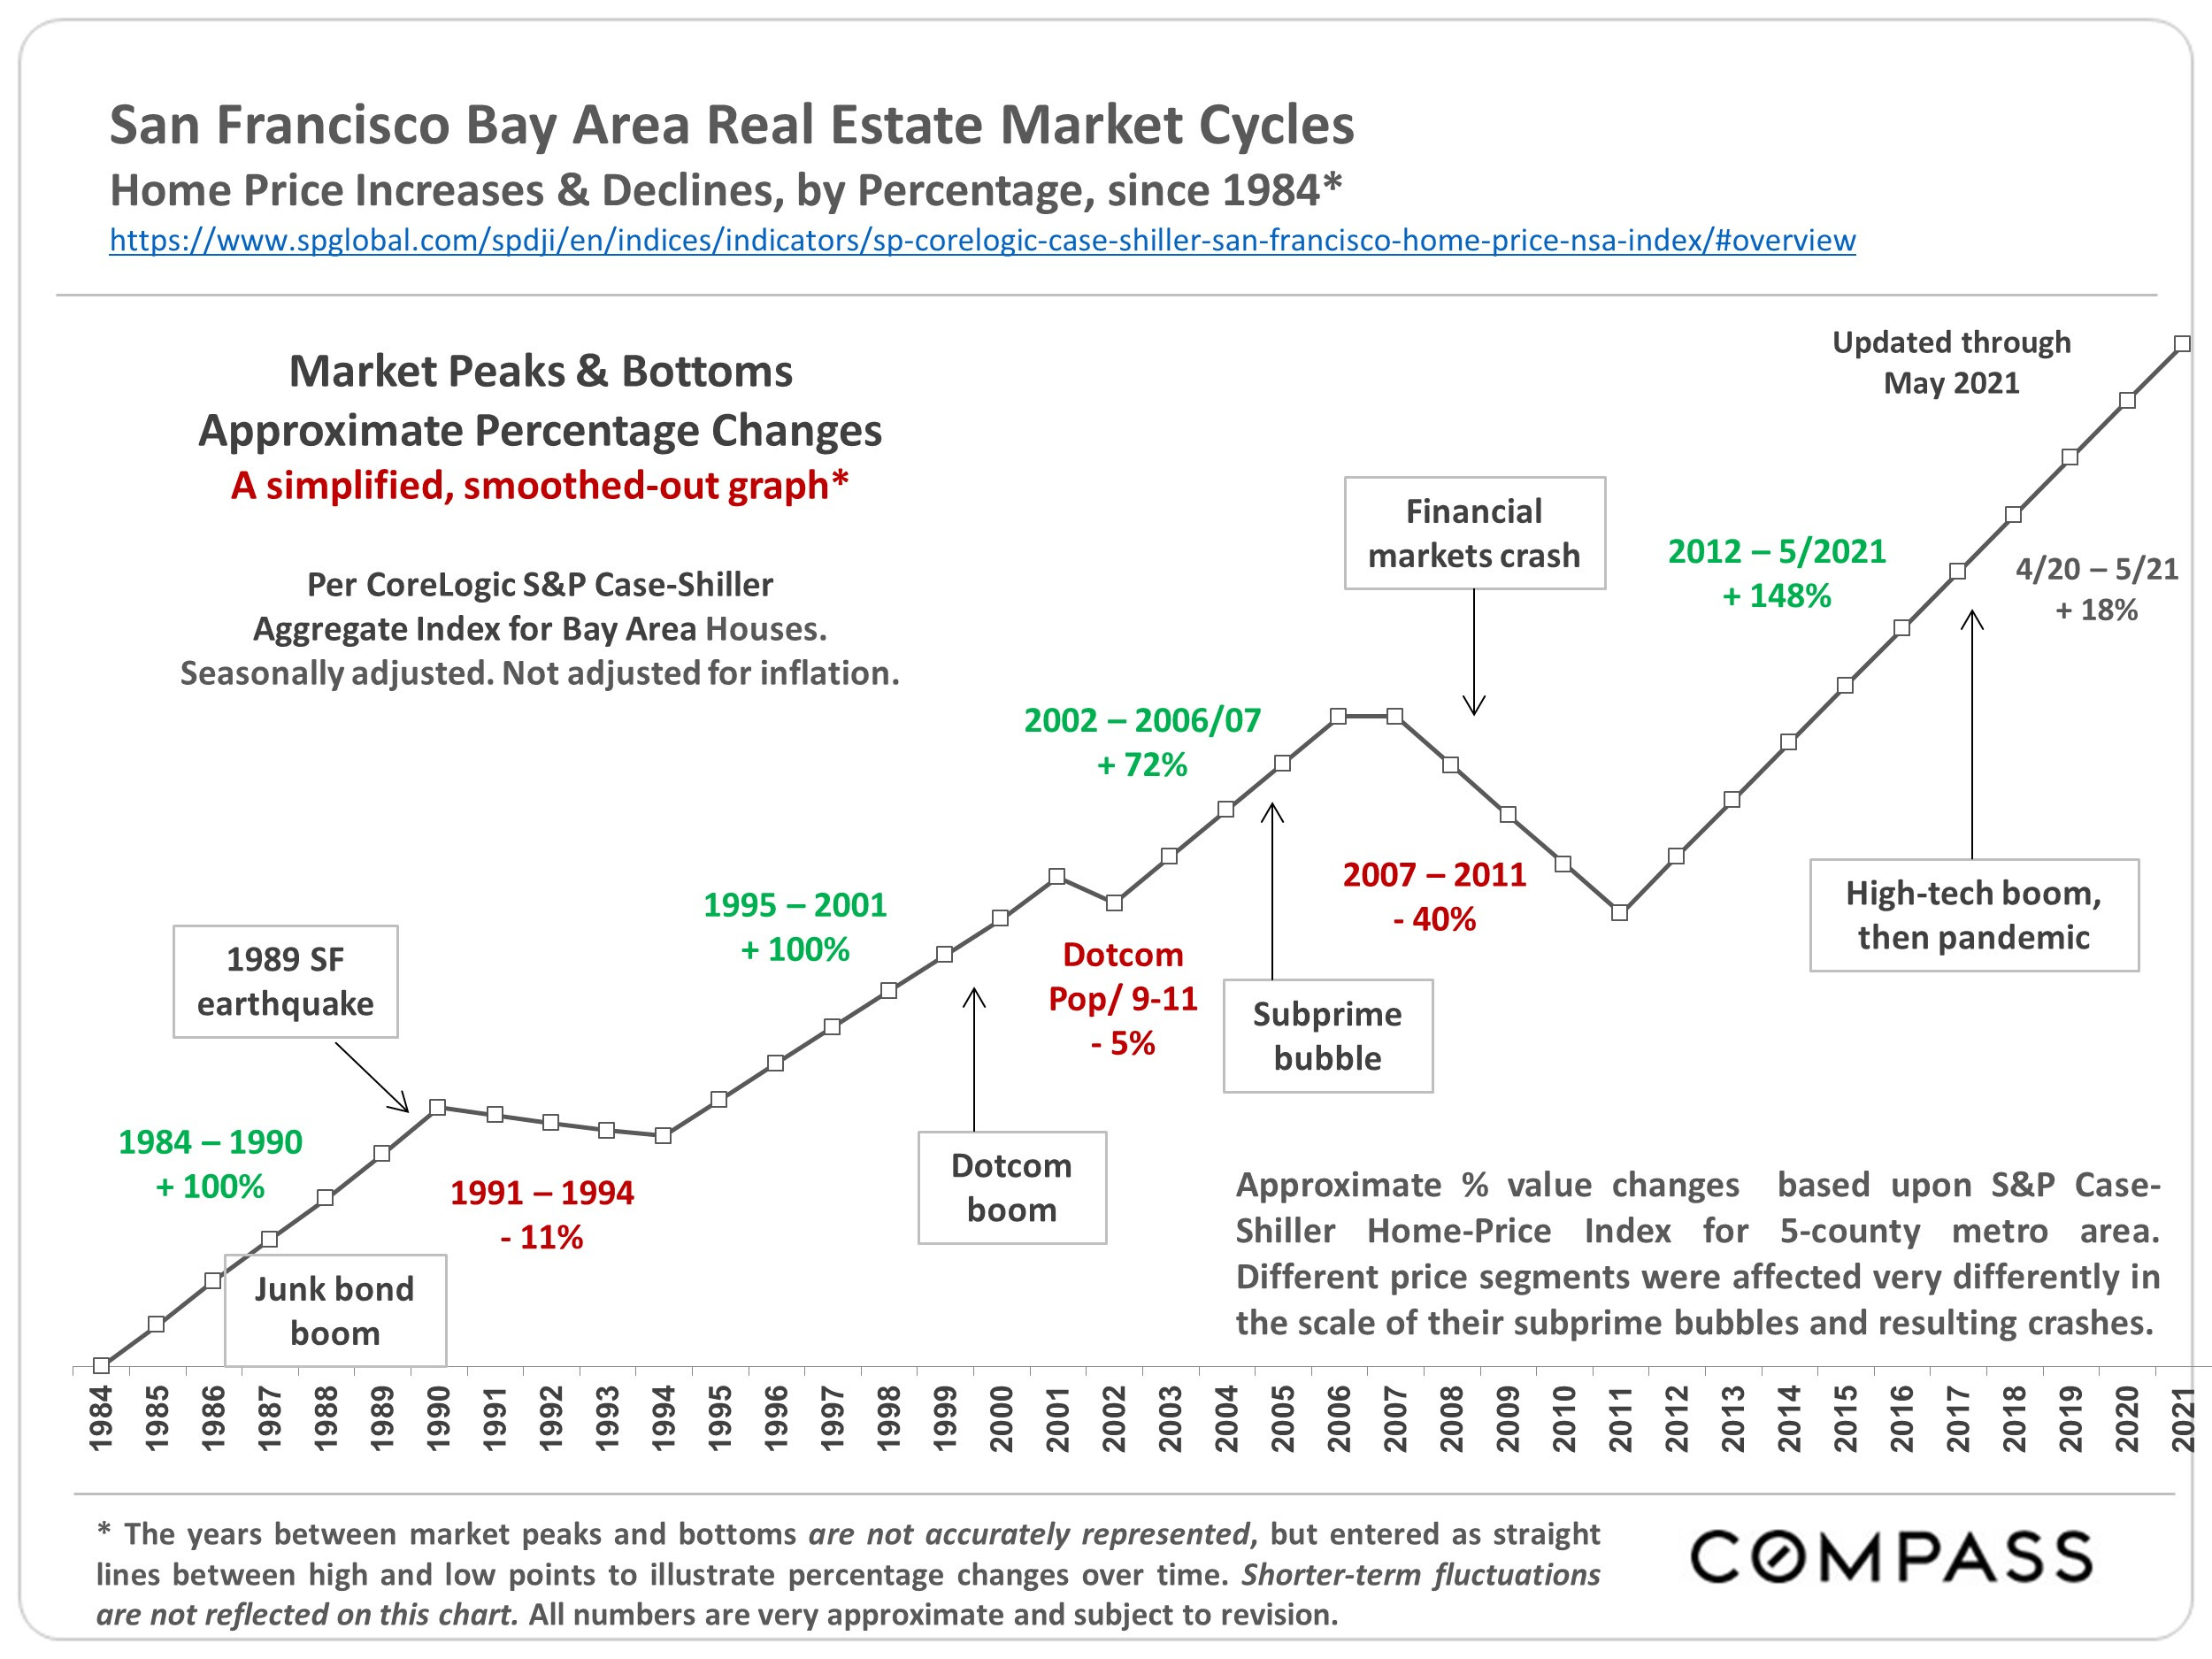
Chart of San Francisco Bay Area home price cycles from 1984 to May 2021, with percentage changes and market events.
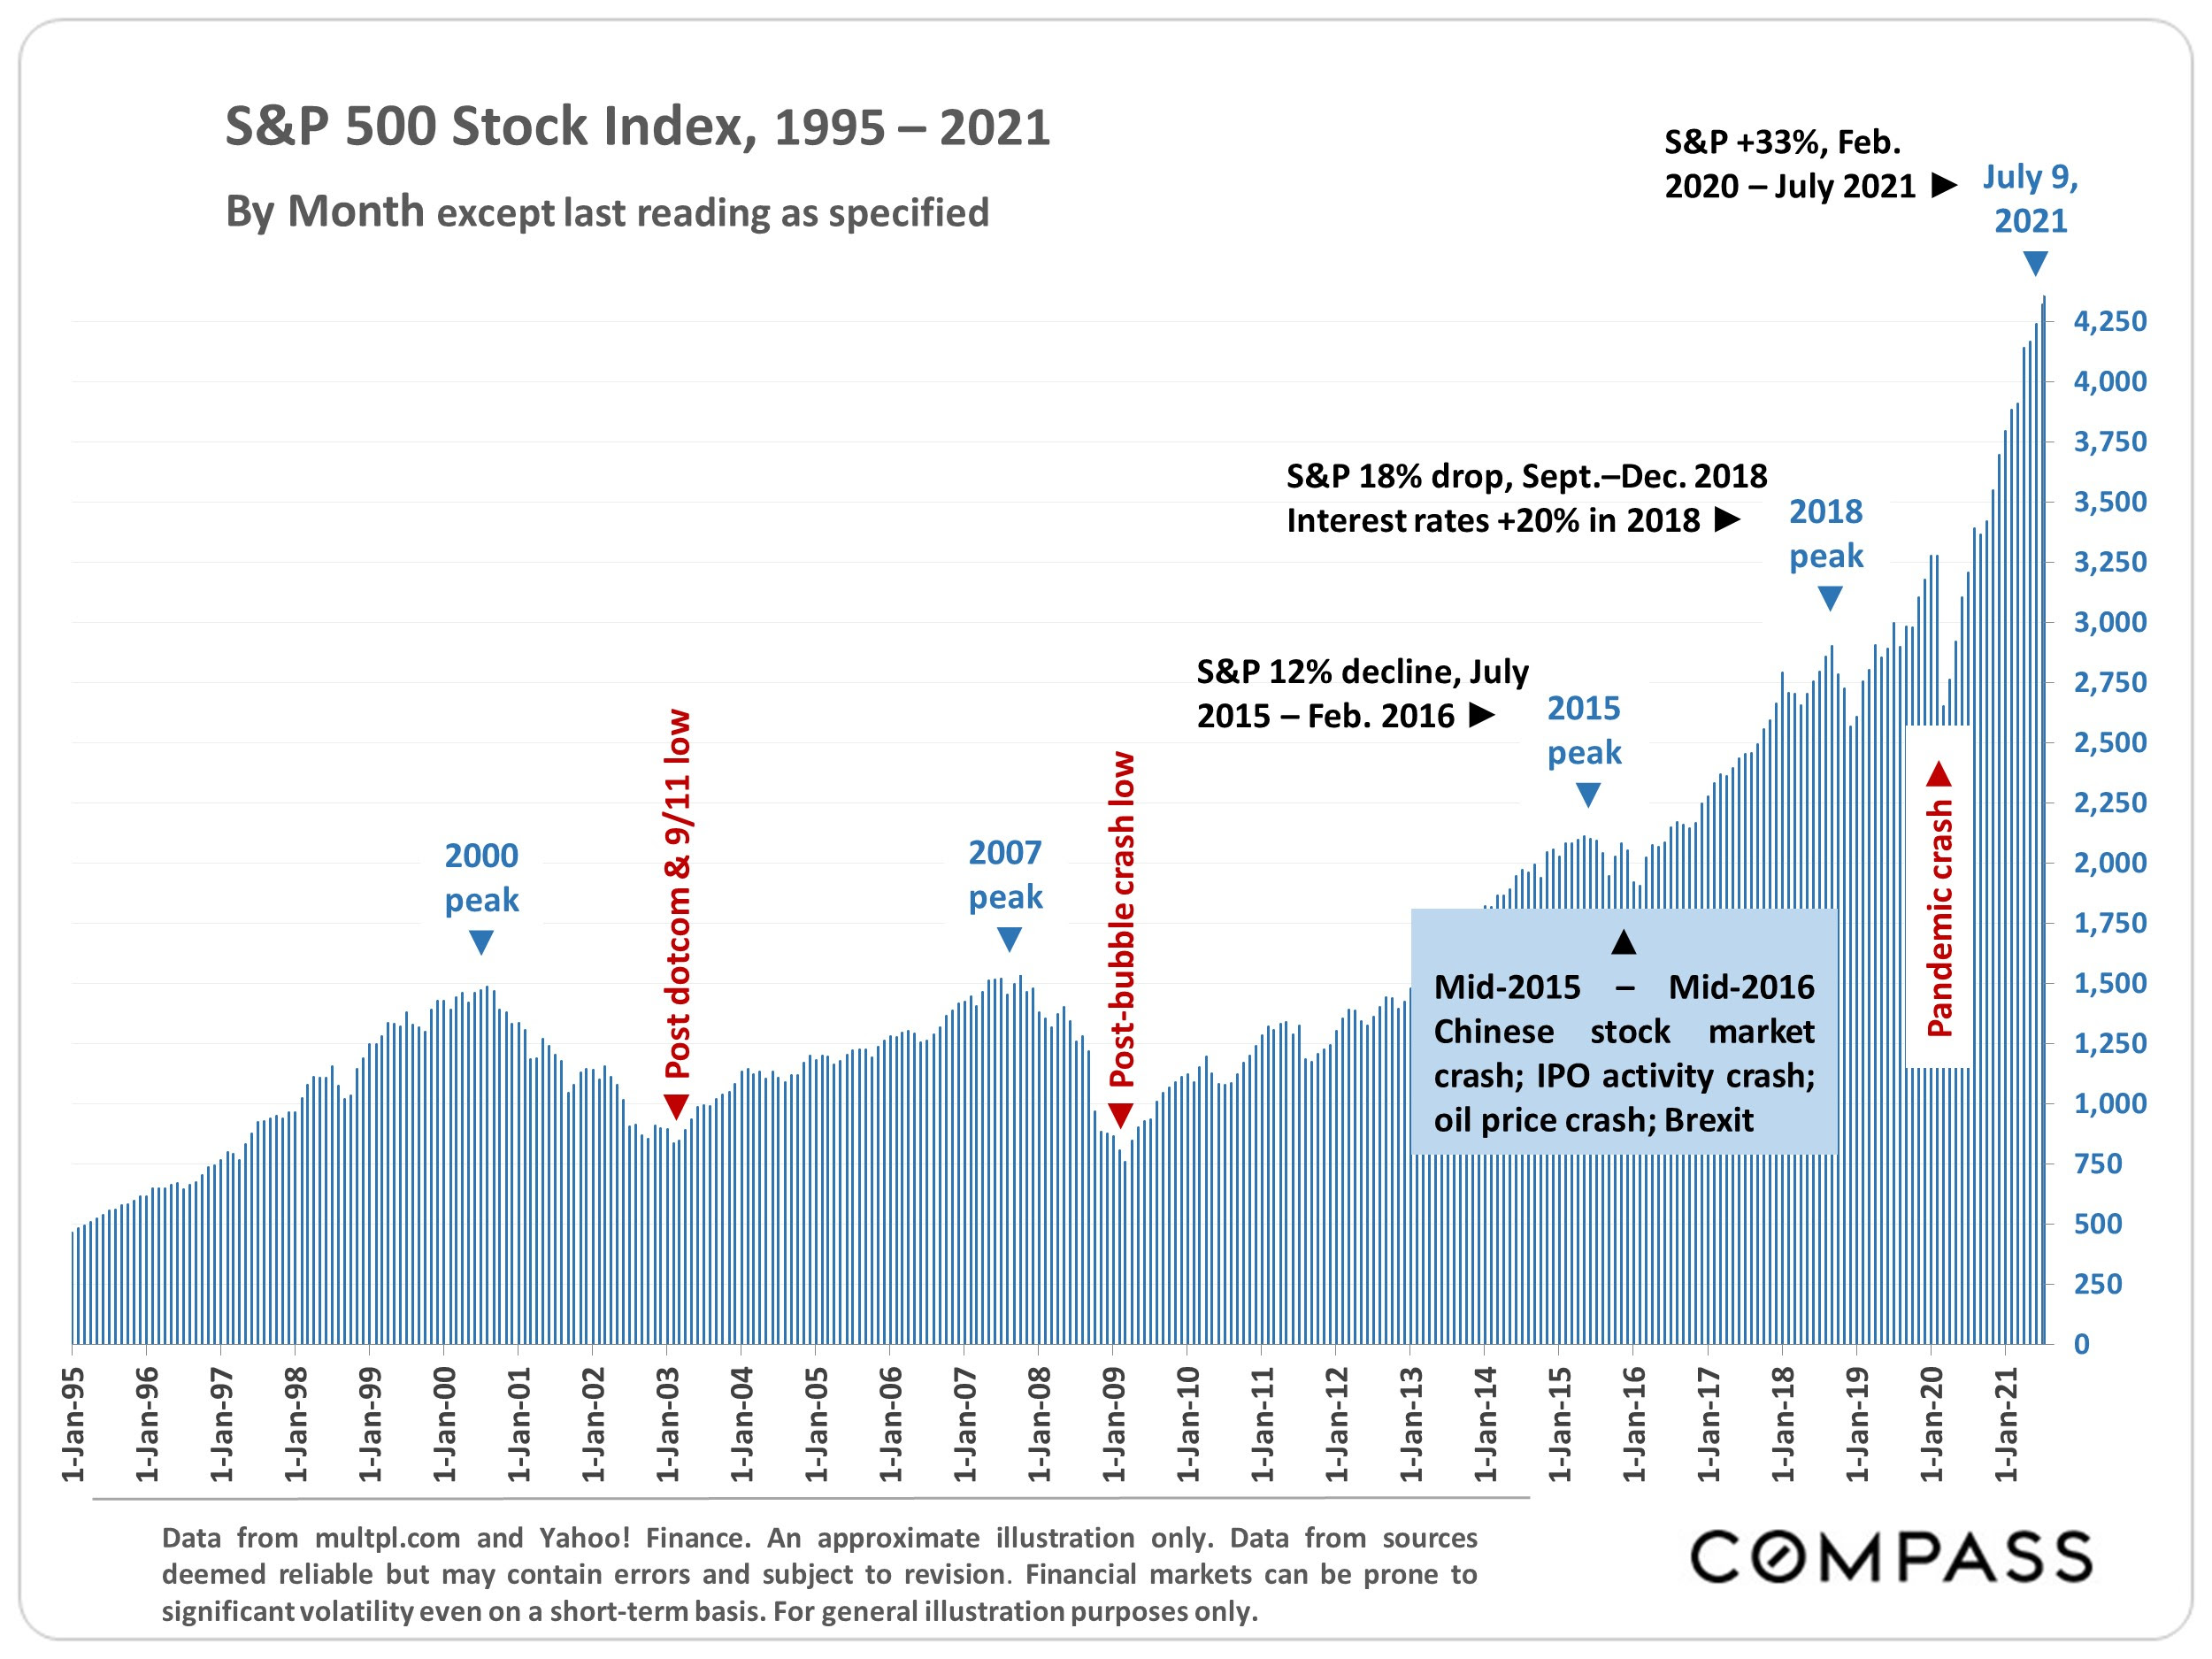
S&P 500 monthly index chart, 1995–2021, annotated with major market peaks and crashes.
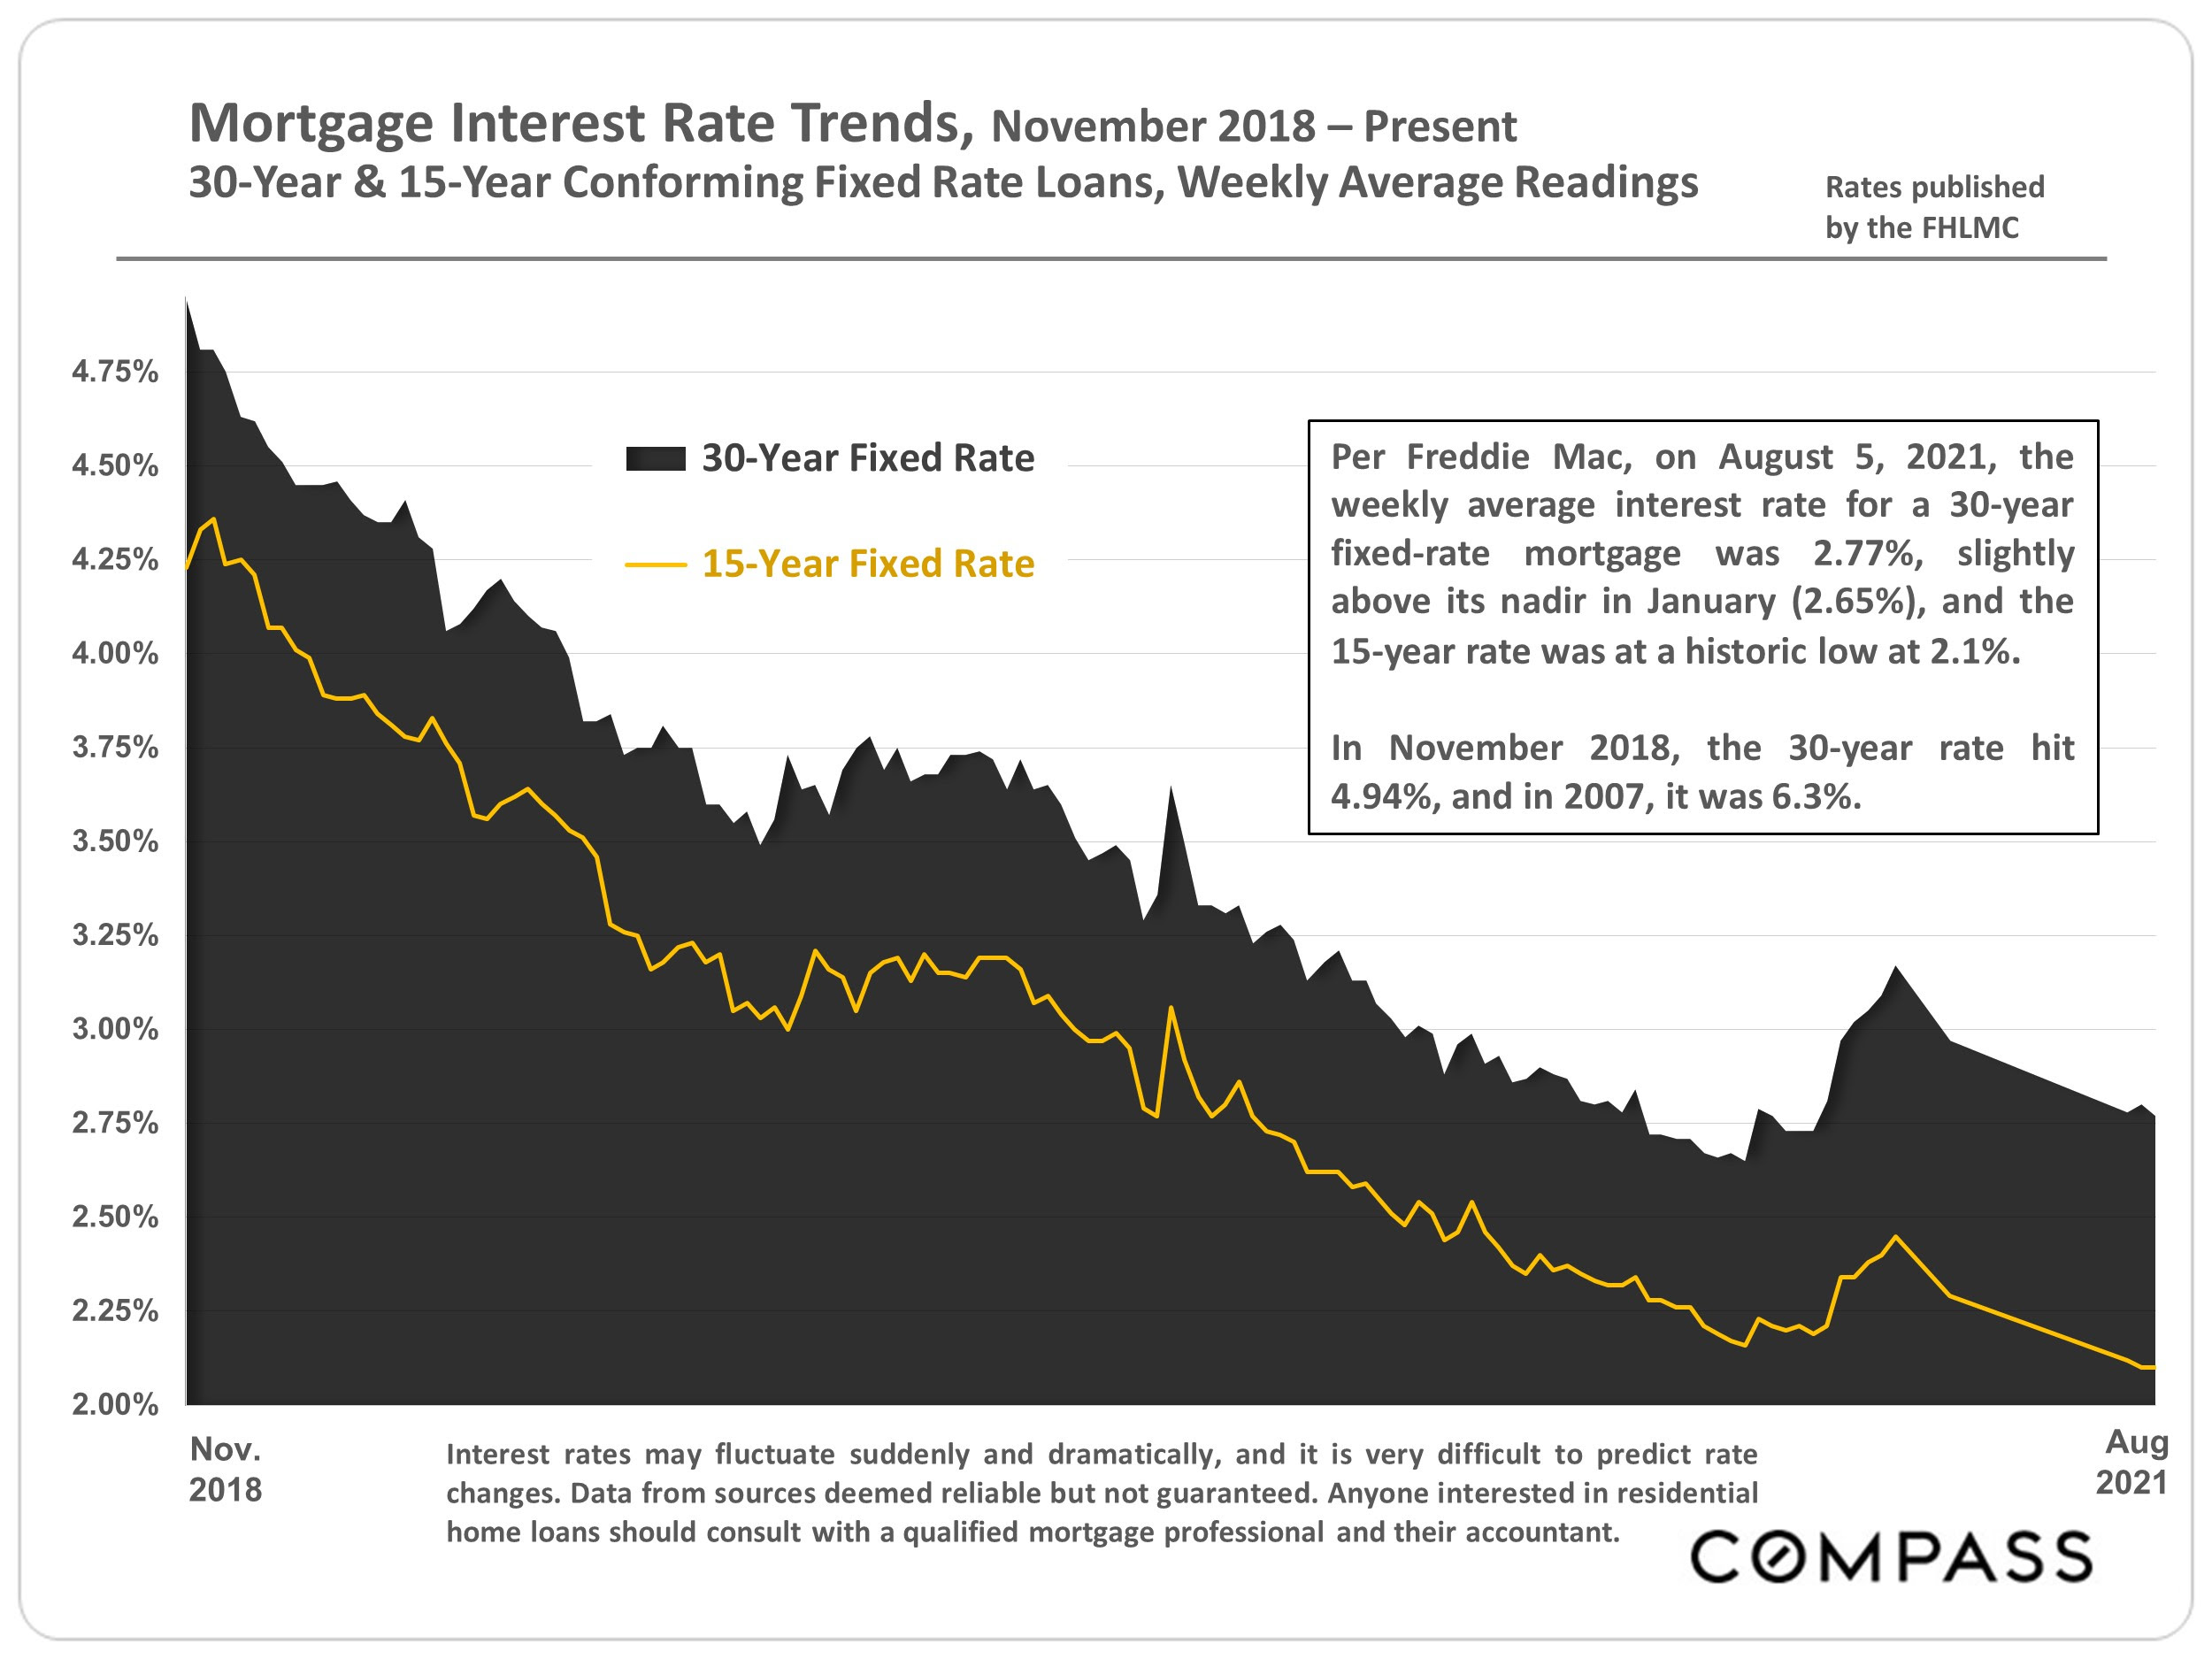
Chart showing 30-year and 15-year mortgage rates declining from November 2018 to August 2021.

See My Latest Listings Here!

and as always, 

contact me with your real estate questions, 

all the best,

Max
Smiling man in a light gray blazer standing against a white marble wall

Follow Us On Instagram