San Francisco Real Estate Market – Q2 2025 Snapshot
Despite widespread economic volatility across the Bay Area this spring,
San Francisco stood out with a surprisingly resilient and robust housing market.
-
-
-
- Home Prices on the Rise:
-
-
-
-
-
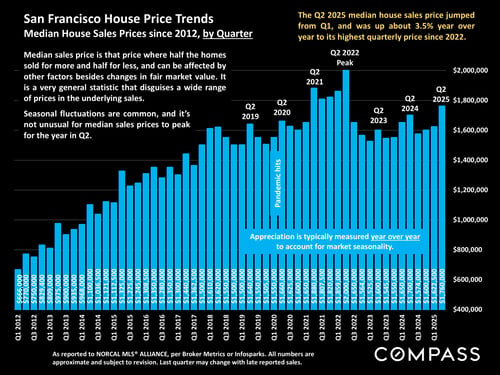
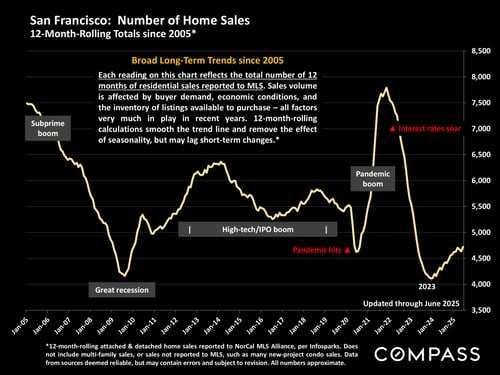
- Median house prices climbed 3.5% year-over-year, reaching their highest point since the 2022 pandemic peak.
- Median condo prices jumped 10% year-over-year, showing renewed strength in this segment.
-
-
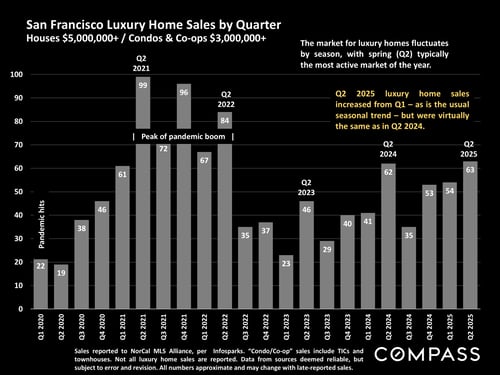
2. Strong Luxury Market:
Sales of homes over \$5M and condos over \$3M held steady compared to Q2 2024, with expected seasonal improvement over Q1.
-
-
-
- Buyer Demand:
-
-
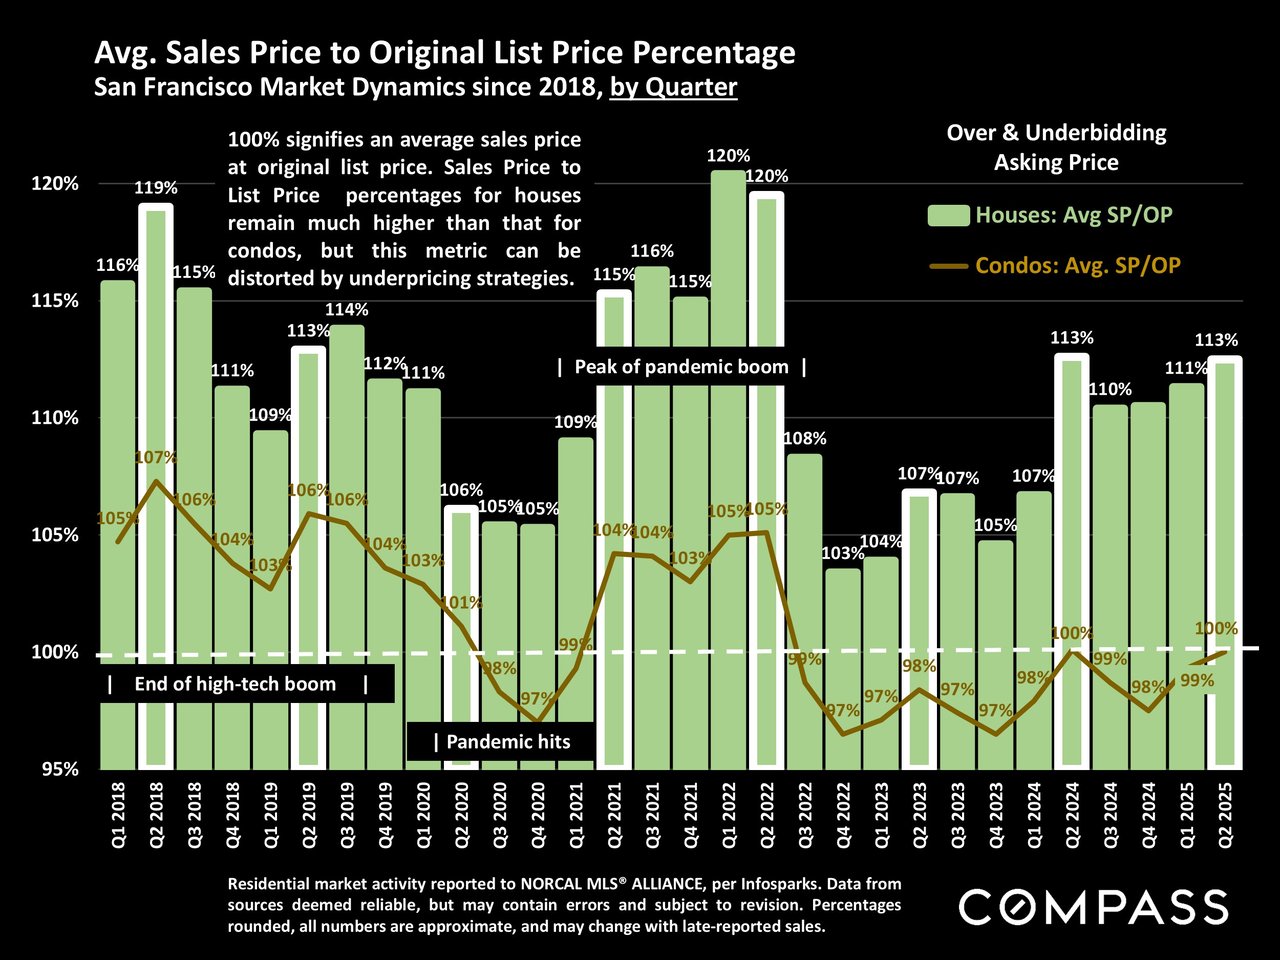
79% of homes and 40% of condos sold over asking price – a clear sign of competitive bidding, especially in the single-family market.
The average days on market for houses dropped to 22 days, indicating brisk activity.
June sales volume was up significantly year-over-year, despite a dip from May.
-
-
-
- Supply & Inventory:
-
-
Active listings dropped from May and were down year-over-year.
New listings rose 7.5% annually in June, following typical seasonal patterns.
3. Market Conditions
-
-
-
- Interest Rates:
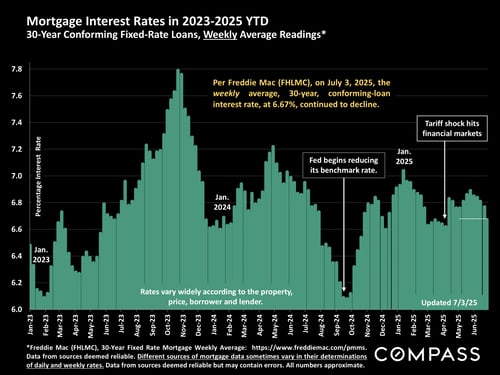
Mortgage rates continued a gradual decline, landing at 6.67% in early July, helping boost confidence. - Economic Backdrop:
Uncertainty remains elevated but is declining. Meanwhile, stock markets hit record highs, and consumer confidence is rebounding.
- Interest Rates:
-
-
4. Outlook
If macroeconomic conditions continue to stabilize, we could see even greater buyer activity in the second half of 2025. Sellers benefit from correct pricing and strong marketing, while buyers should stay alert for well-priced opportunities and act decisively.
Whether you're considering selling or buying, it’s a smart time to talk strategy.
Let’s connect!