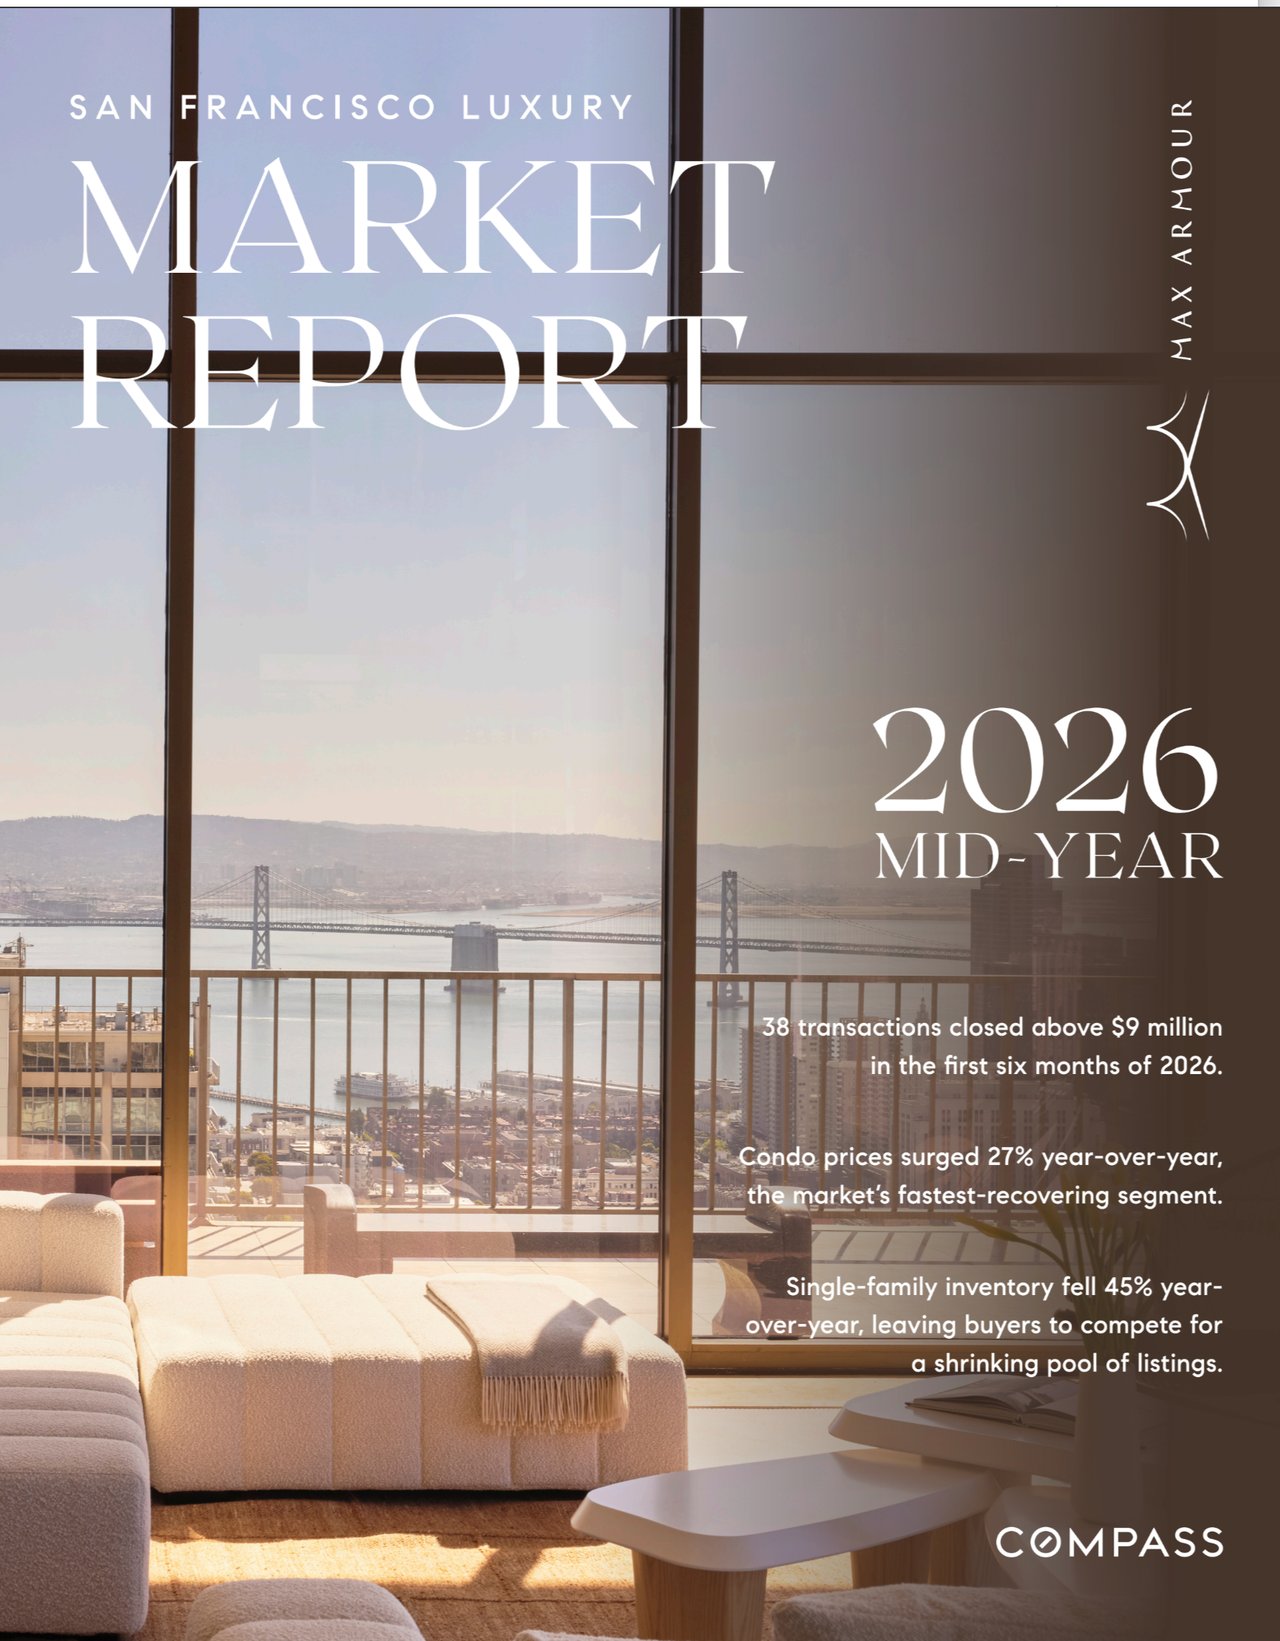

San Francisco Market Update - August 2026
Select macro-economic and demographic data for the country and the Bay Area – August 2026
July was the month San Francisco stopped moving with the rest of the country. The median single family sale price finished at $2.05 million, up 25.2% year over year, the strongest appreciation of any county in the region. San Mateo County came in second at roughly 10%. The other eight Bay Area counties were essentially flat, and so was the nation.
What makes that unusual is when it happened. Mortgage rates ended July at 6.77%, their highest level of the year, with inflation readings still well above target. In most markets, that cools demand. In San Francisco it did not, because the buyer here is not rate-sensitive in the usual way. Equity markets are up roughly 20% from a year ago, and that wealth effect is doing more work in our market than financing costs are.
The job picture reinforces how local this is. National payrolls fell by 23,000 in July, and hiring has averaged only about 60,000 new jobs a month nationally this year. The Bay Area has now posted four consecutive months of a shrinking labor market. Yet hiring inside the city, concentrated in AI and adjacent companies, keeps pulling buyers into a very specific slice of housing: family-ready homes in a handful of neighborhoods. Demand in the city is being fueled by job creation. Much of the surrounding region is not getting the same lift.
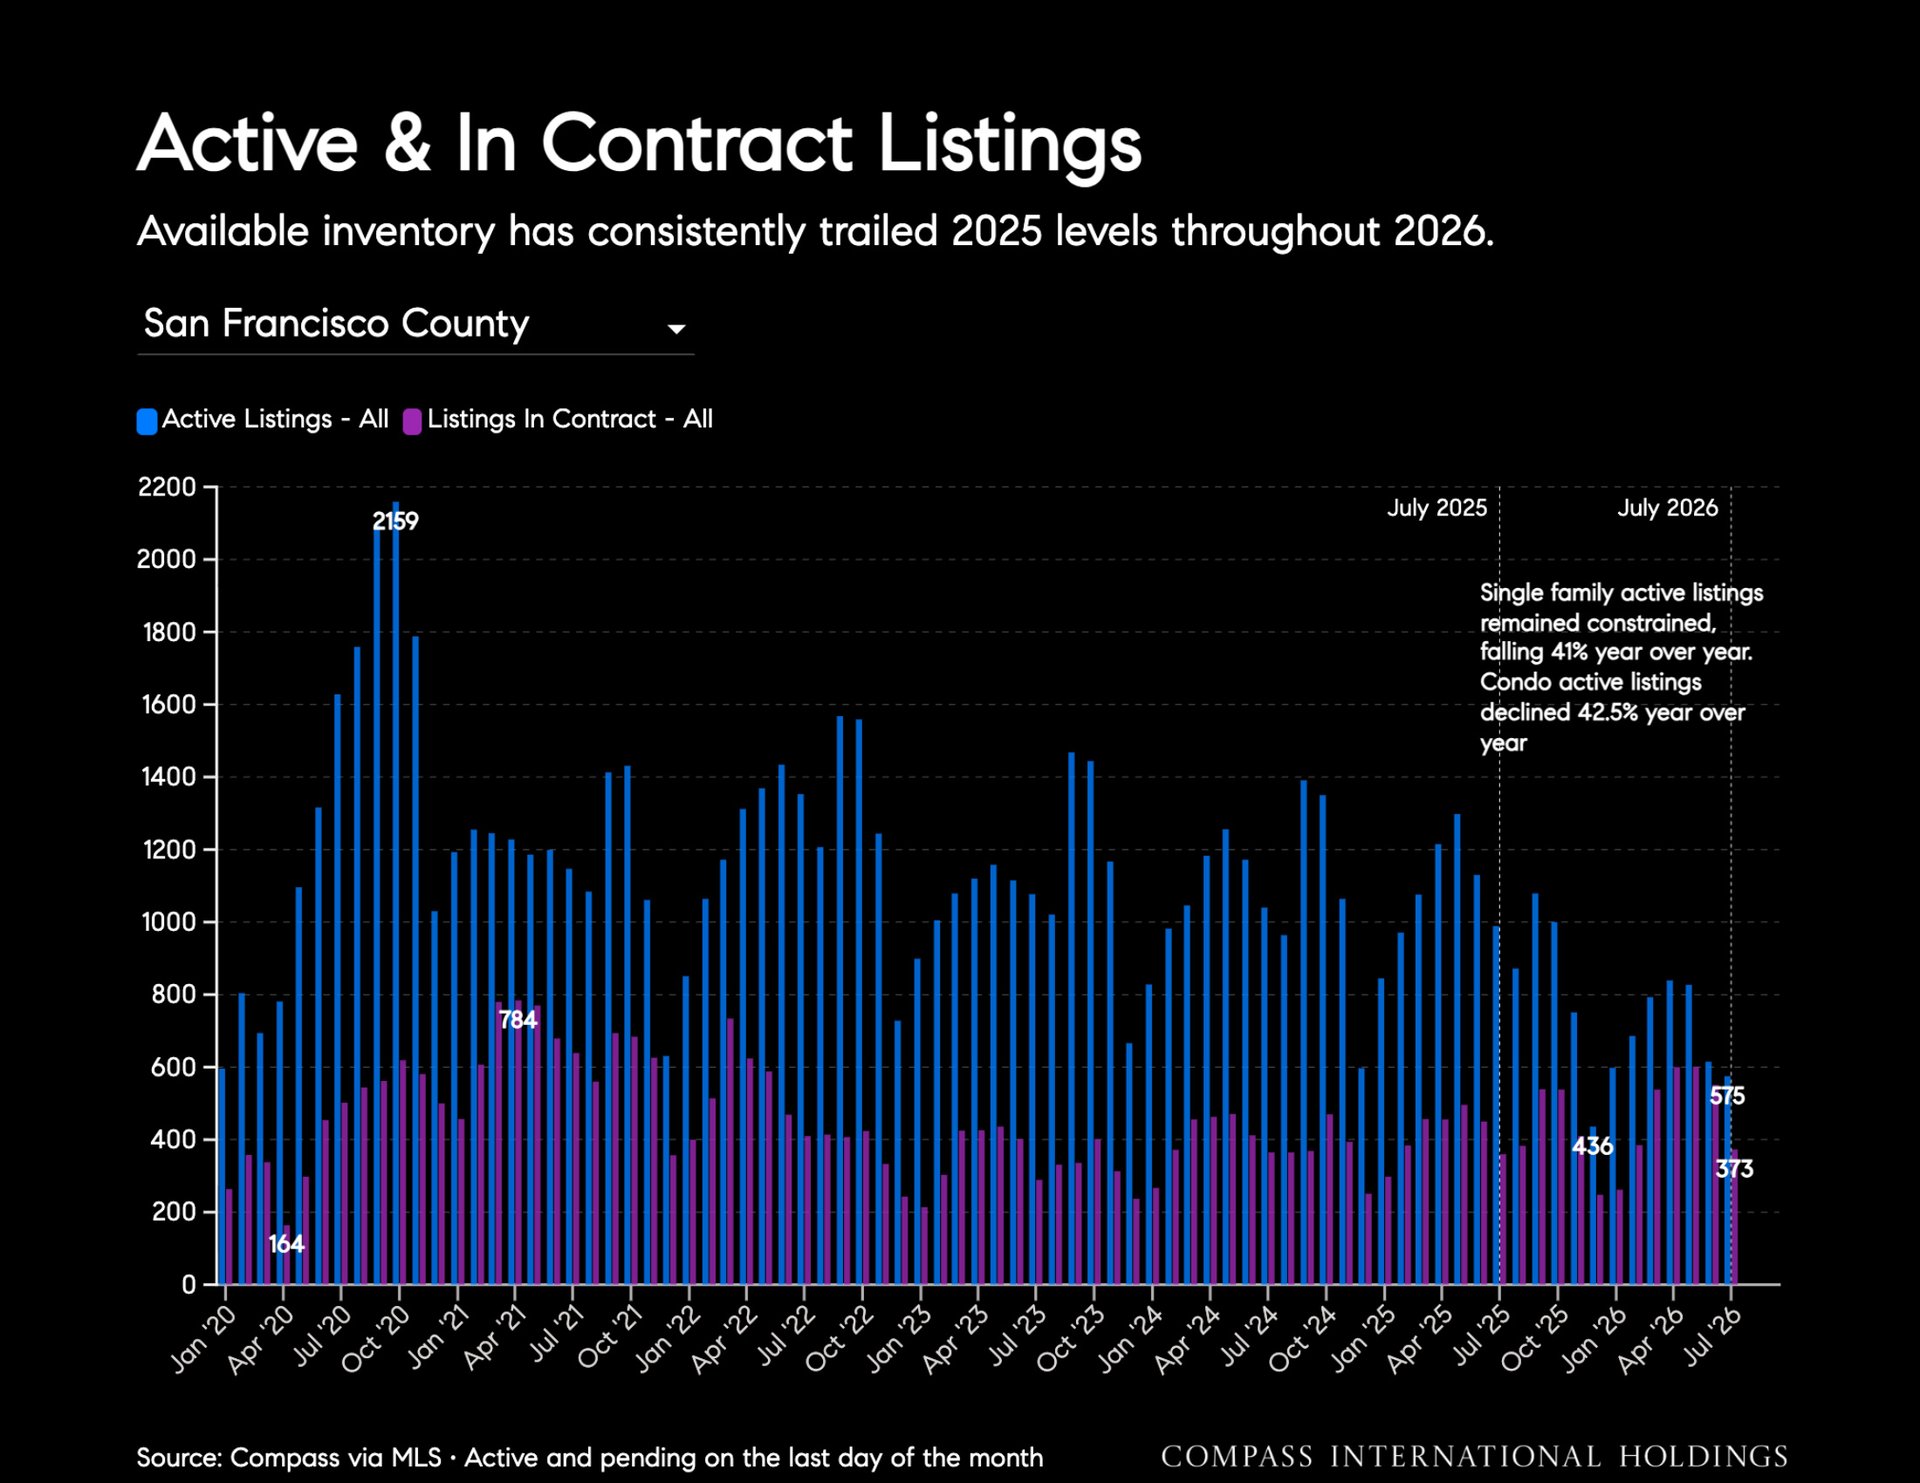
And there is almost nothing to buy. At the end of July there were 156 active single family listings in the entire city, down 40.9% year over year. Active condo listings fell 42.5%. That scarcity is the throughline for nearly every other number in this report.
Here's a snapshot of the SF housing market as of August 2026 (data through July):
Prices
- Median single family sale price: $2.05M, up 25.2% YoY, down 4.7% MoM
- Median price per sq ft, houses: $1,181, up 19.6% YoY
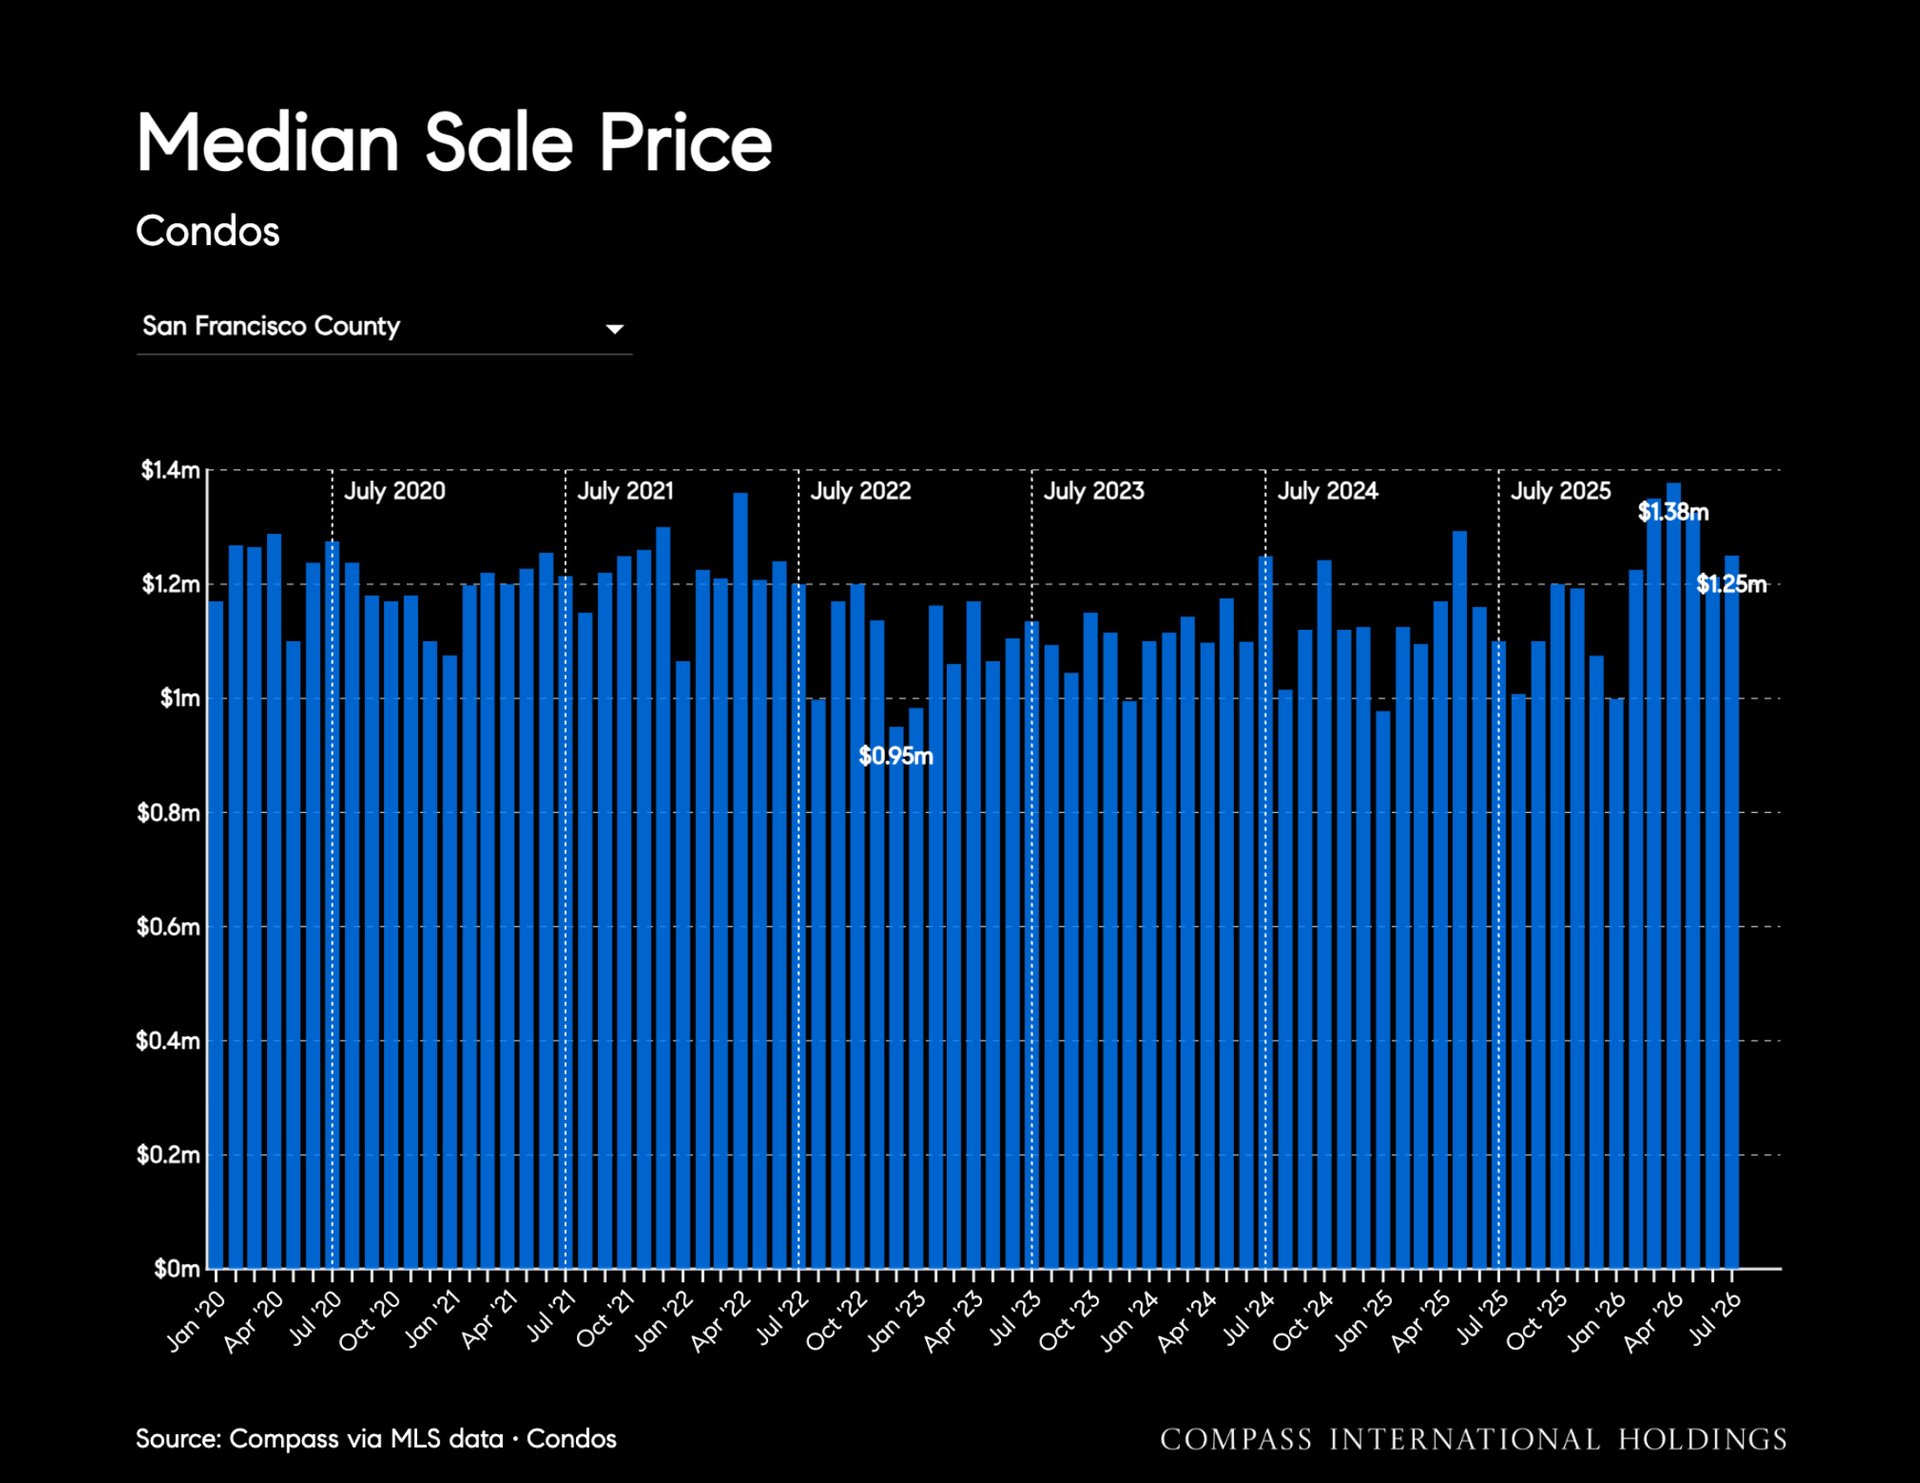
- Median condo sale price: $1.25M, up 13.6% YoY, up 3.1% MoM
- Median price per sq ft, condos: $1,103, up 13.1% YoY
Market Conditions
- Active single family listings: 156 citywide, down 40.9% YoY
- Active condo listings: 417, down 42.5% YoY
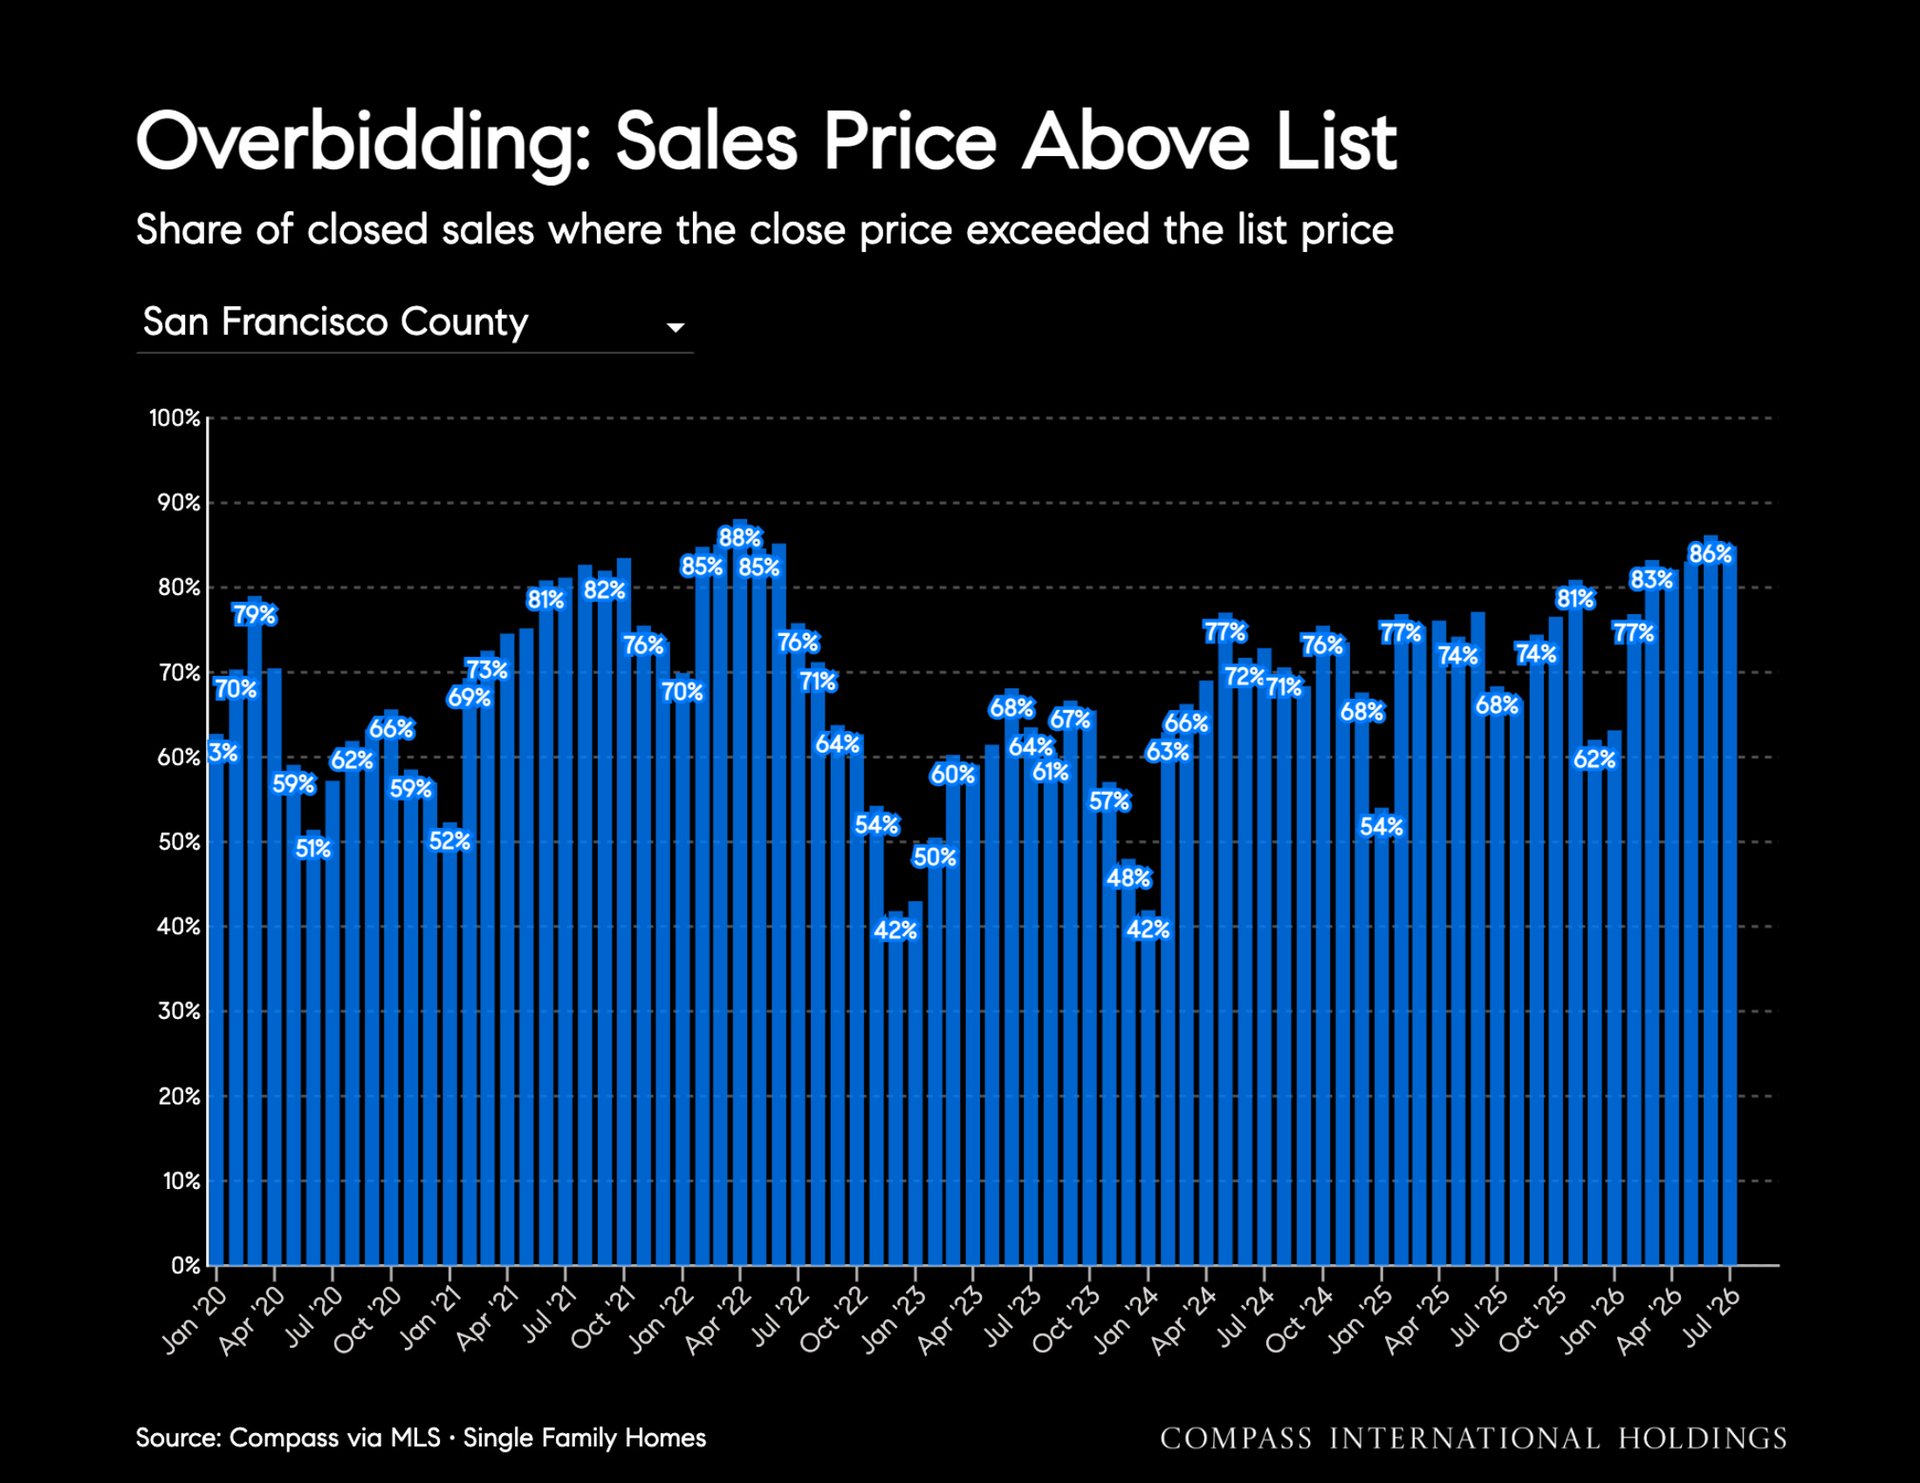
- 86% of closed single family sales exceeded list price
- Sale-to-list price ratio: 125%
- Average days on market: 28 for houses, 43 for condos
- Absorption rate: 65% of inventory in contract
- Closed sales: 173 houses (down 11.7% YoY), 276 condos (up 24.9% YoY)
San Francisco Has Decoupled From the Region
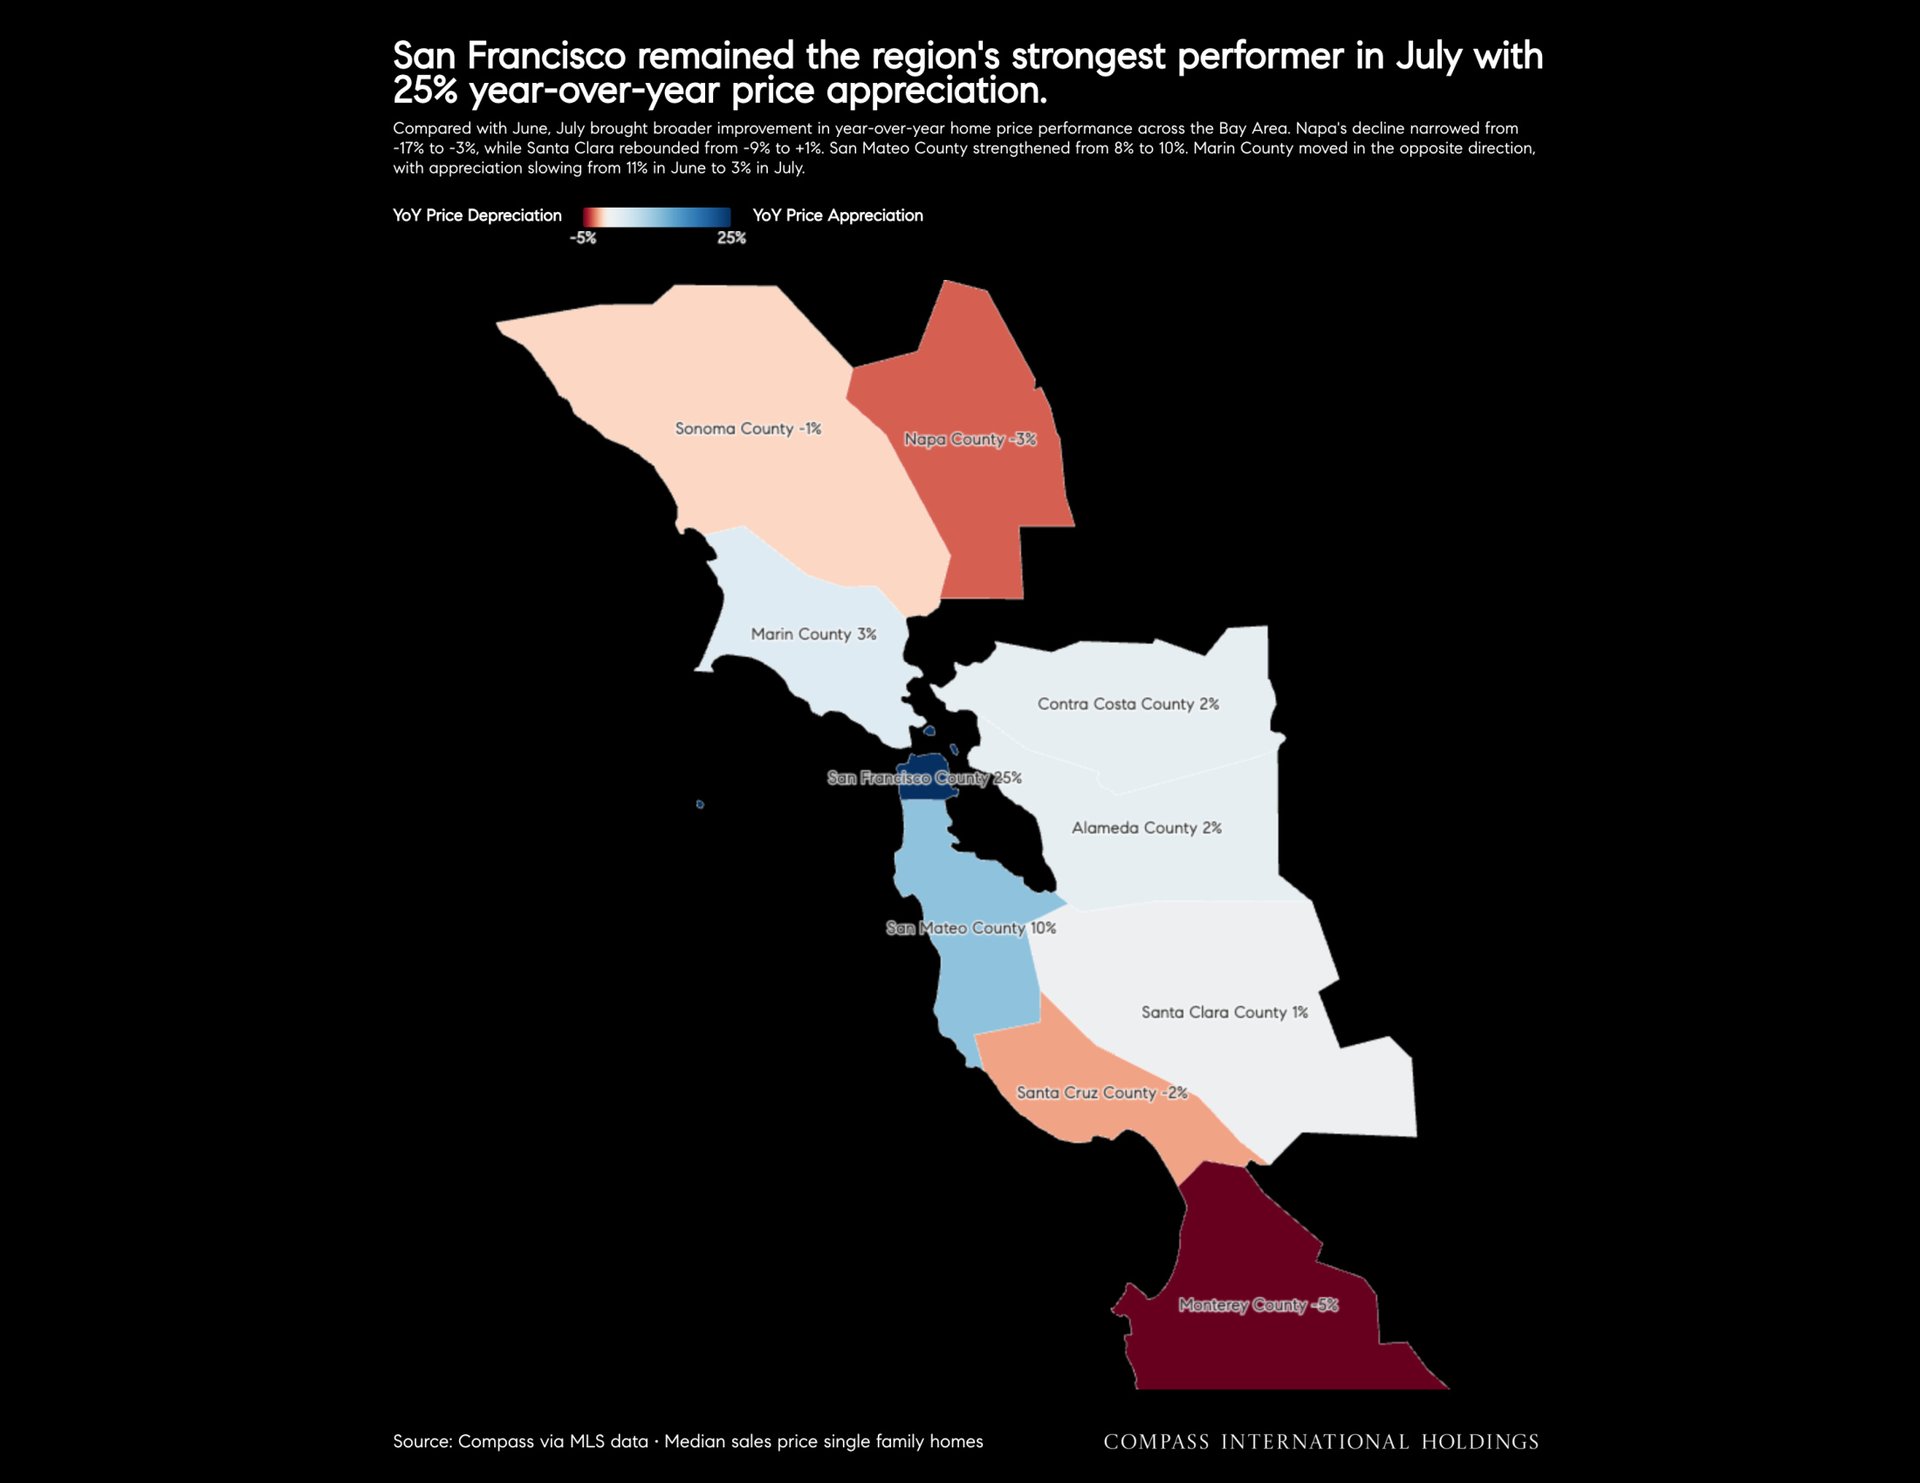
The clearest way to see this cycle is on a map. Year over year median price change for single family homes across the region in July:
- San Francisco: +25%
- San Mateo: +10%
- Marin: +3%
- Contra Costa and Alameda: +2%
- Santa Clara: +1%
- Sonoma: -1%
- Santa Cruz: -2%
- Napa: -3%
- Monterey: -5%
Marin is worth watching. It ran at 11% appreciation in June and slowed to 3% in July, a reminder that even the strong submarkets in this cycle are moving unevenly.
The Inventory Drought Deepened
A 41% year over year decline in active listings is the defining condition of this market. Sixty-five percent of everything available is already in contract. New listings are following their normal seasonal pattern, which means supply typically thins further through the back half of the year before the fall wave arrives.
The knock-on effect shows up in closed sales, which fell 35% from June. That is a supply number, not a demand number. Buyers are here. Houses are not.
Buyers Are Paying Up
Eighty-six percent of closed single family sales in July exceeded the asking price, one of the highest readings since 2022. The sale-to-list ratio reached 125%. Houses went into contract in an average of 28 days.
Price reductions stayed low at 17 for the month, which matters, because a high sale-to-list ratio can sometimes reflect aggressive pricing strategy rather than genuine demand. When overbidding is high and reductions are low at the same time, the competition is real.
The Condo Market Is Back in the Conversation
Six years of pressure appear to be easing. The median condo price reached $1.25 million, up 13.6% year over year, with closed sales up 24.9%. Condos are now selling 38% faster than they were a year ago, at 43 days on average.
At the top of the condo market, Cow Hollow led on price per square foot at $1,585, followed by Pacific Heights at $1,359 and Russian Hill at $1,280. Buyers priced out of an almost empty single family market are finding their way here, and the inventory drought applies to condos as well.
On the North Side
Trailing twelve month appreciation tells a cleaner story than any single month. Pacific Heights is up 20.7% over the past year. Lower Pacific Heights is up 33.6%. Russian Hill posted the highest single family price per square foot in the city at $1,929.
The month itself was quiet by necessity. Pacific Heights had three active single family listings at the end of July. Not three on a block. Three in the neighborhood. When a market this significant runs on that little supply, monthly medians swing hard on the strength of one or two closings, and I would read the twelve month figures rather than the July print.
Looking Toward Fall
Inventory levels are at multi-year lows so I do expect sellers to try and take advantage. This fall selling season will be a wild ride. Stay tuned for live updates as we head into it.
For anyone weighing a sale, the combination on offer right now is rare: very little competition, a buyer pool sitting on liquid gains, and a seasonal window that opens right after Labor Day. For buyers, the advantage is in being fully prepared before the right property surfaces, because in this market it will not wait.
--> Read more in the complete August Real Estate Report
--> Marin County August Market Report
Whether you're considering selling or buying, it's a smart time to talk strategy.
Let's connect!
Max Armour
Luxury Real Estate Advisor · Compass
(415) 290-6058
maxarmour.com
891 Beach St, San Francisco CA 94109
Over $2.5 Billion in Sales · Top 1% of SF Agents · CA DRE# 01446122
Max Armour is a real estate agent affiliated with Compass. Compass is a licensed California real estate broker (CA DRE# 01527235). All material is intended for informational purposes only and compiled from sources deemed reliable but not verified. If your property is currently listed, this is not a solicitation.
Data from Compass / NorCal MLS Alliance through March 2026. Report created in good faith from sources deemed reliable but may contain errors and is subject to revision. Last period figures are preliminary estimates. All numbers approximate and may change with late-reported activity. Median sales price is that price at which half the sales occurred for more and half for less. Max Armour, CA DRE# 01446122. Compass California II, Inc., CA DRE# 01527235. Equal Housing Opportunity. Not intended as financial or legal advice.