Max Armour
March Marin Real Estate Market Report

Marin Report

Marin Real Estate Market Report
compass
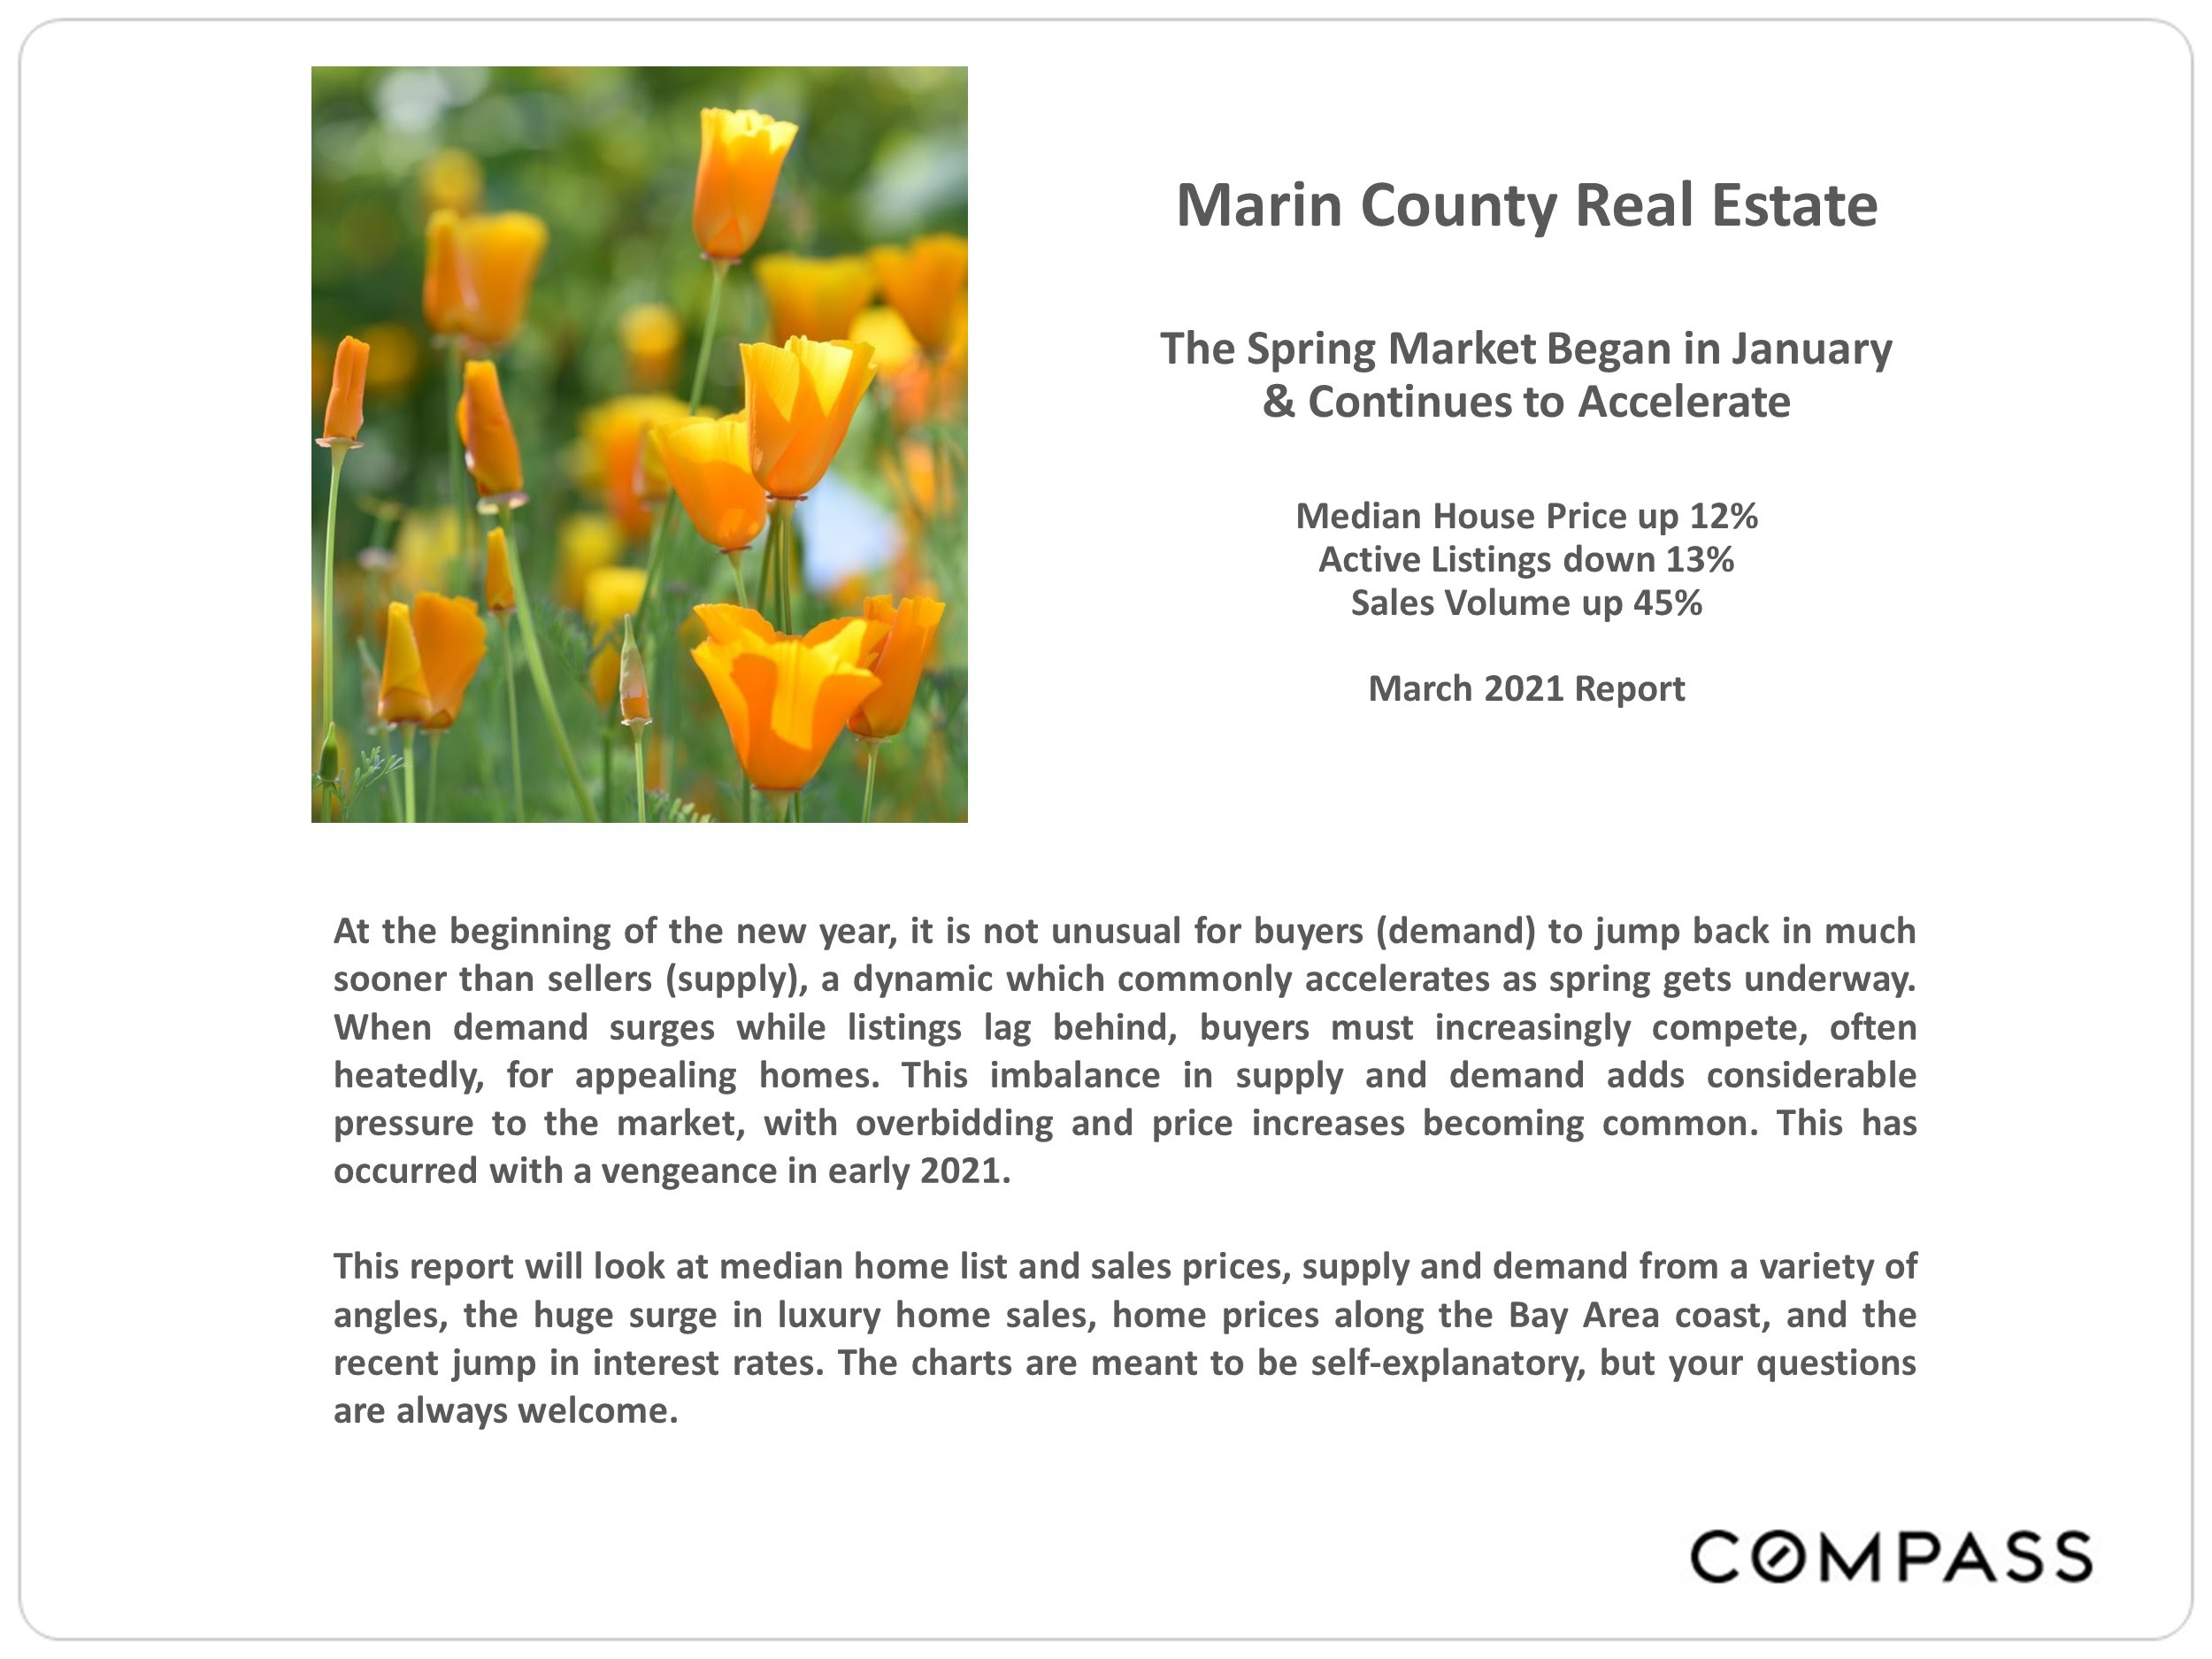
March 2021 Marin County real estate report: prices up 12%, listings down 13%, and sales volume up 45%.
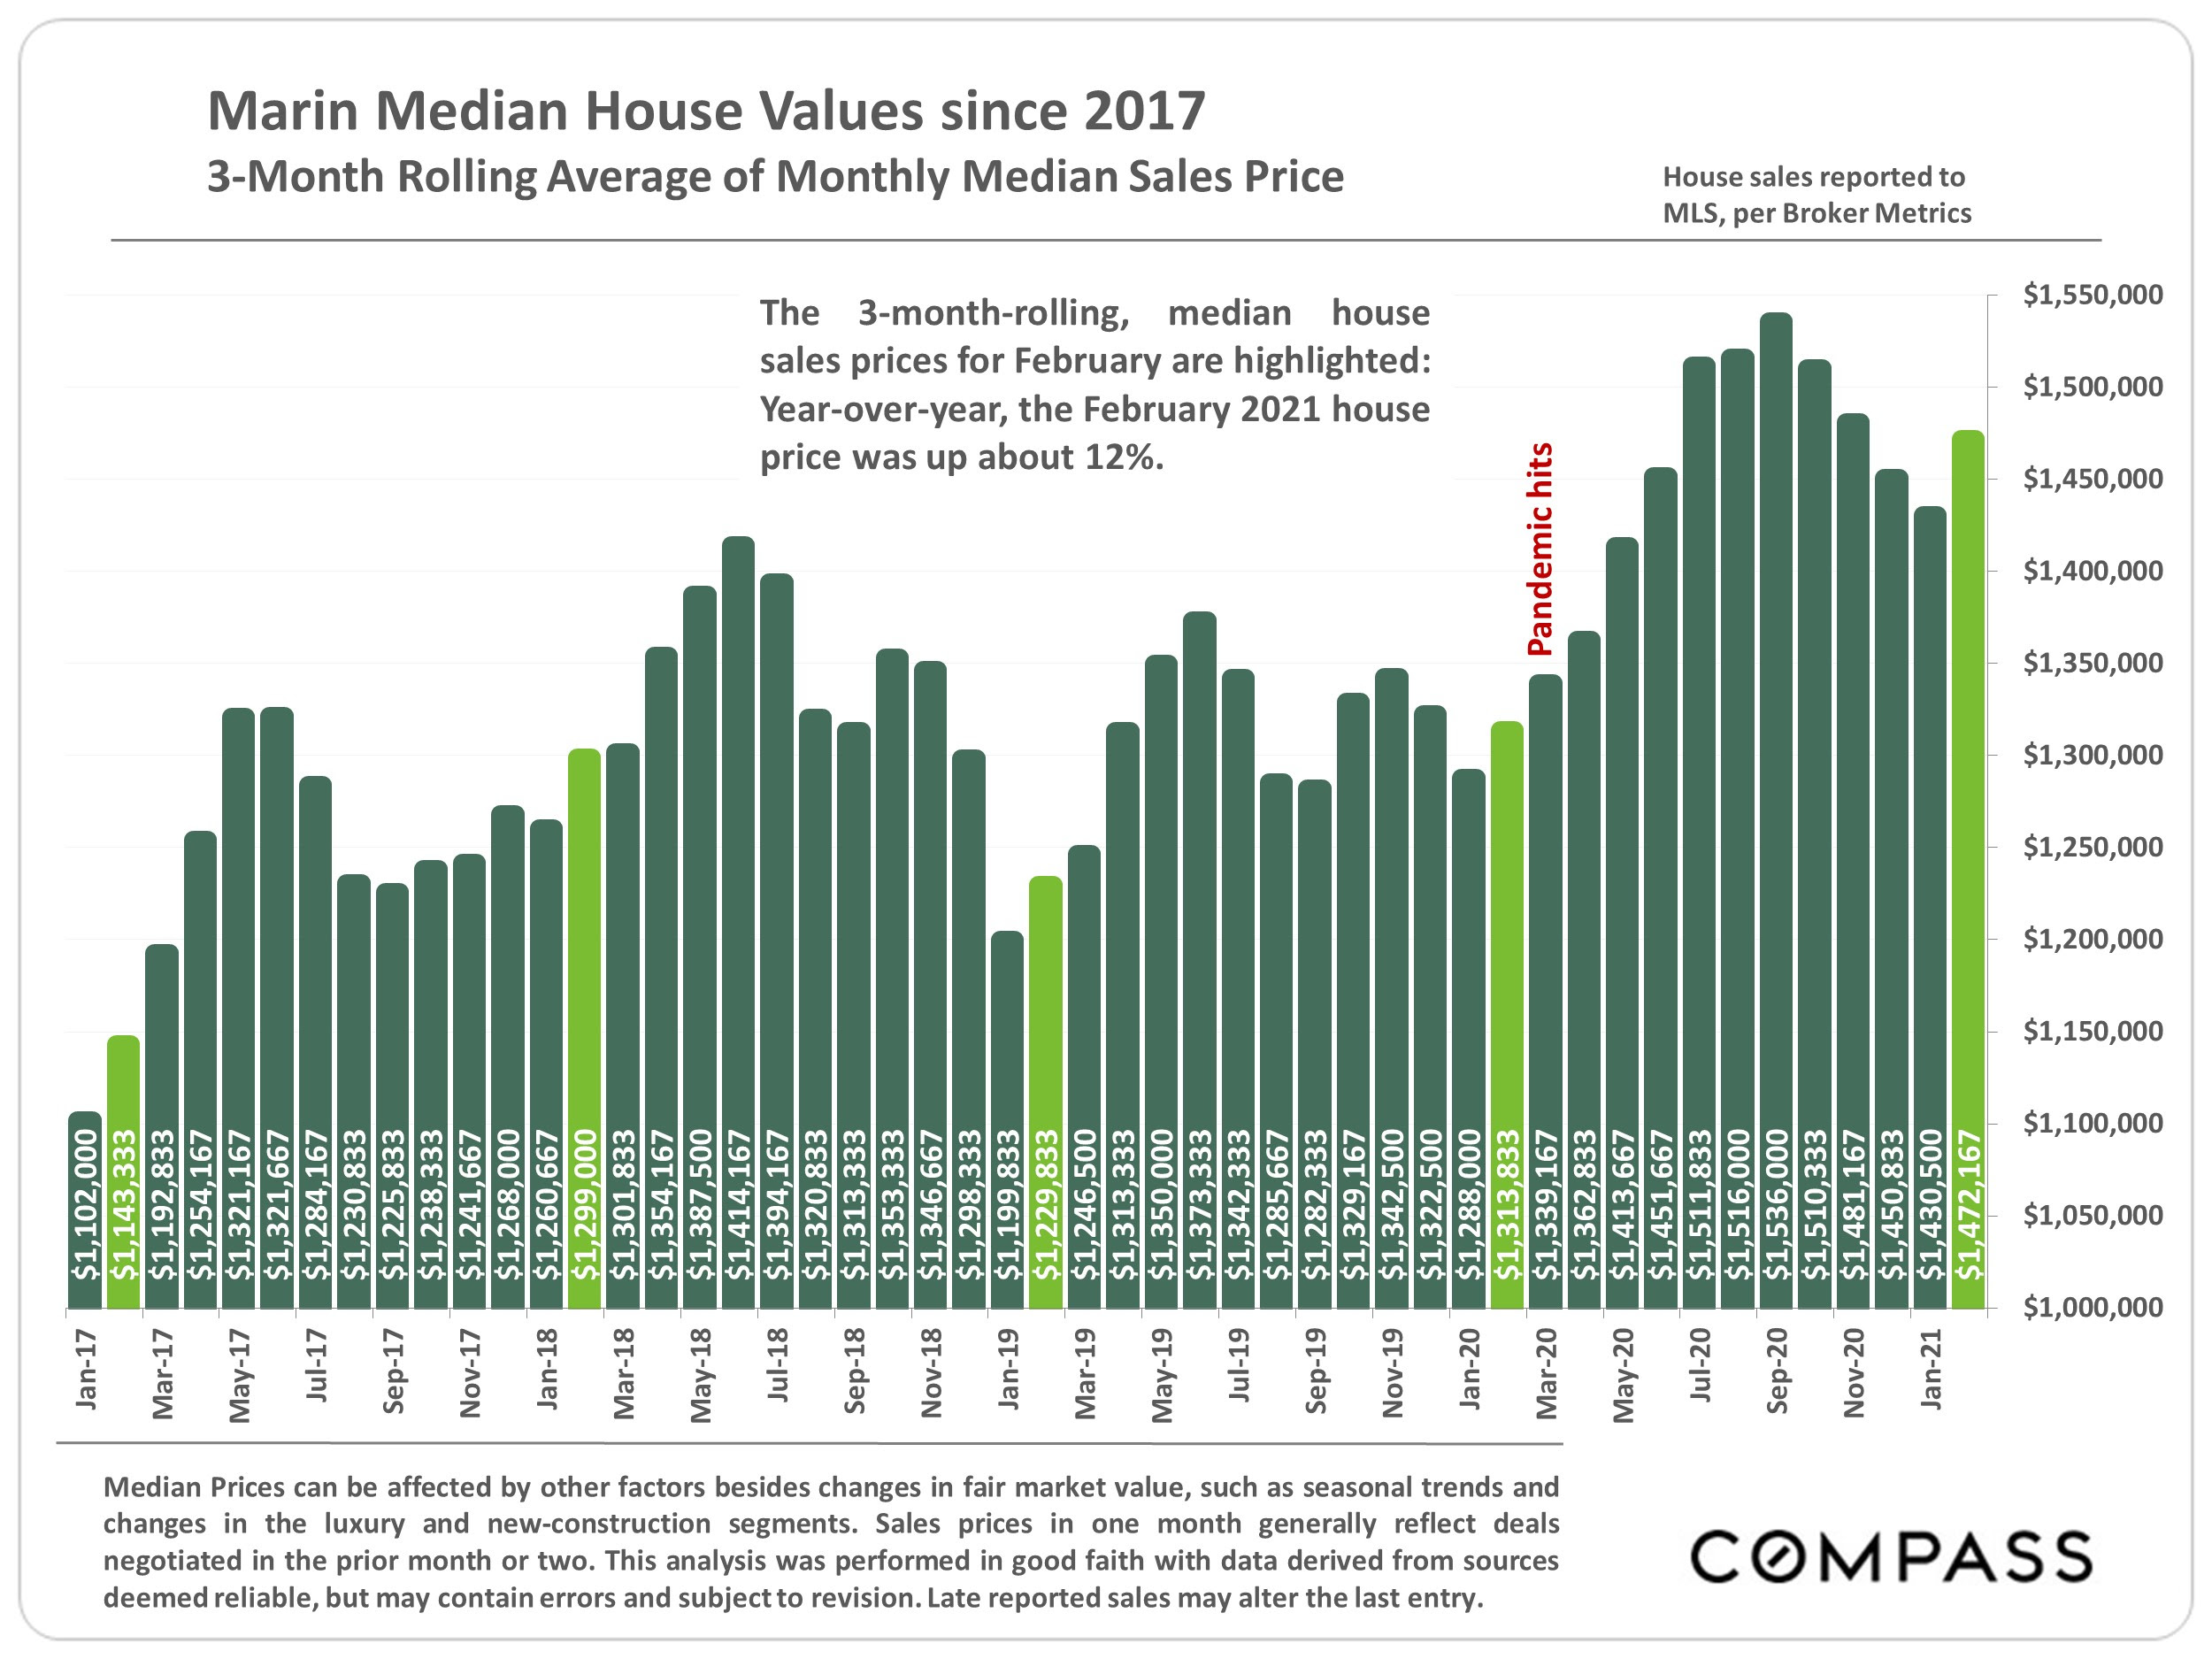
Bar chart of Marin median house values since 2017, with February 2021 highlighted at $1,472,167.
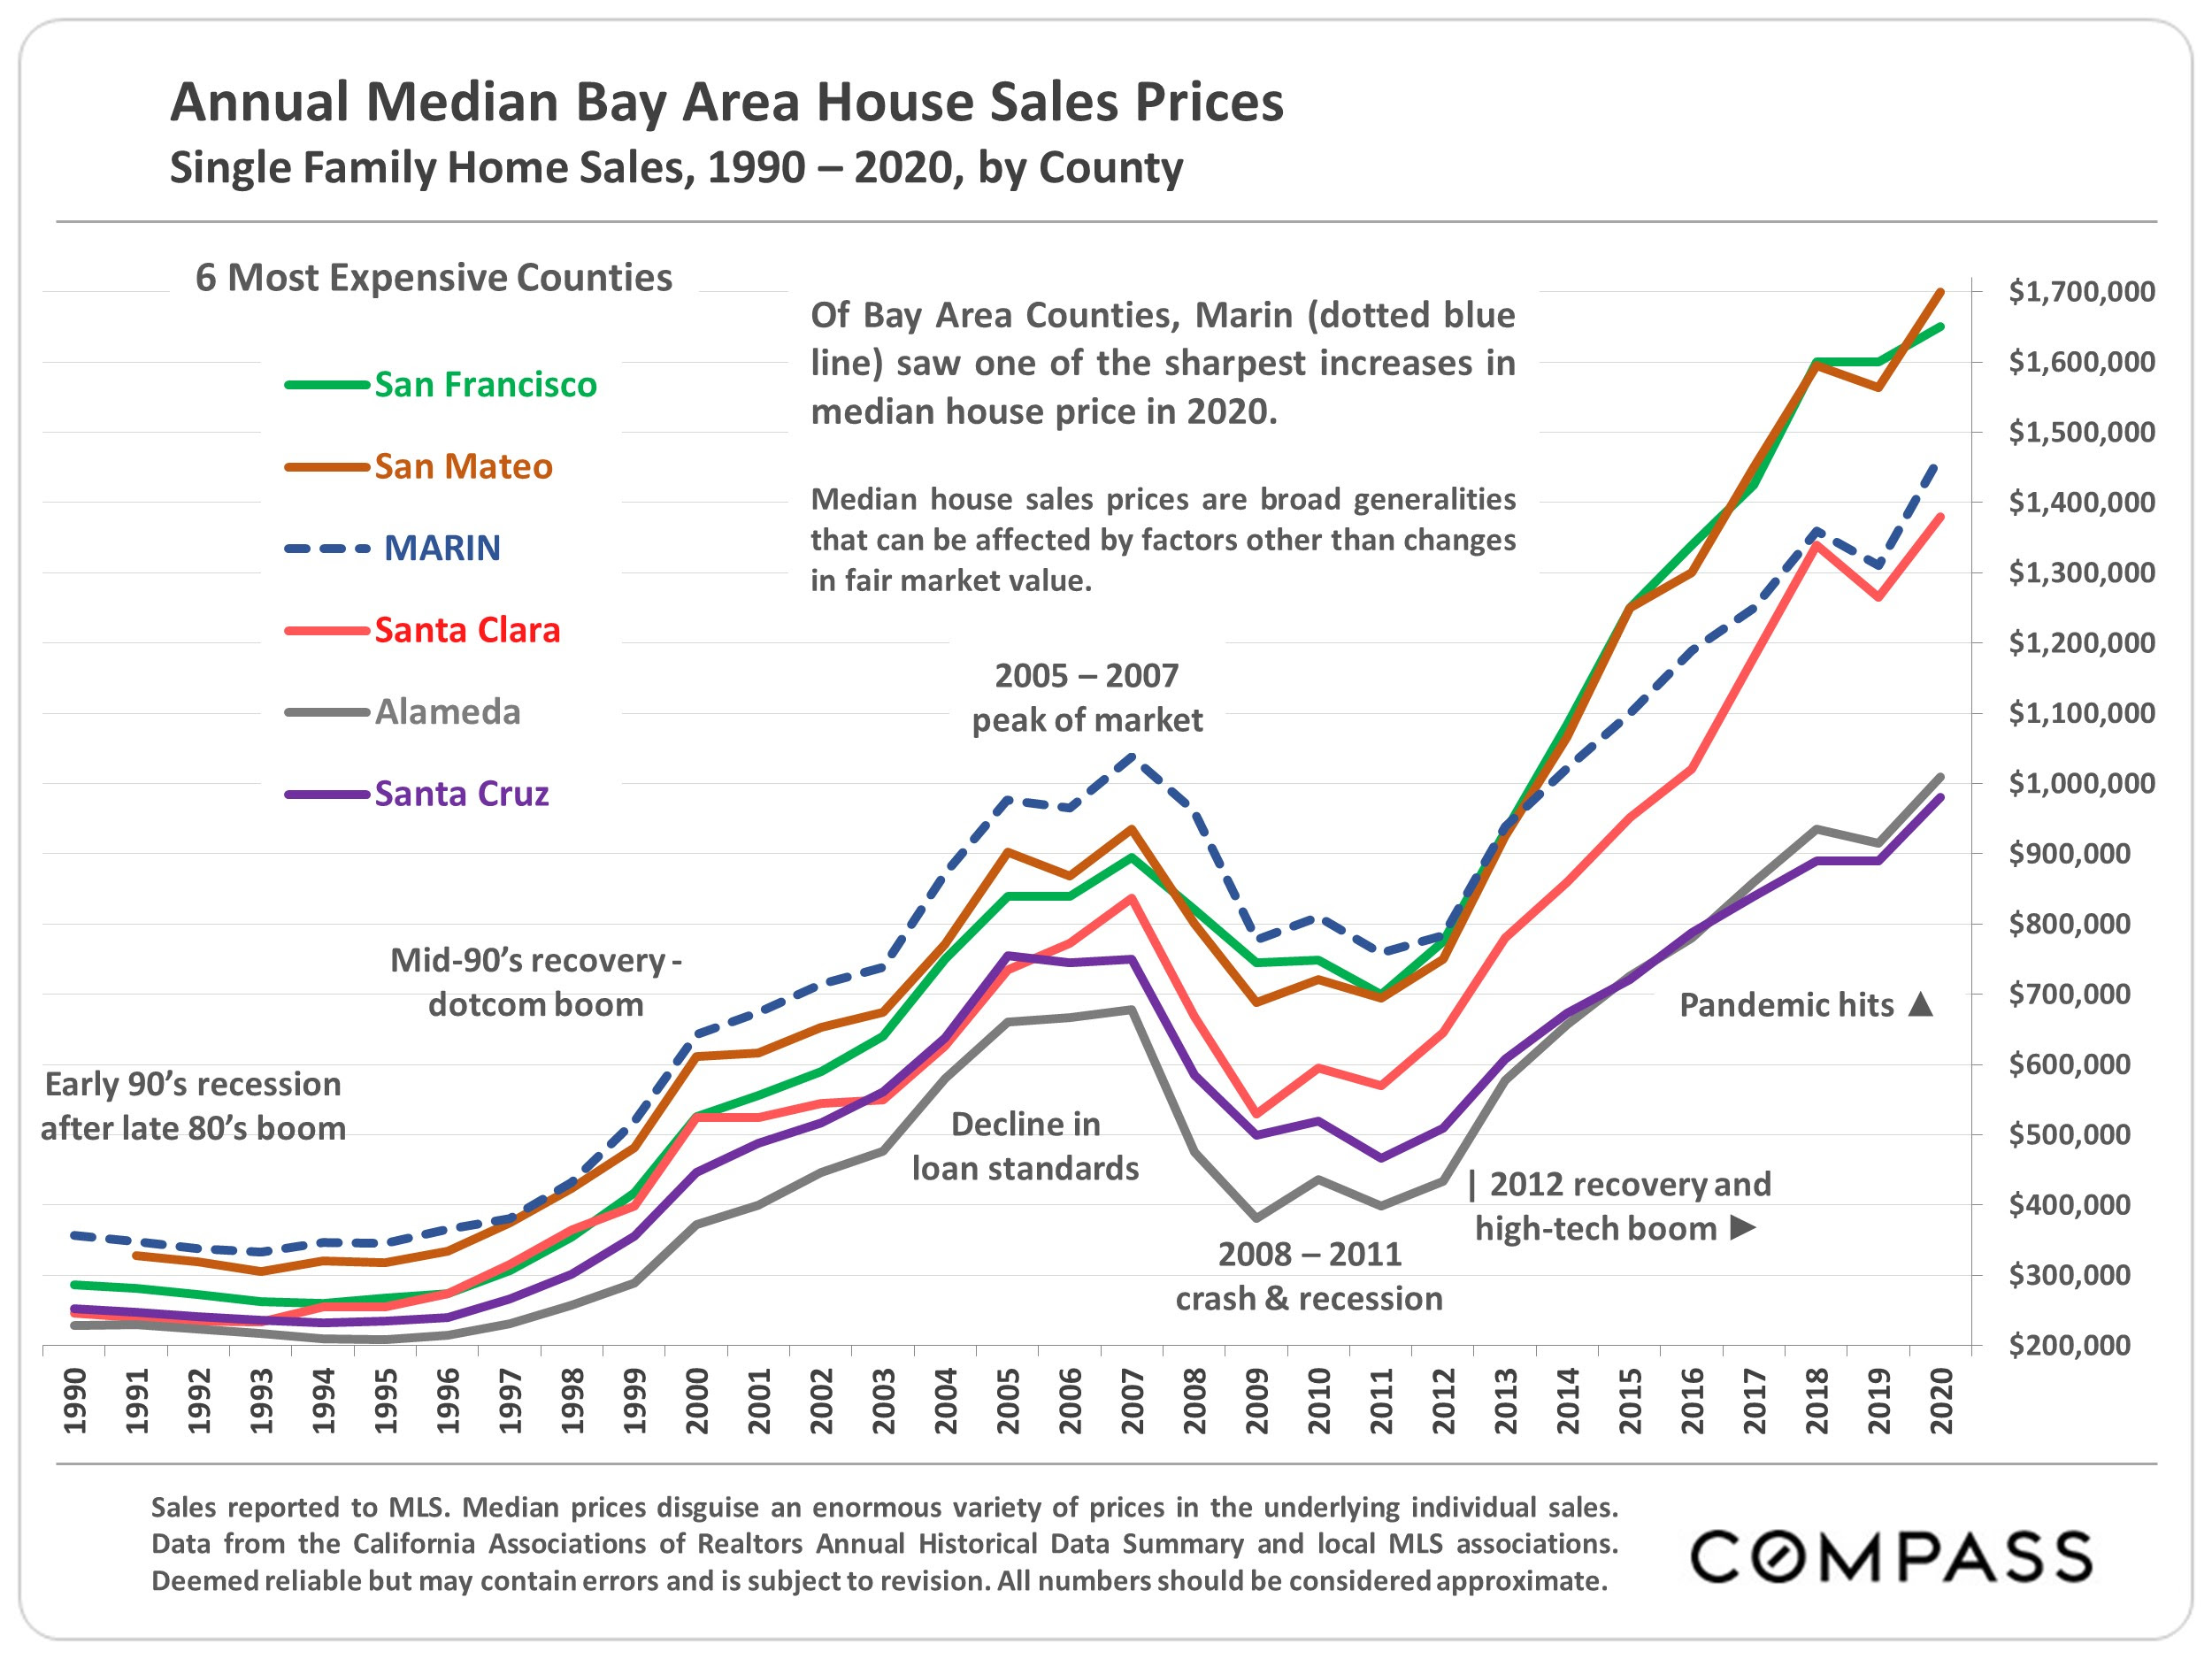
Chart of Bay Area median single-family home prices by county, 1990–2020, with Marin’s 2020 increase highlighted.
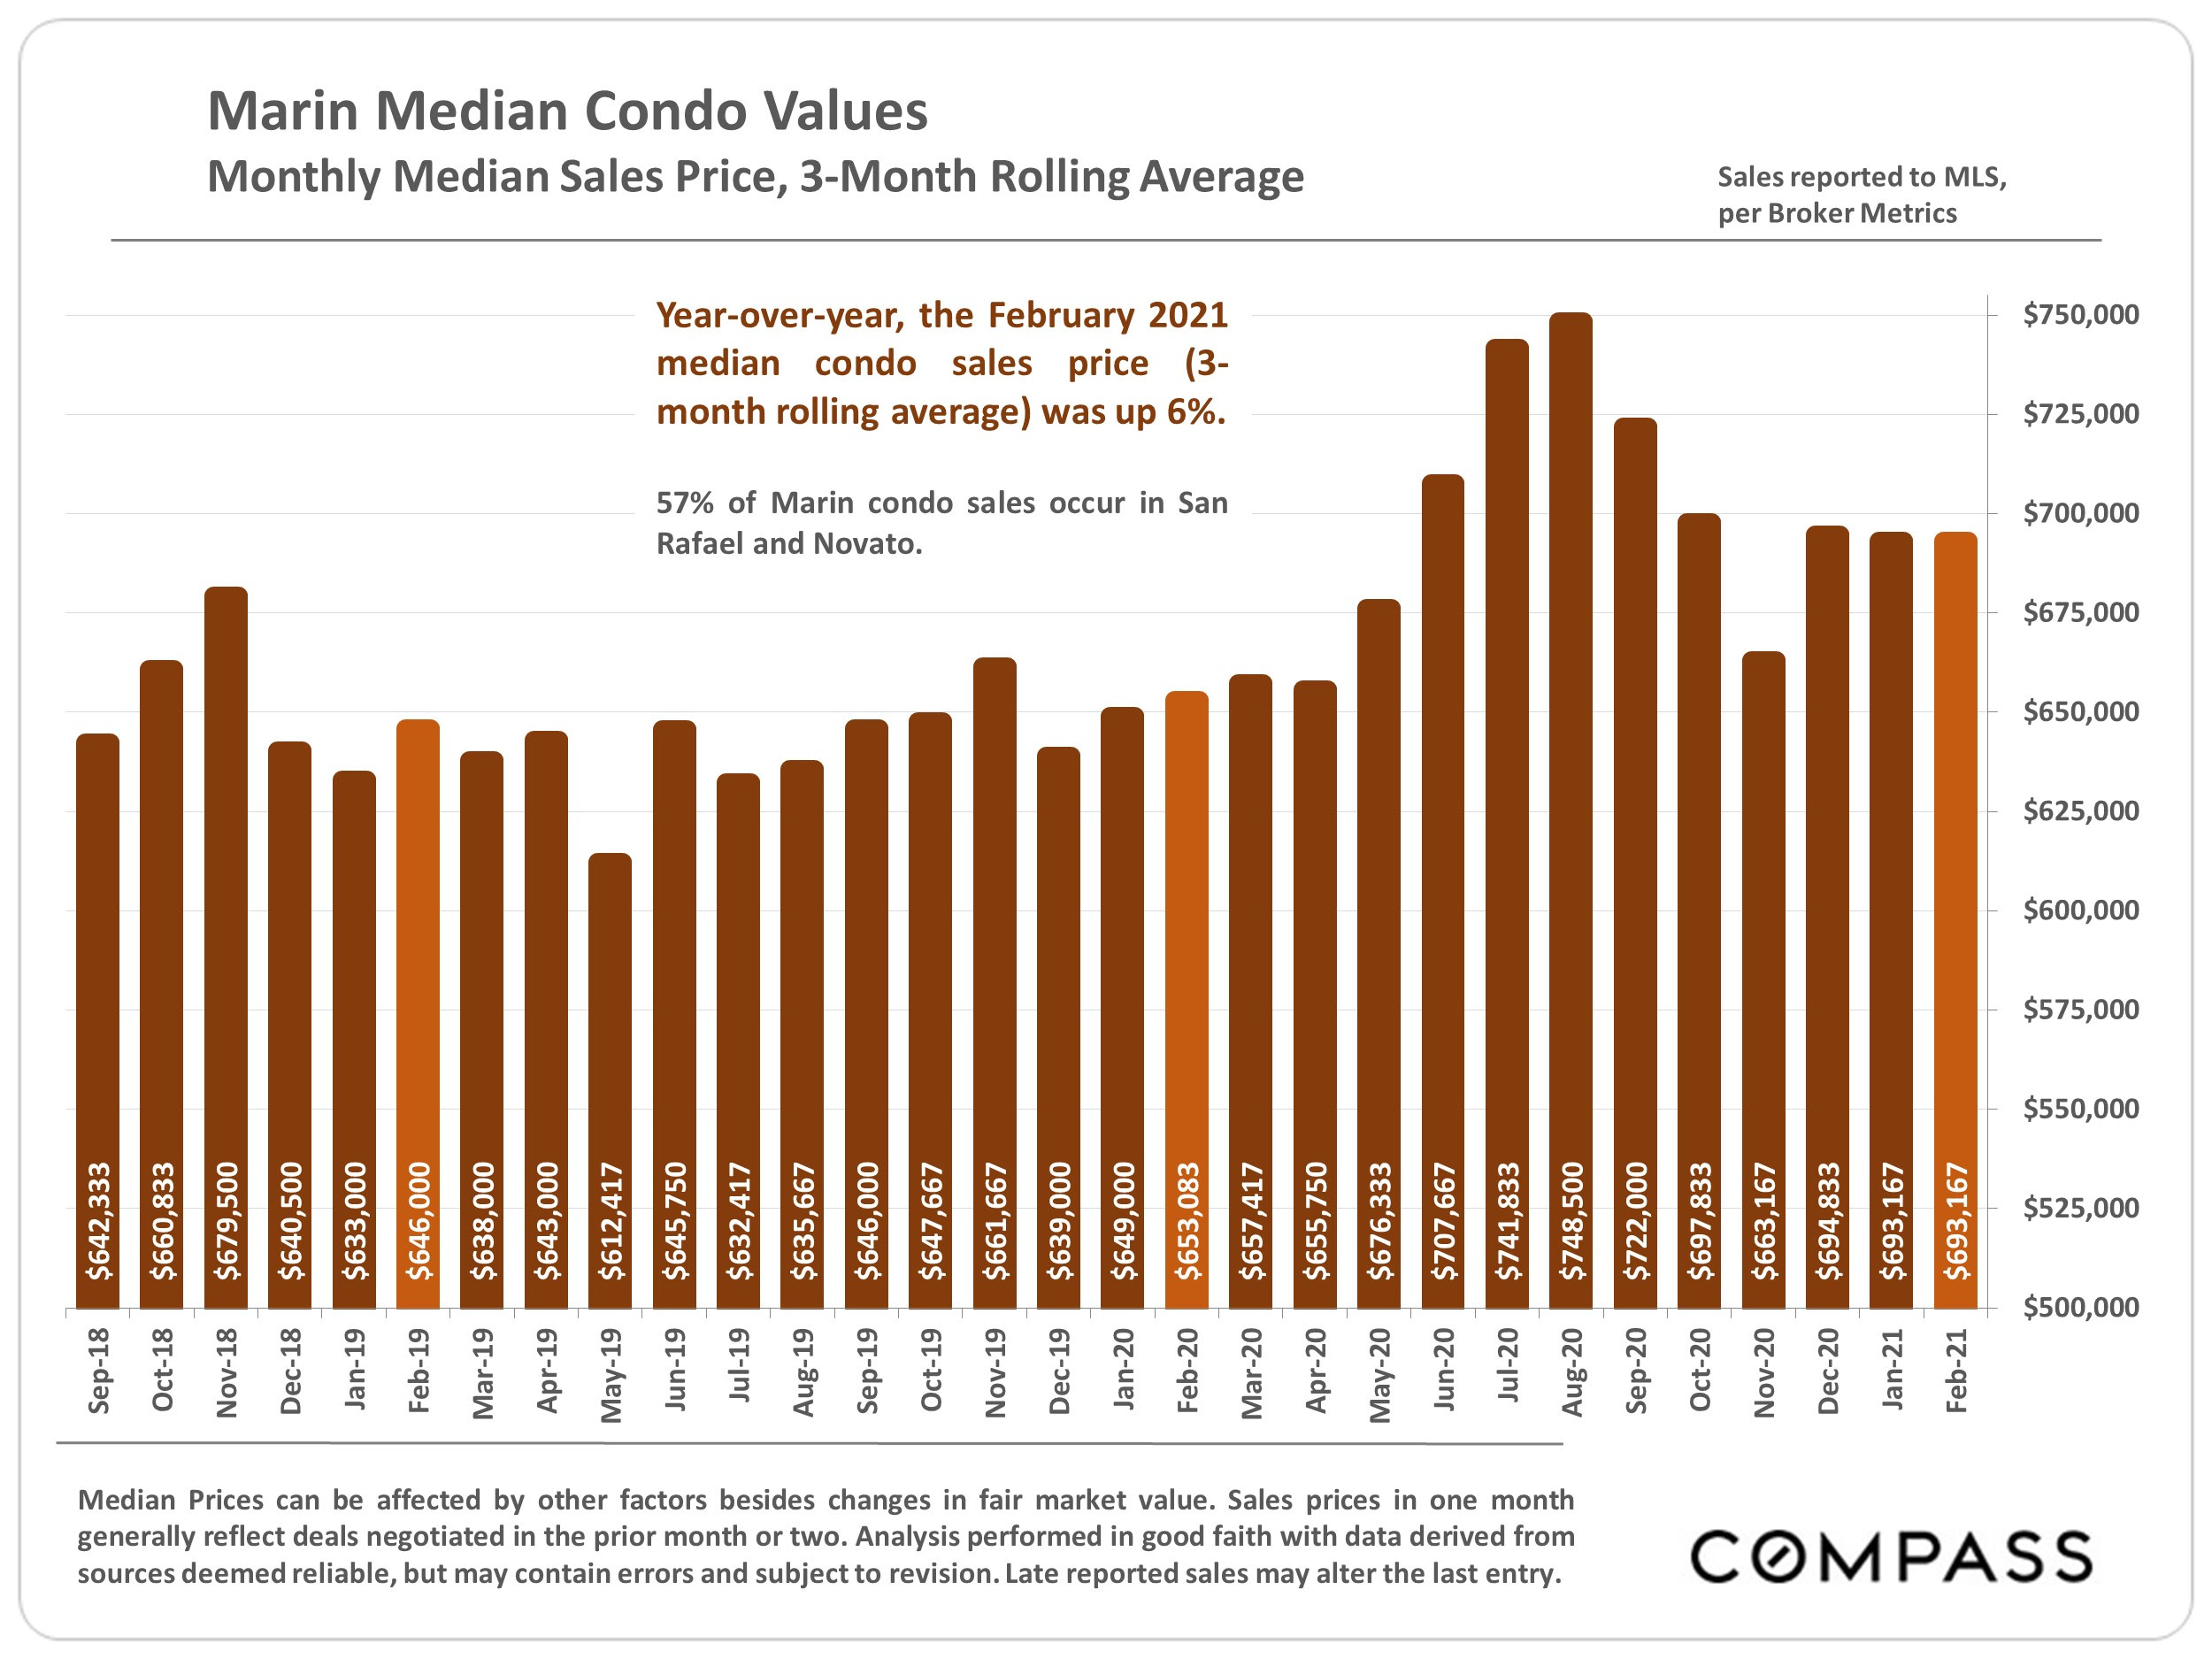
Marin condo median sales chart, September 2018–February 2021, with February 2021 at $693,167 and up 6% year over year.
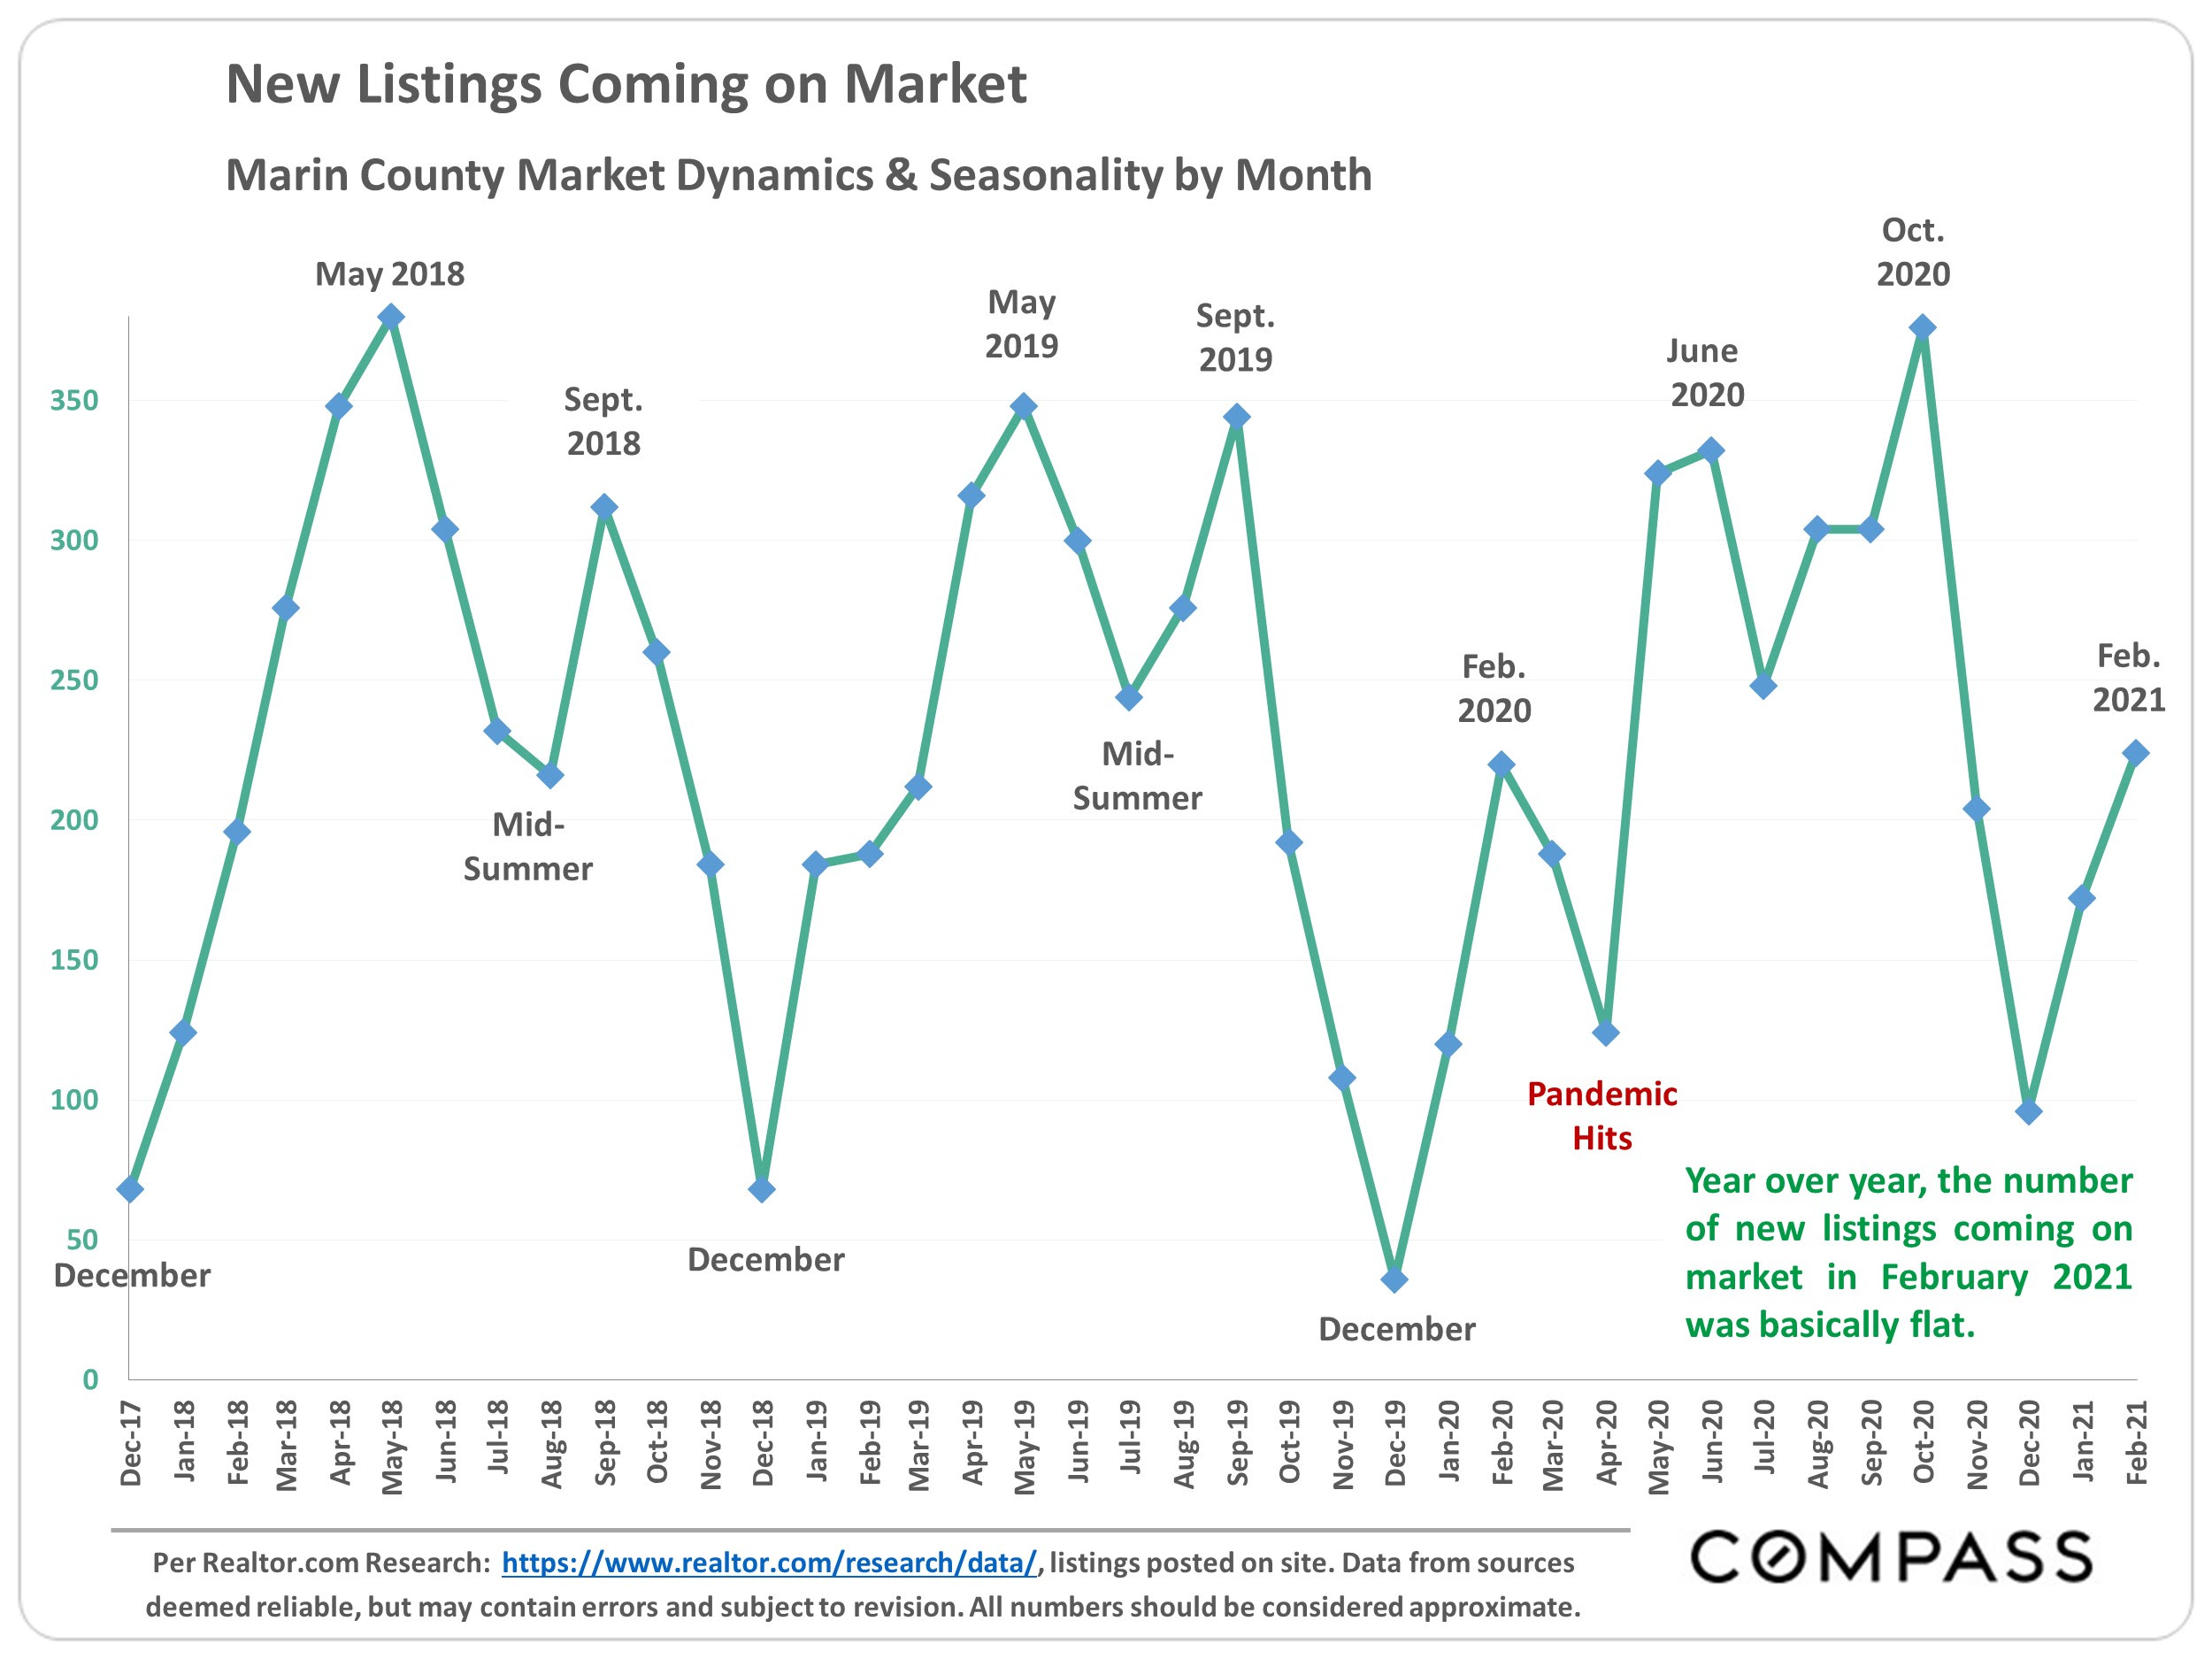
Line chart of Marin County monthly new listings, December 2017–February 2021, with a February 2021 year-over-year note.
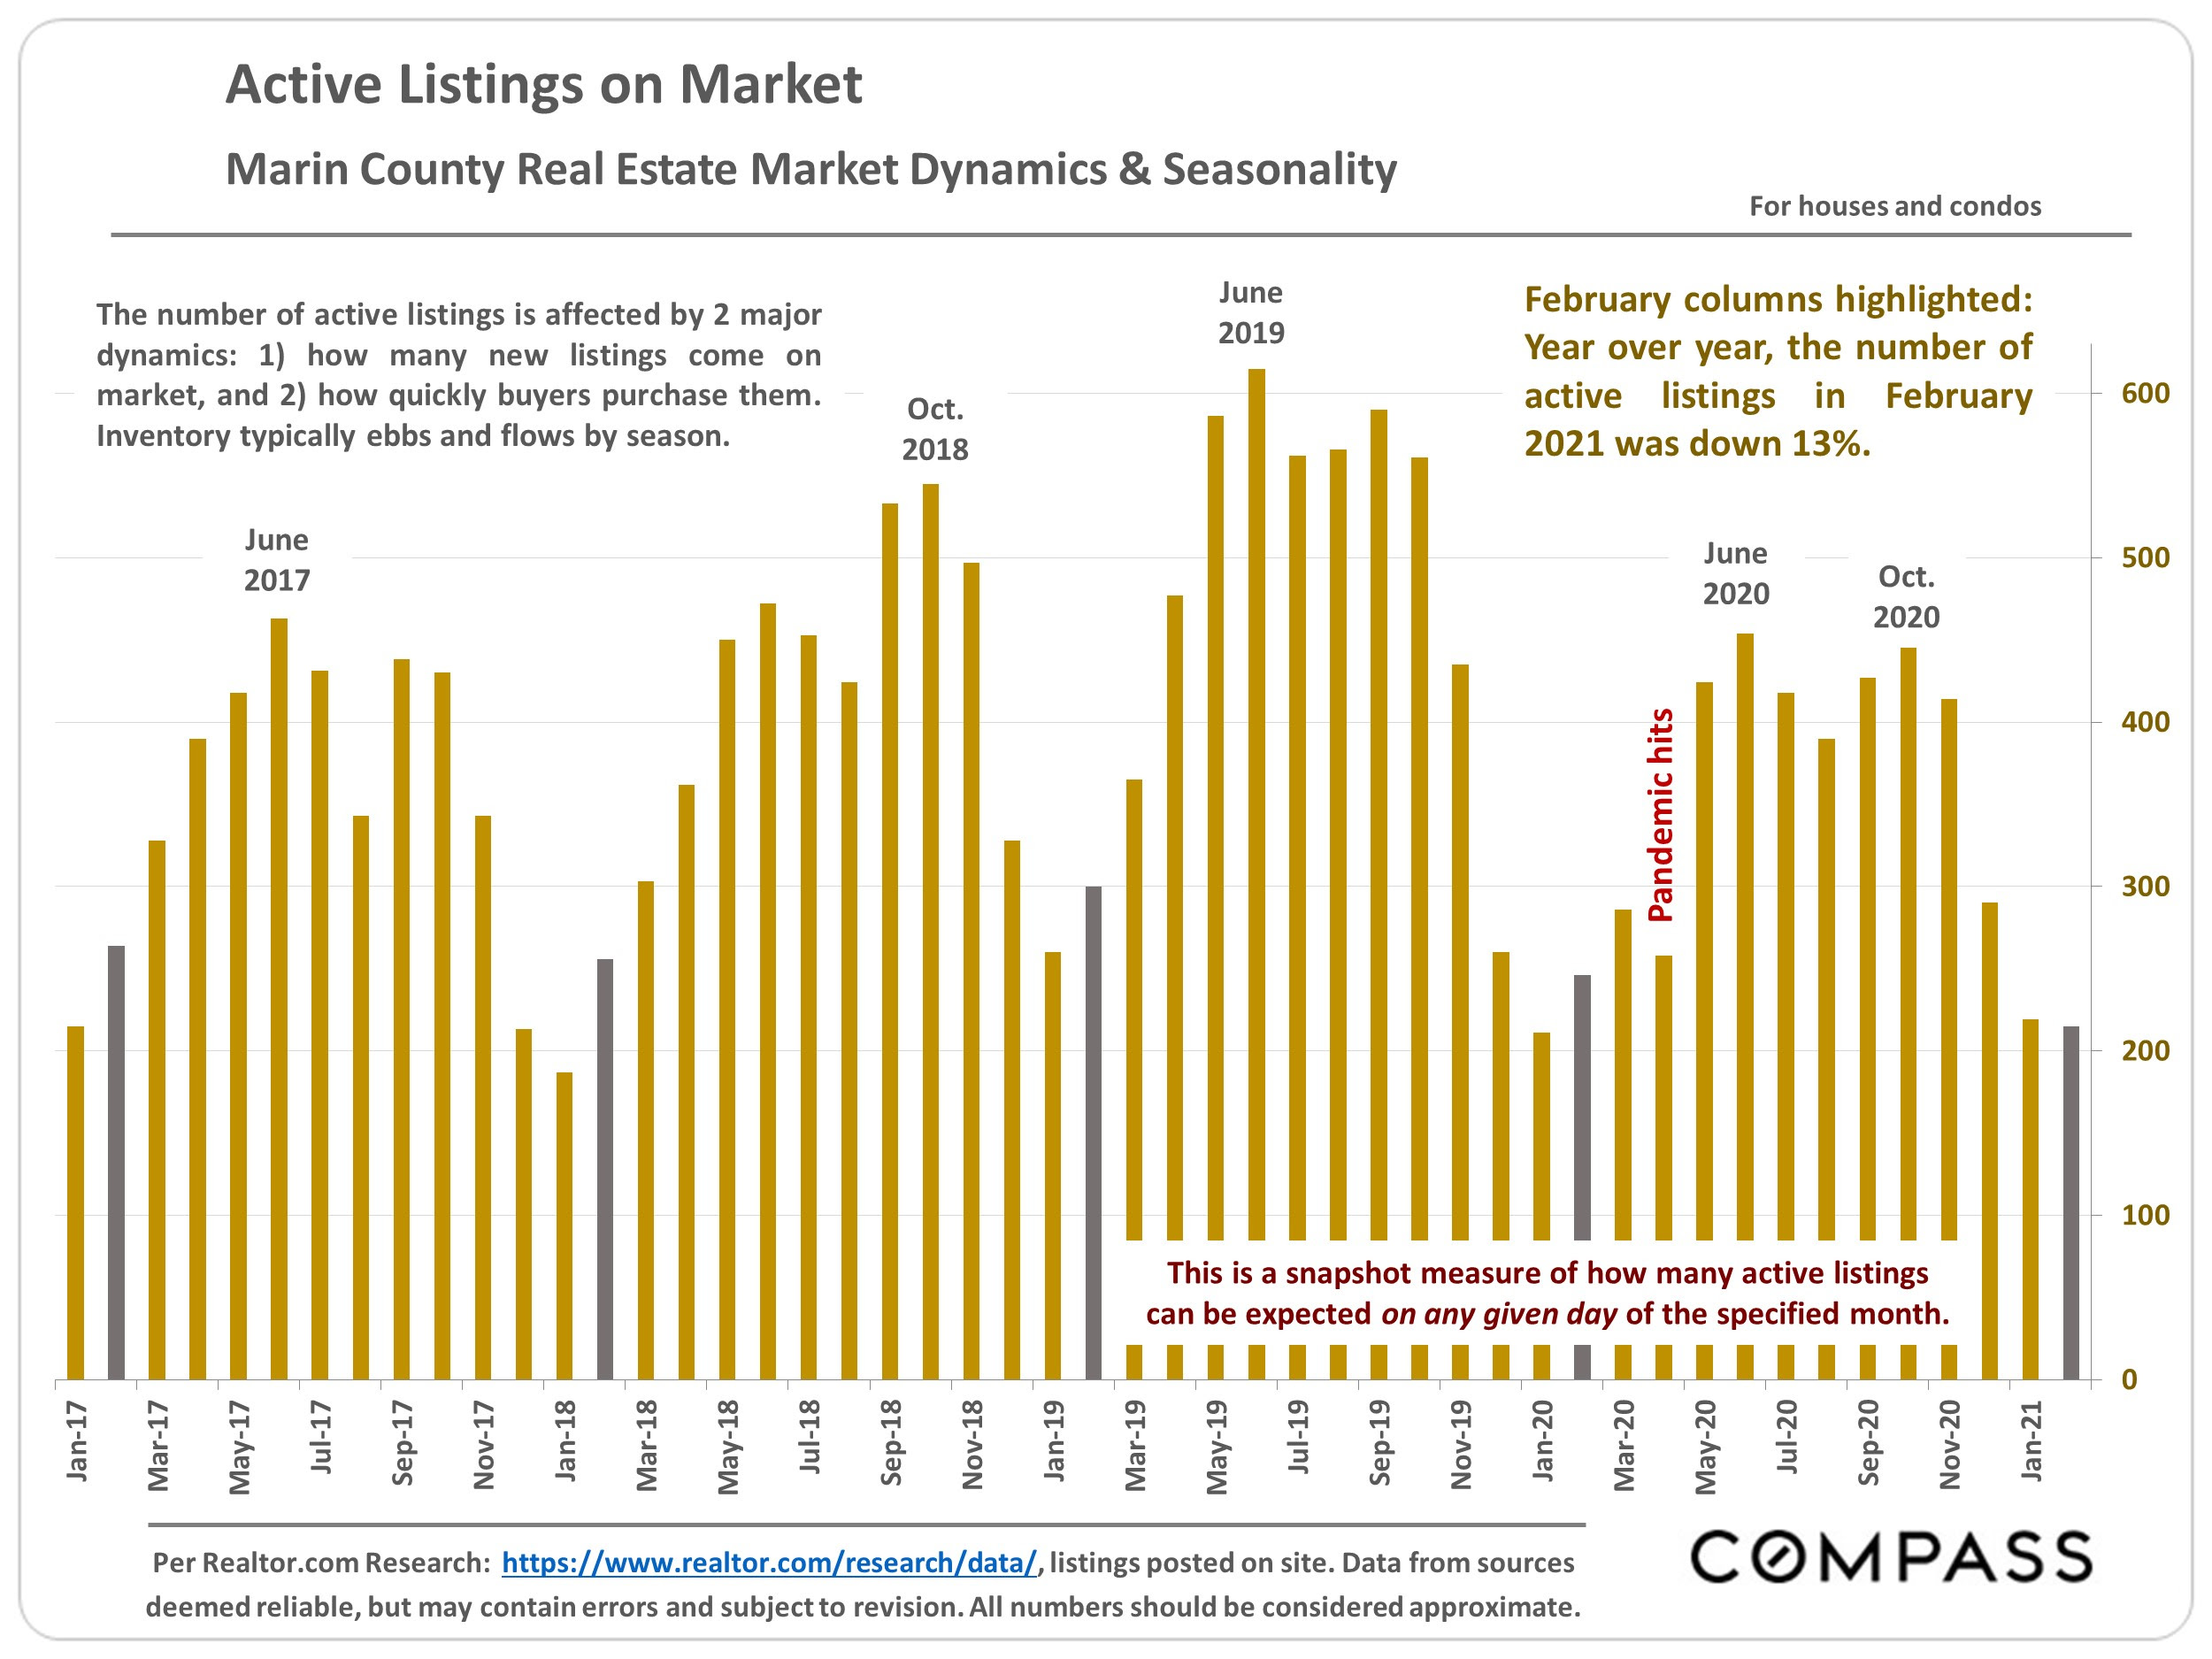
Chart of Marin County active listings, January 2017–February 2021, with February 2021 listings down 13% year over year.
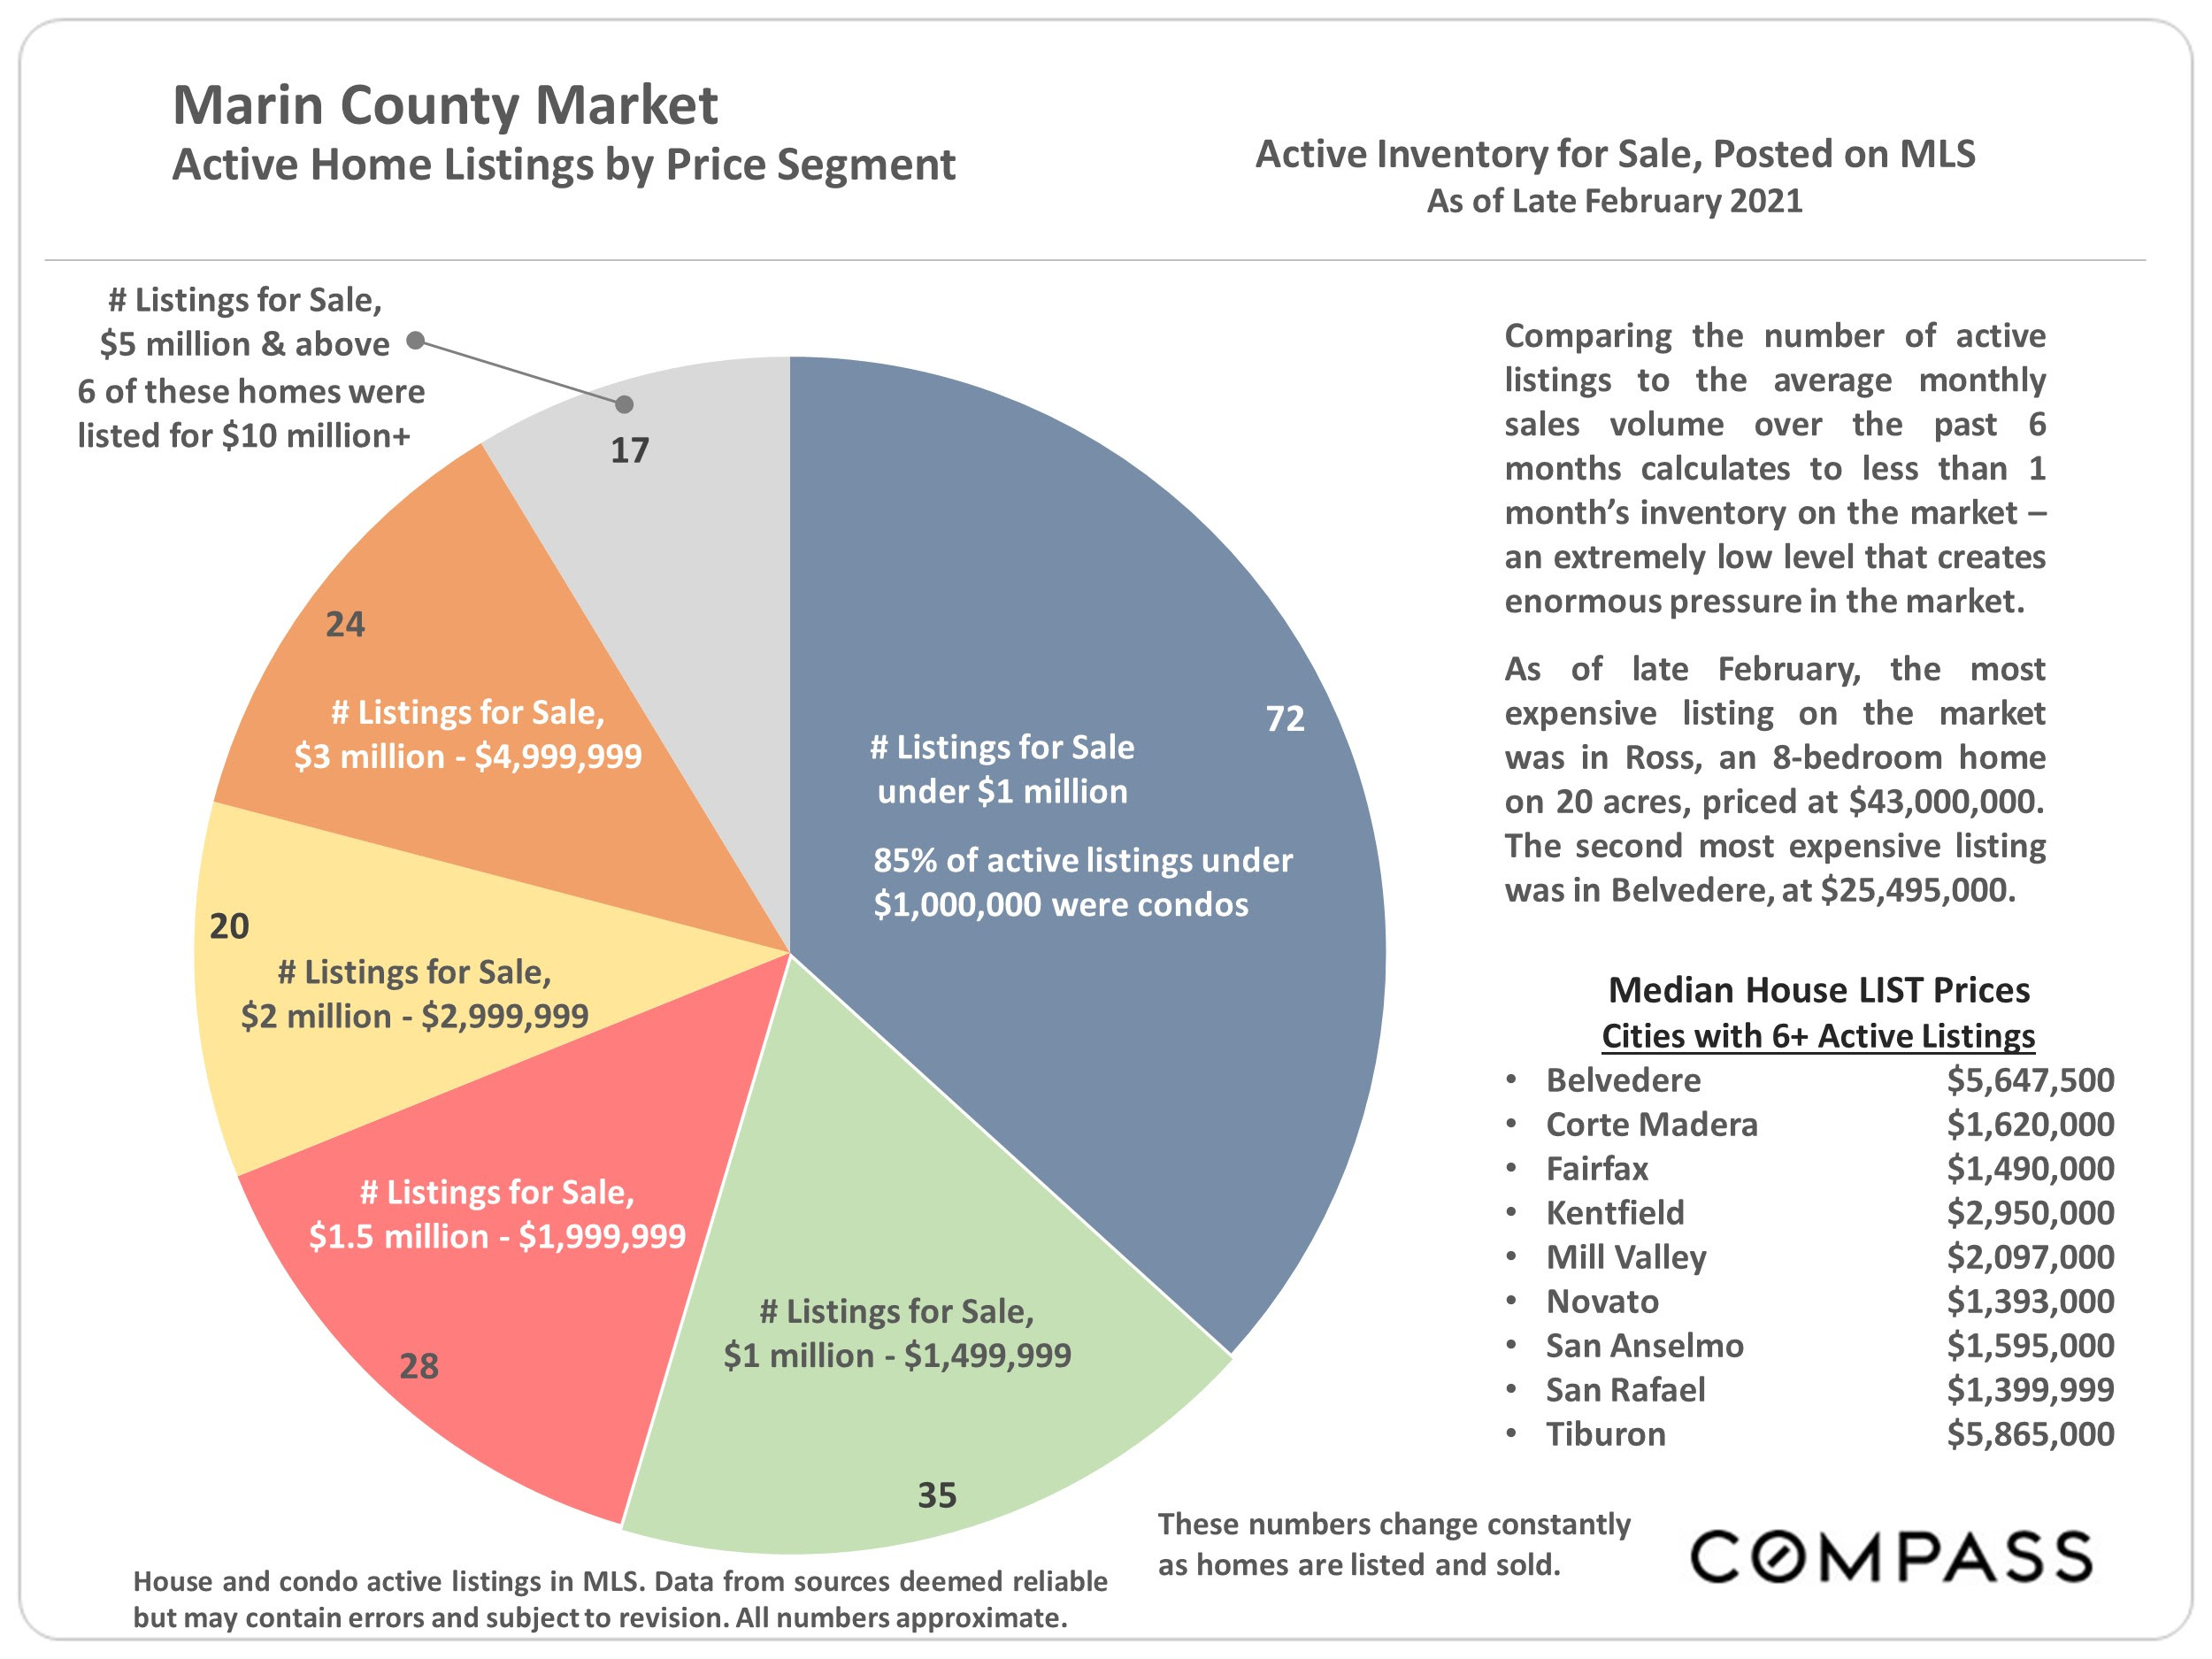
Marin County home listings by price segment, with a pie chart, inventory notes, city prices, and Compass branding.
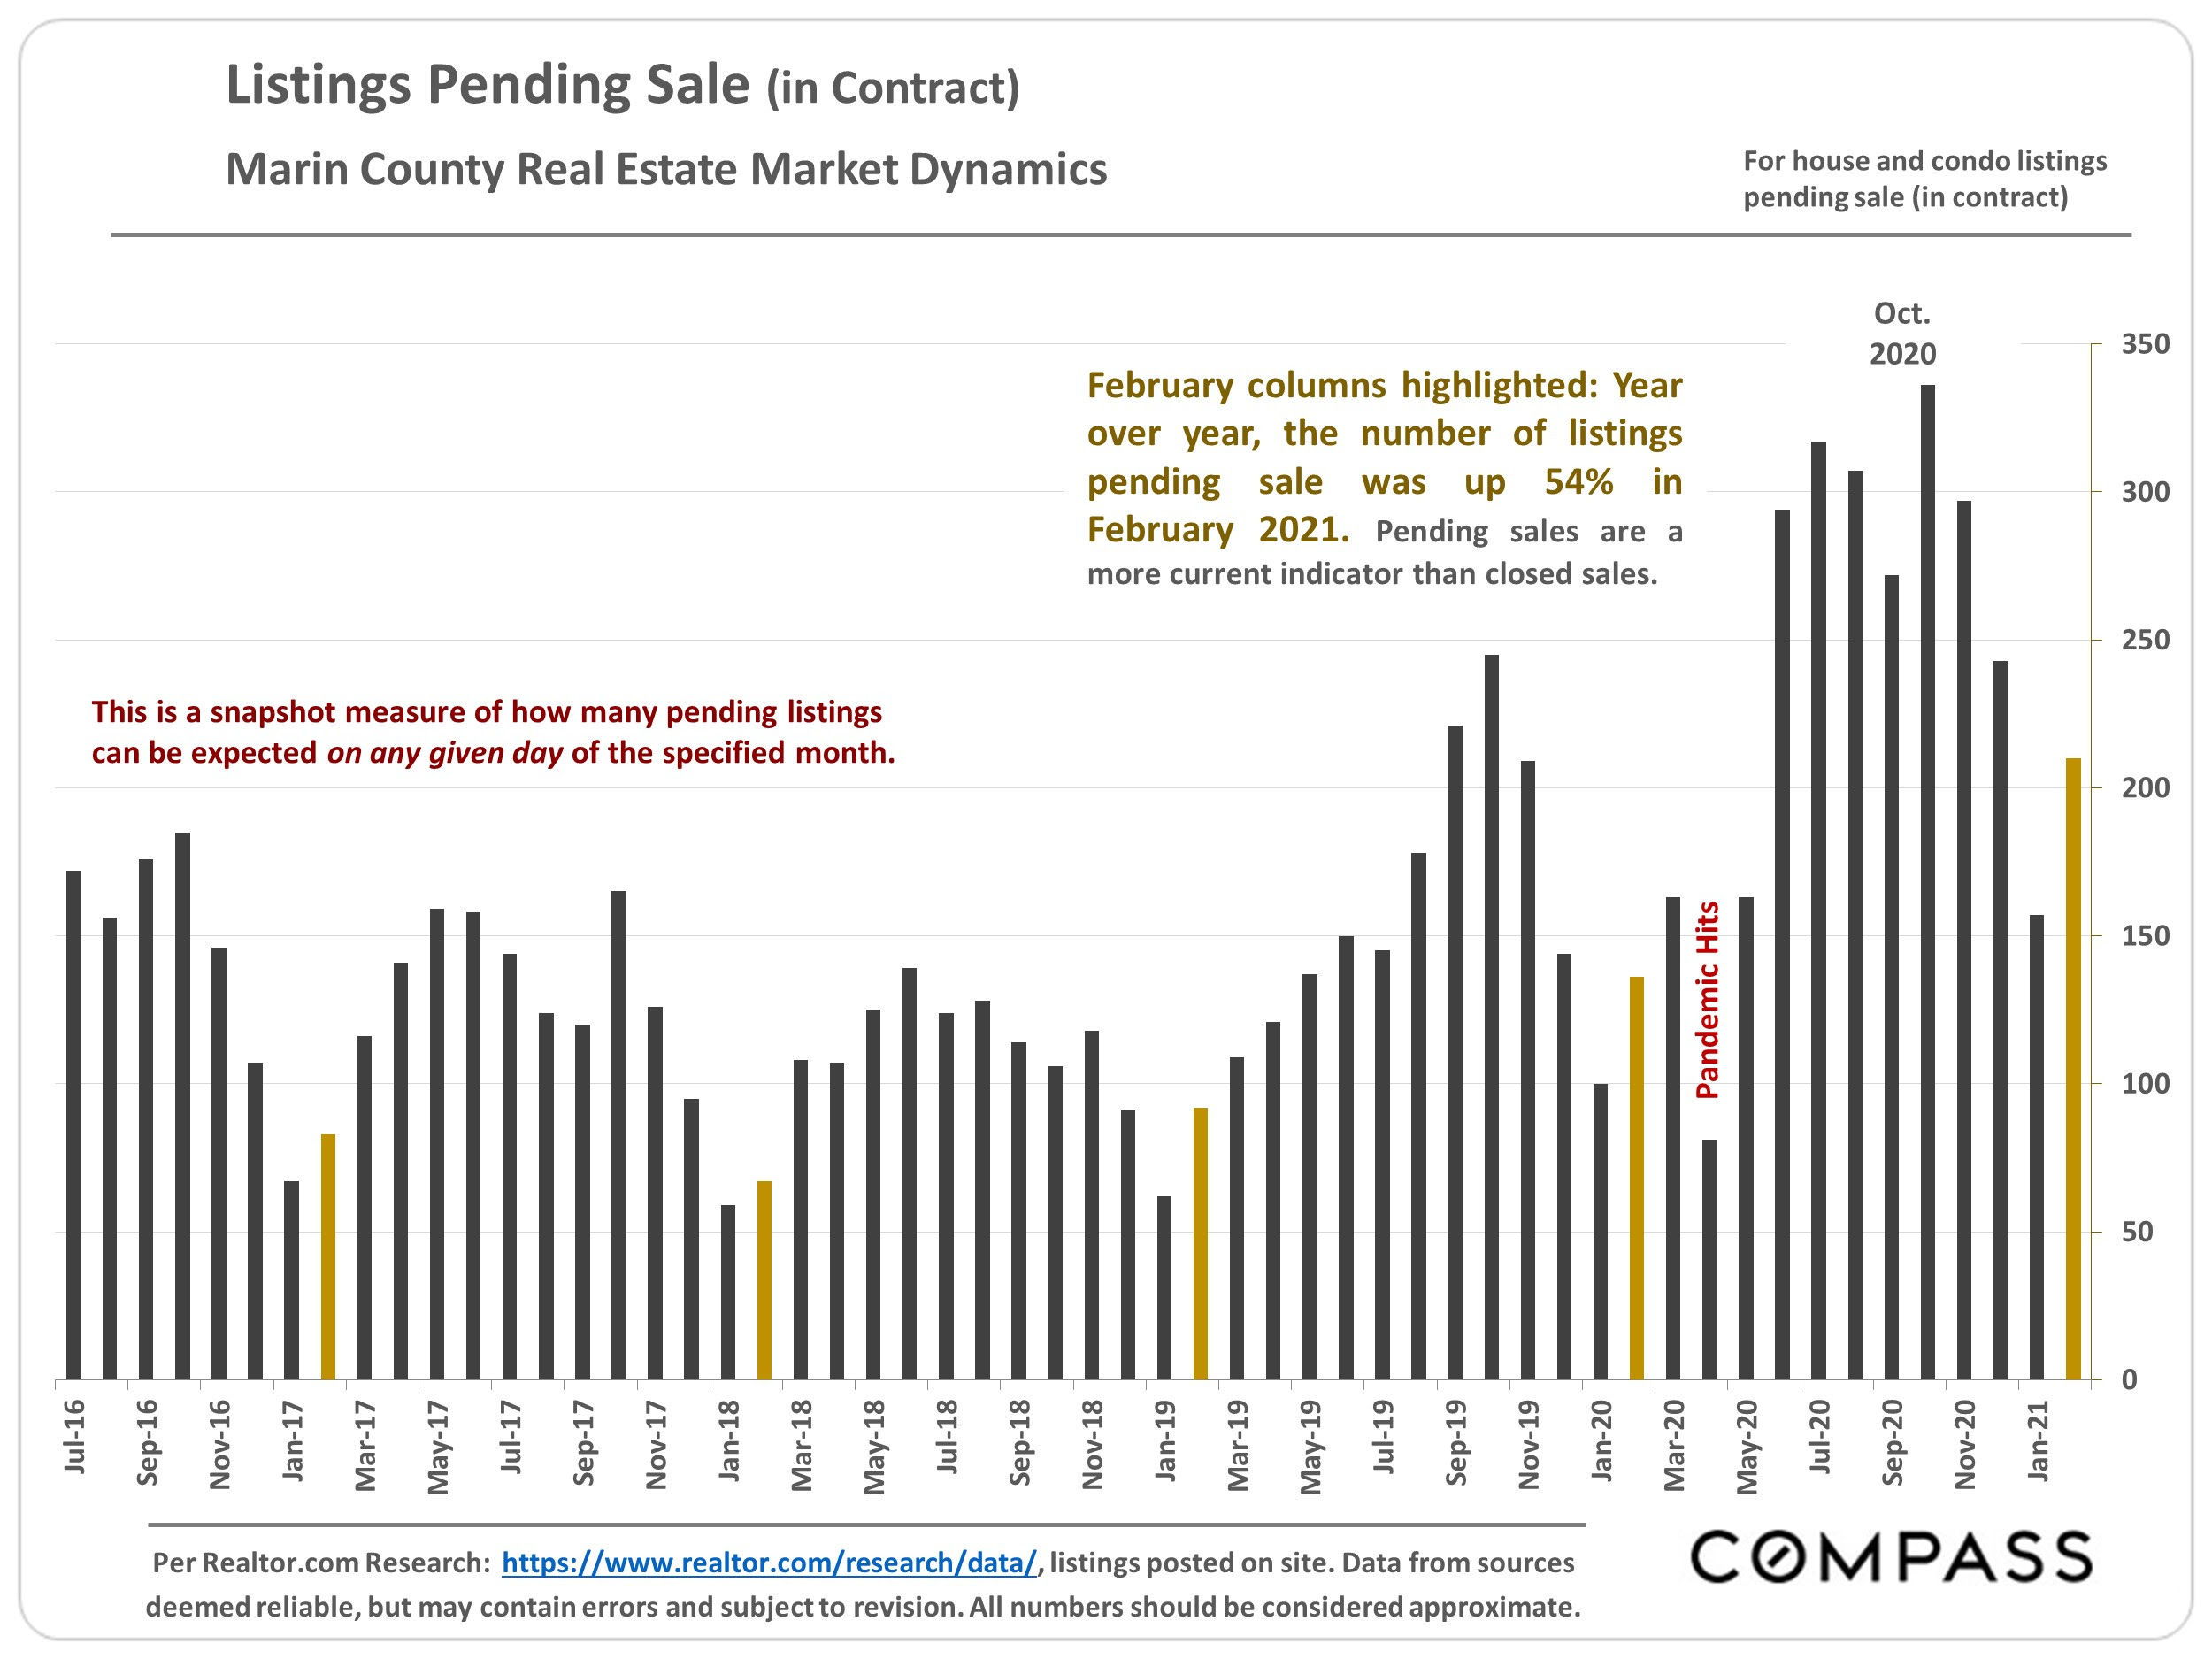
Bar chart of Marin County pending home listings, with February 2021 listings up 54% year over year.
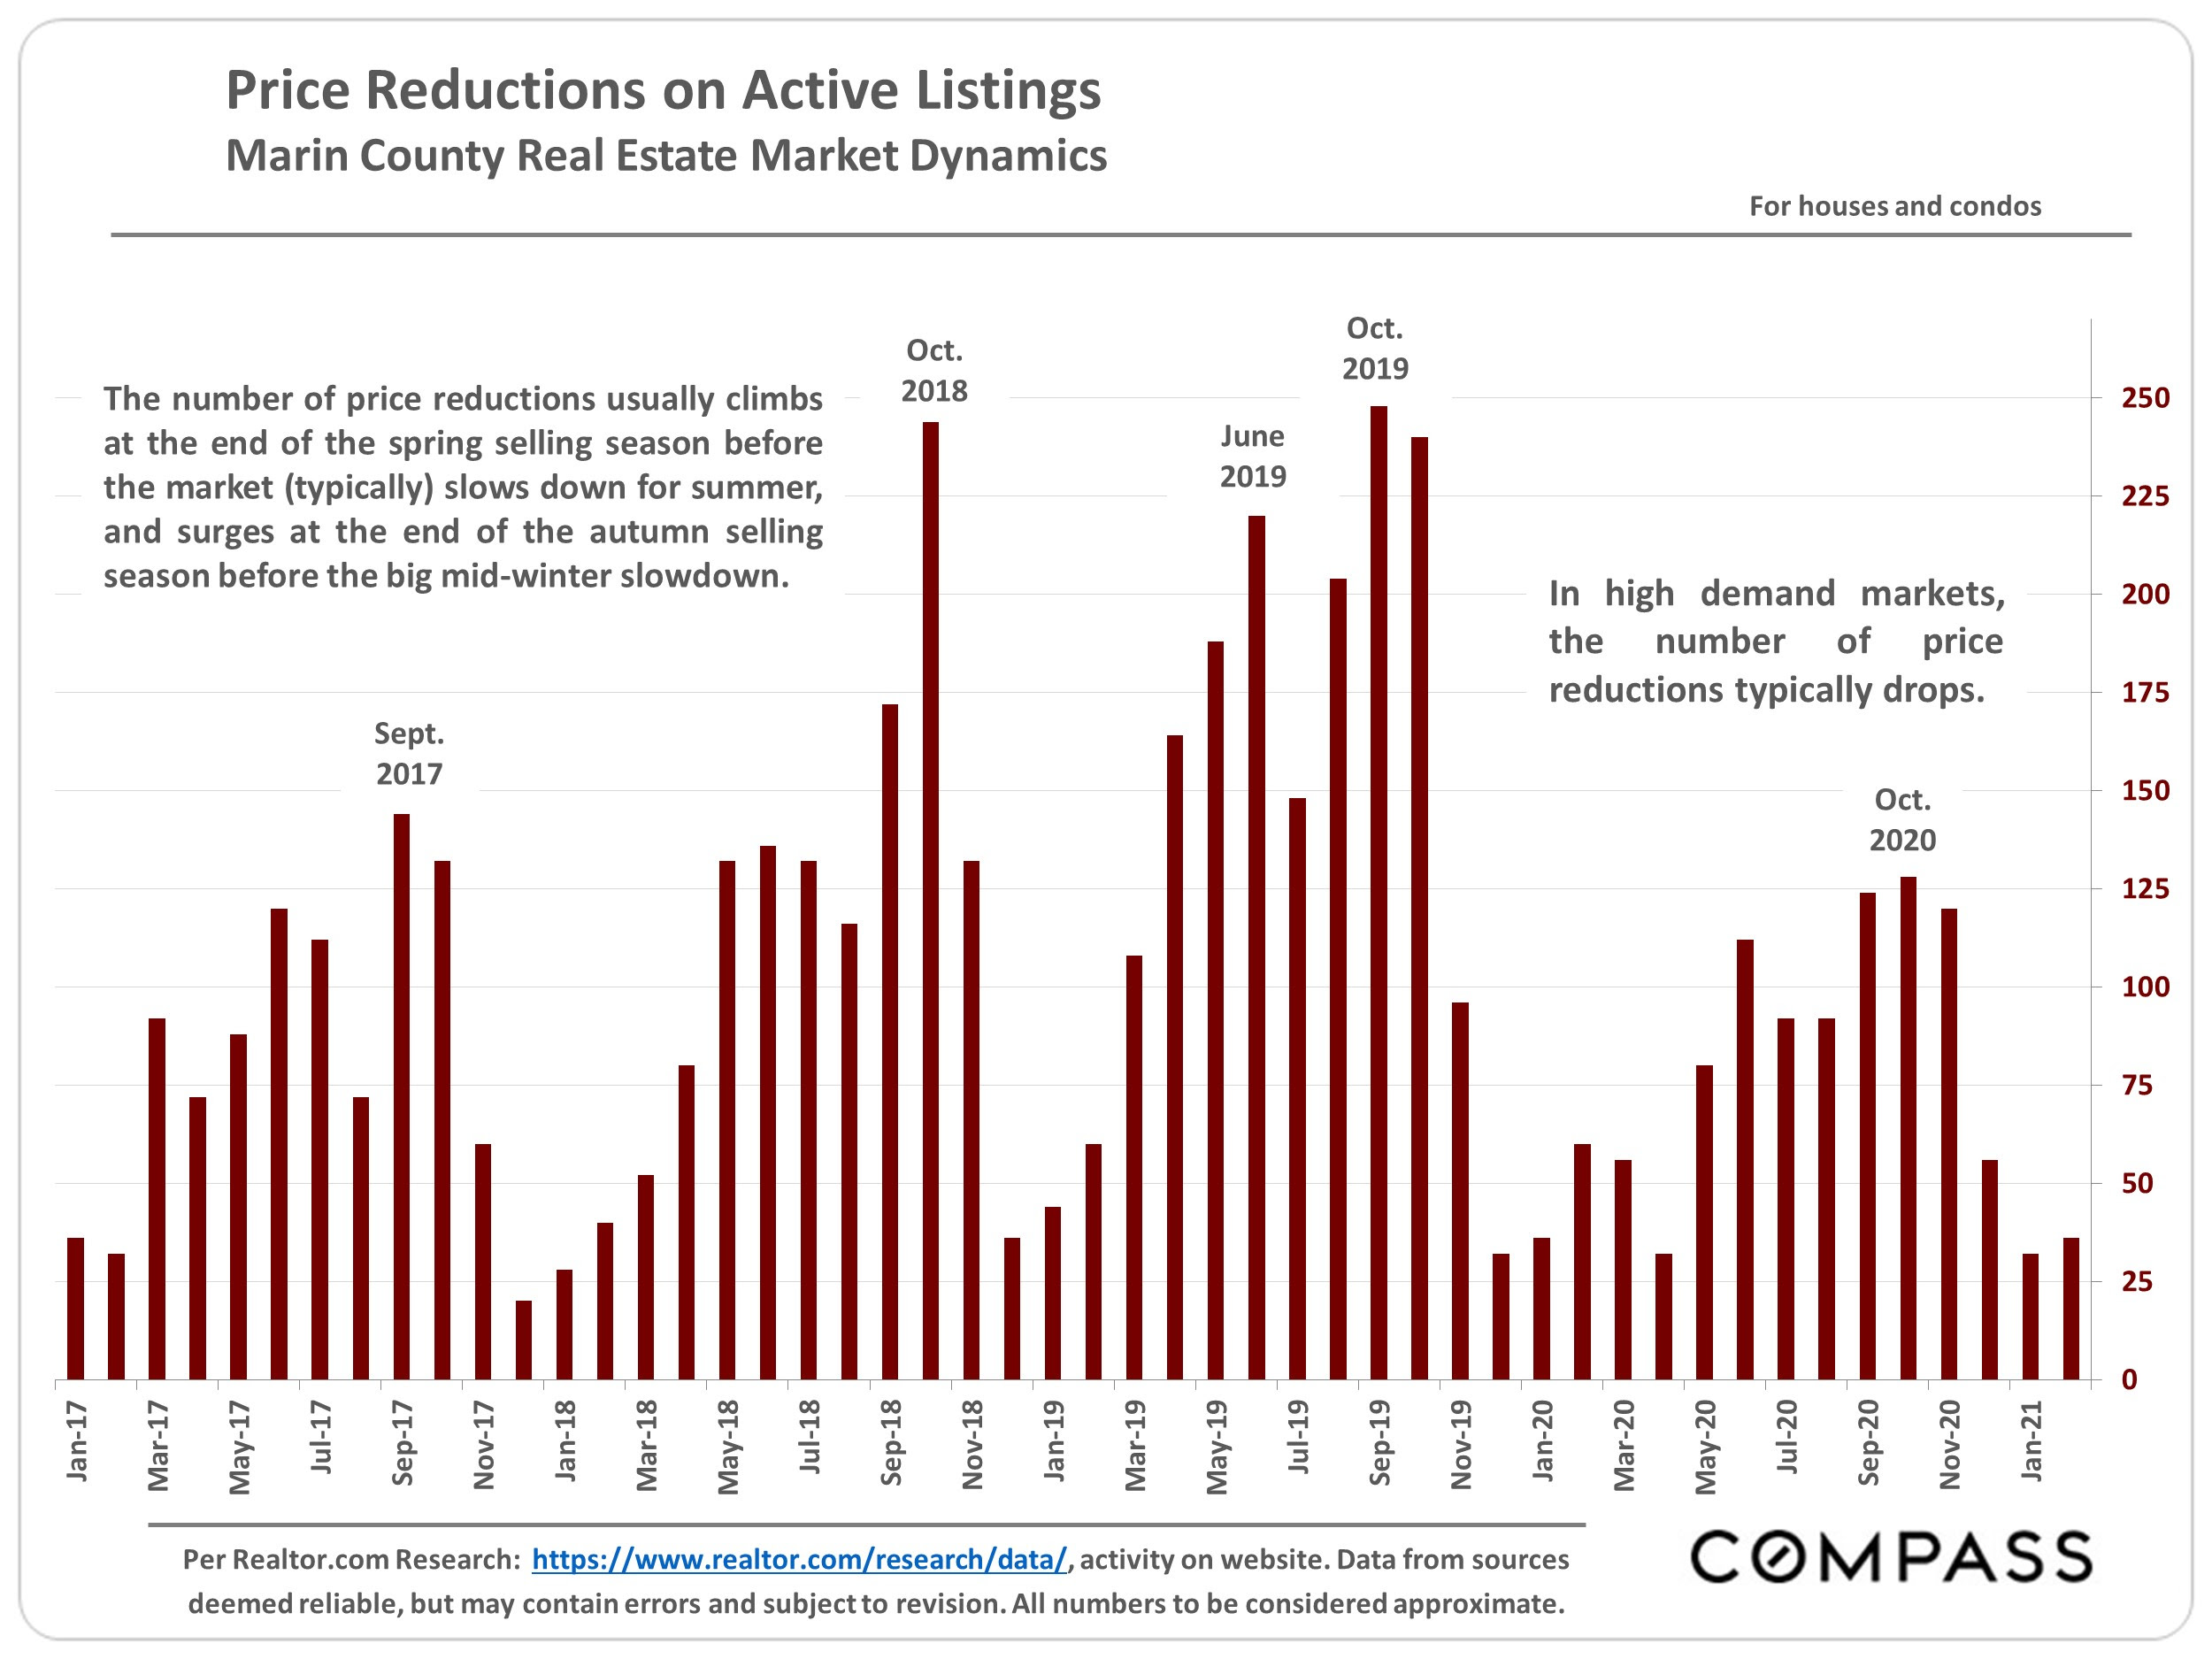
Chart of Marin County active-listing price reductions from 2017 to 2021, with seasonal trend annotations.
Bar chart of Marin monthly home sales, with a July 2020 peak and February 2021 sales up 45% year over year.
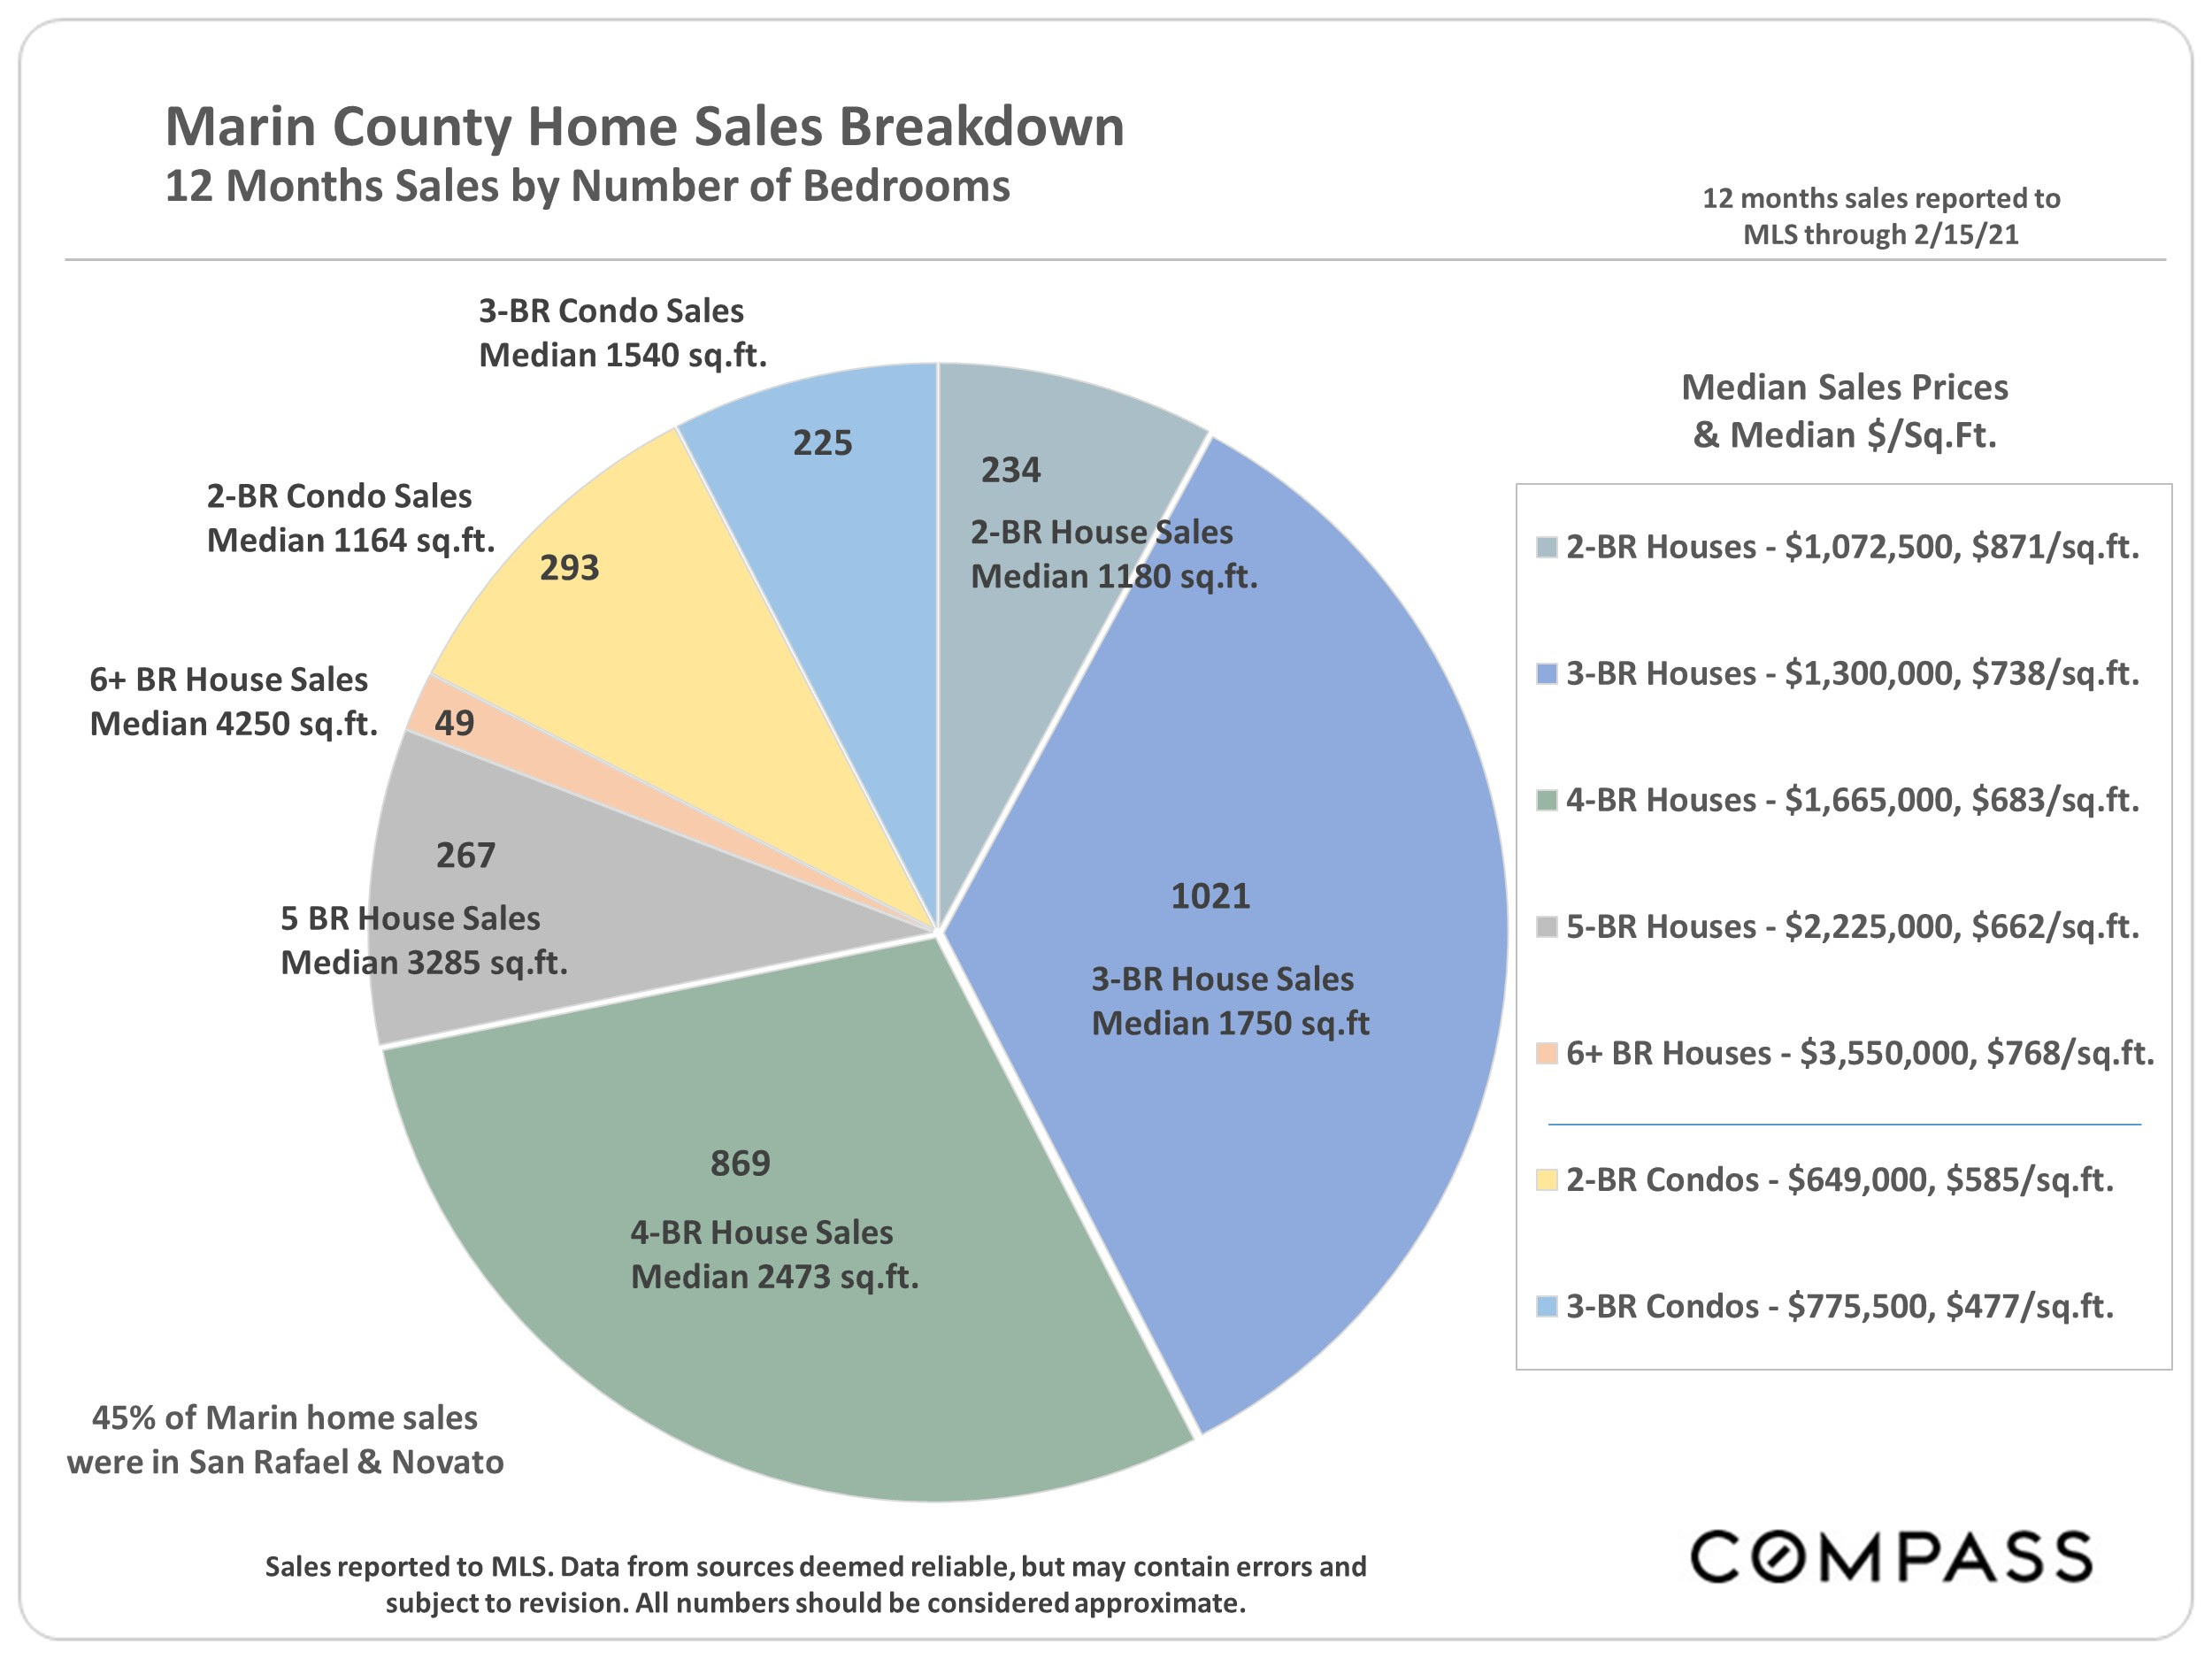
Pie chart of Marin County home sales by bedroom count, with median sizes and sale prices; 3-bedroom houses lead.
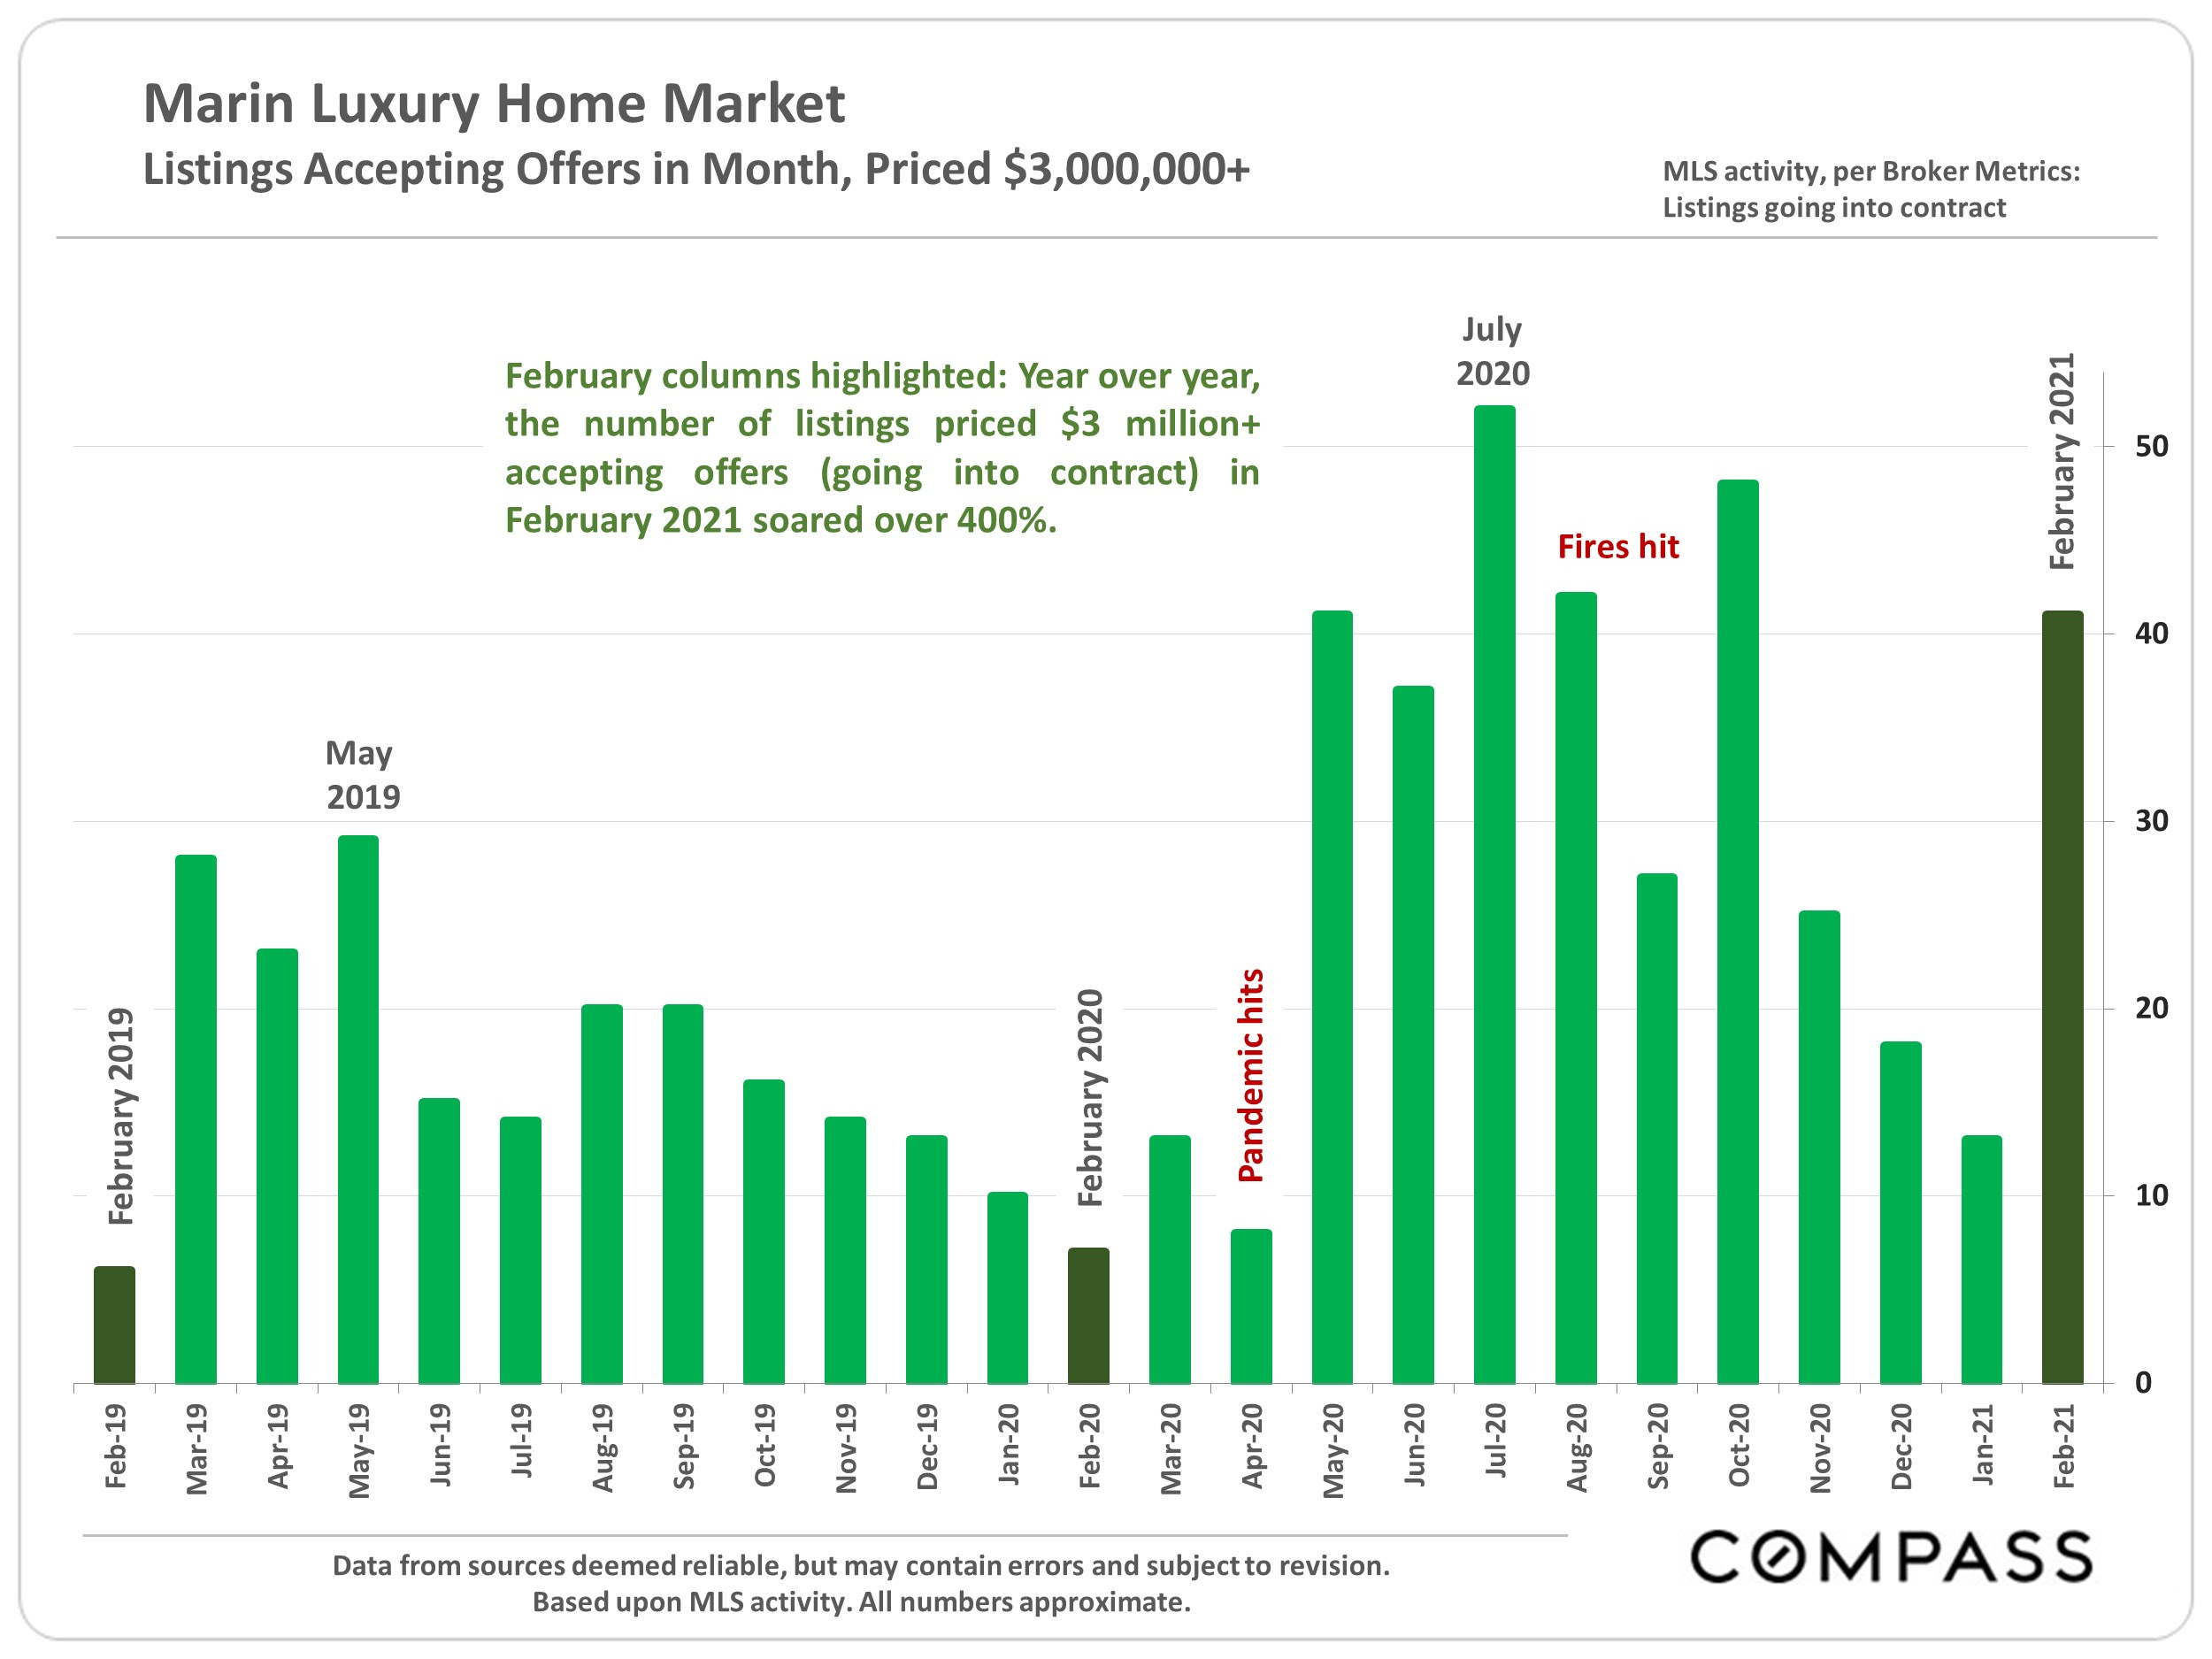
Bar chart shows Marin luxury listings over $3 million going into contract; February 2021 rose over 400% year over year.
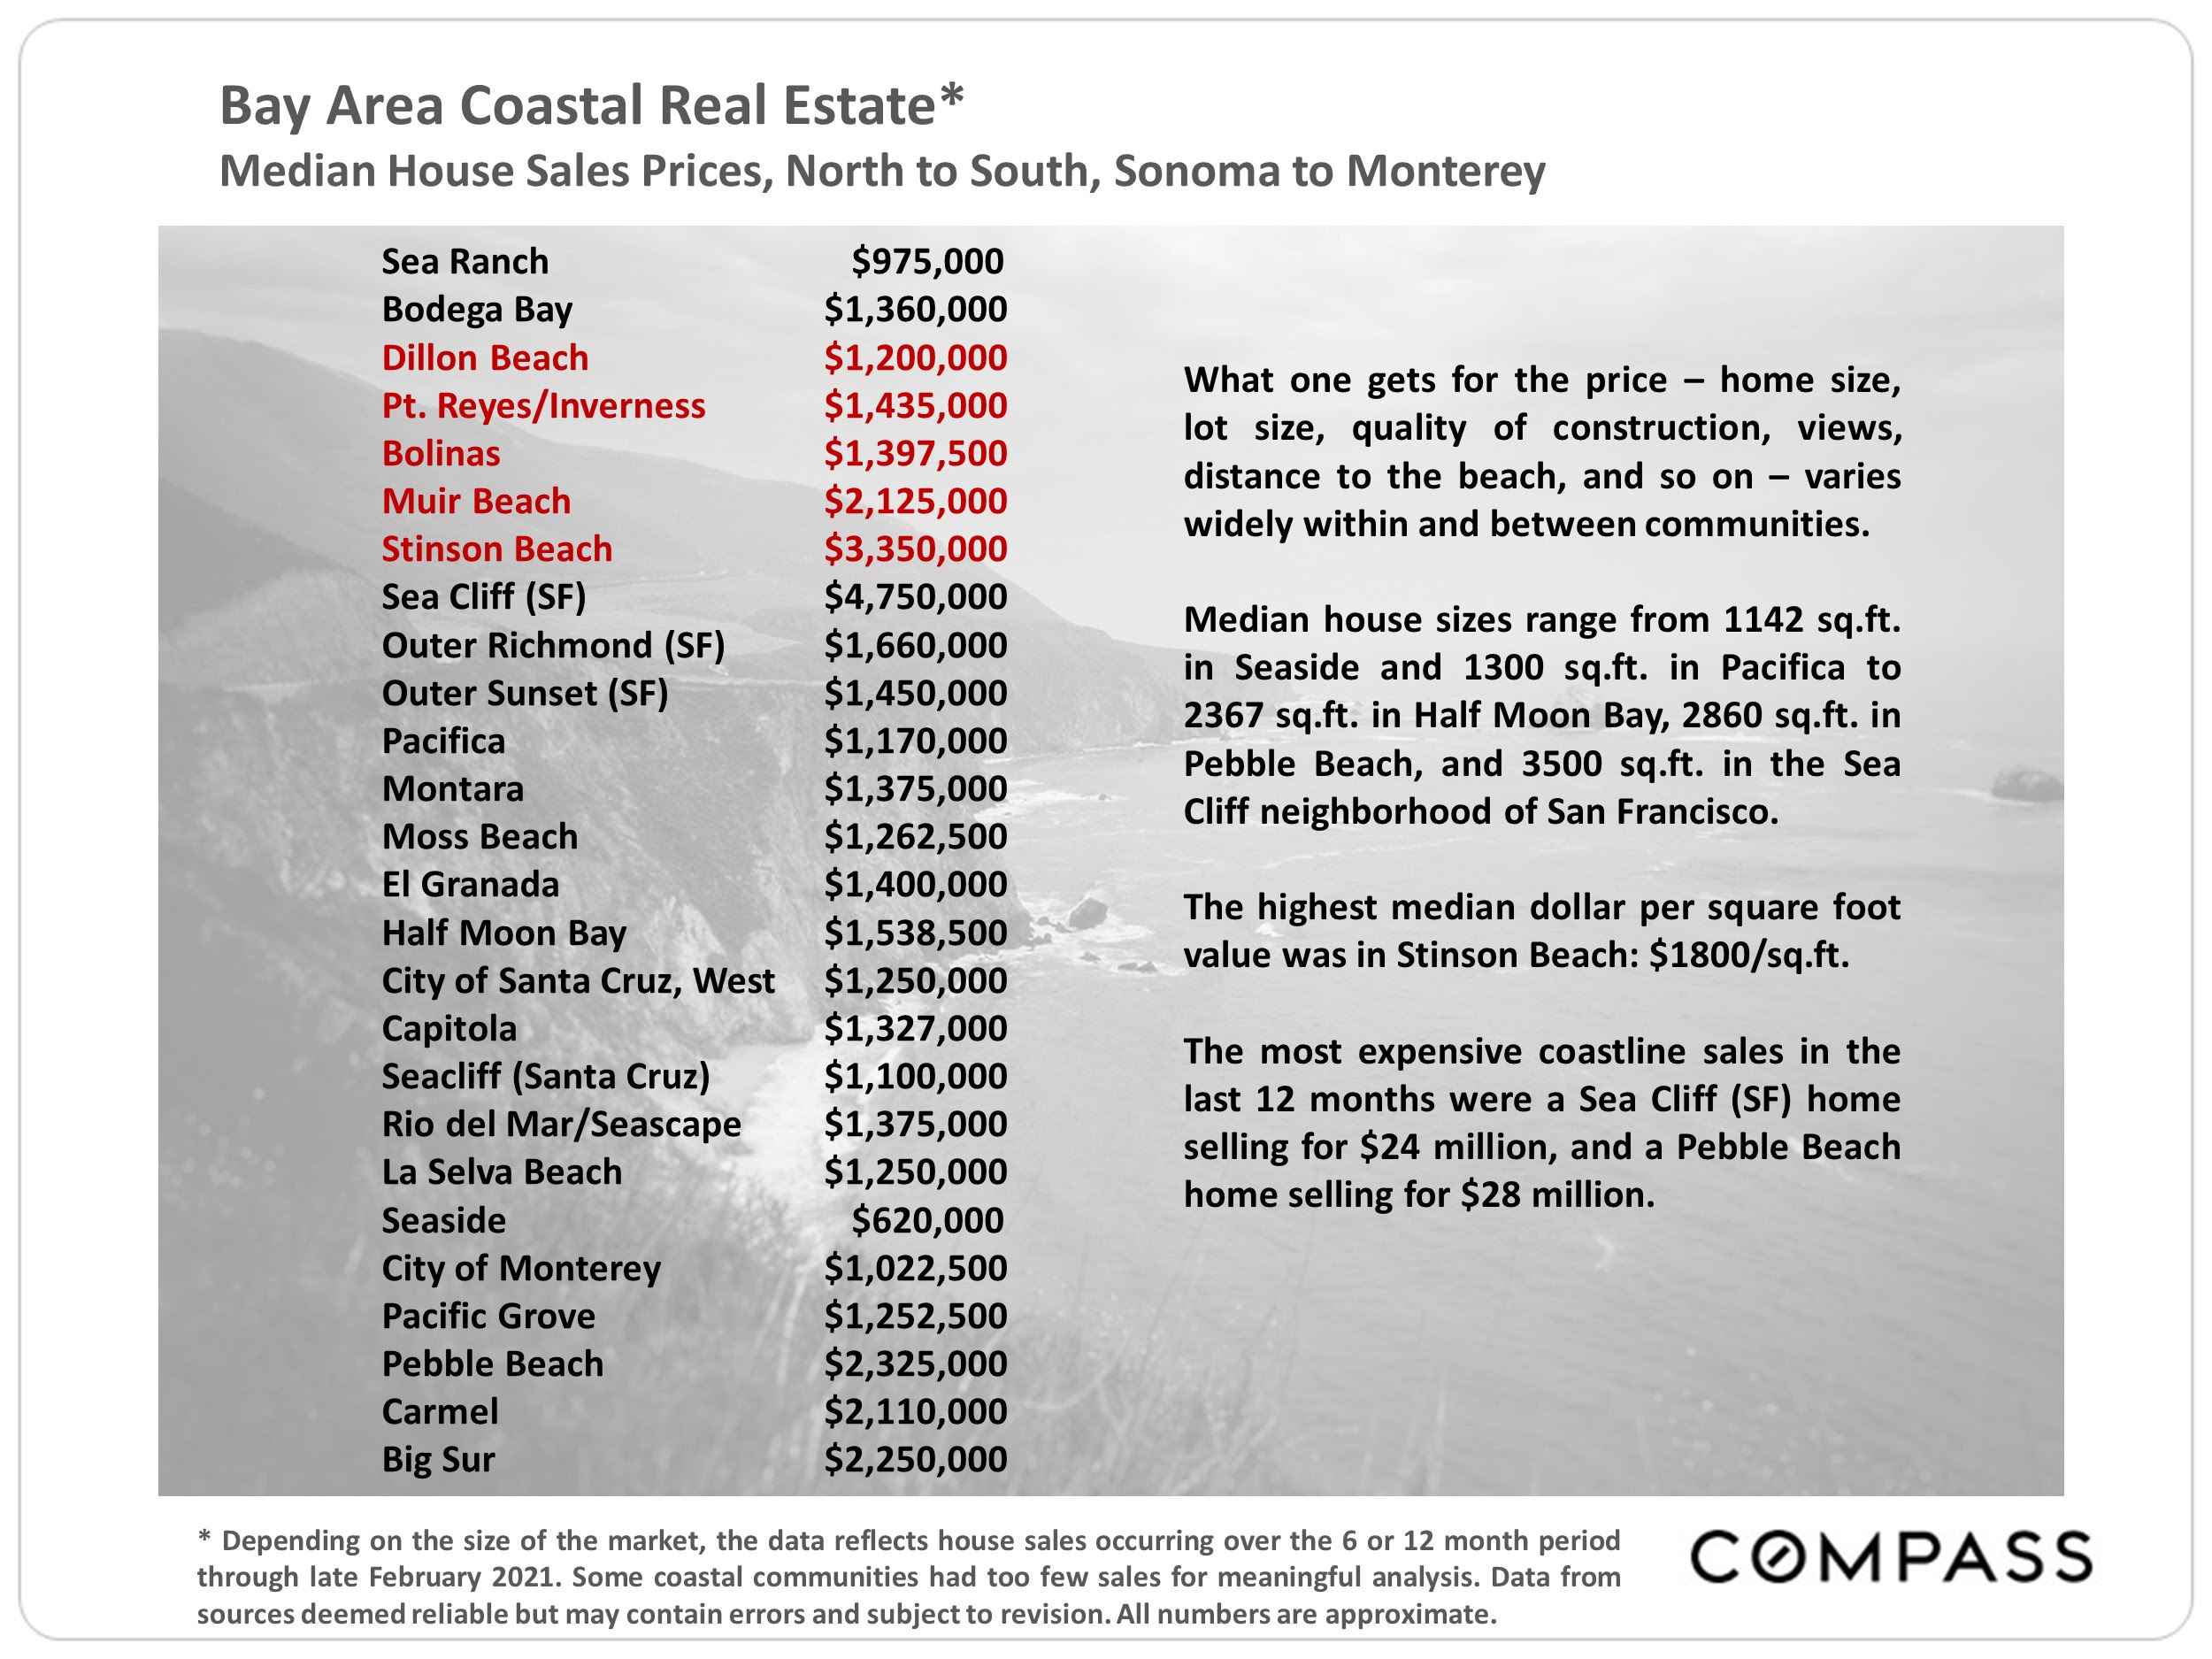
Infographic comparing median coastal home sale prices from Sonoma to Monterey, with community prices and market notes.
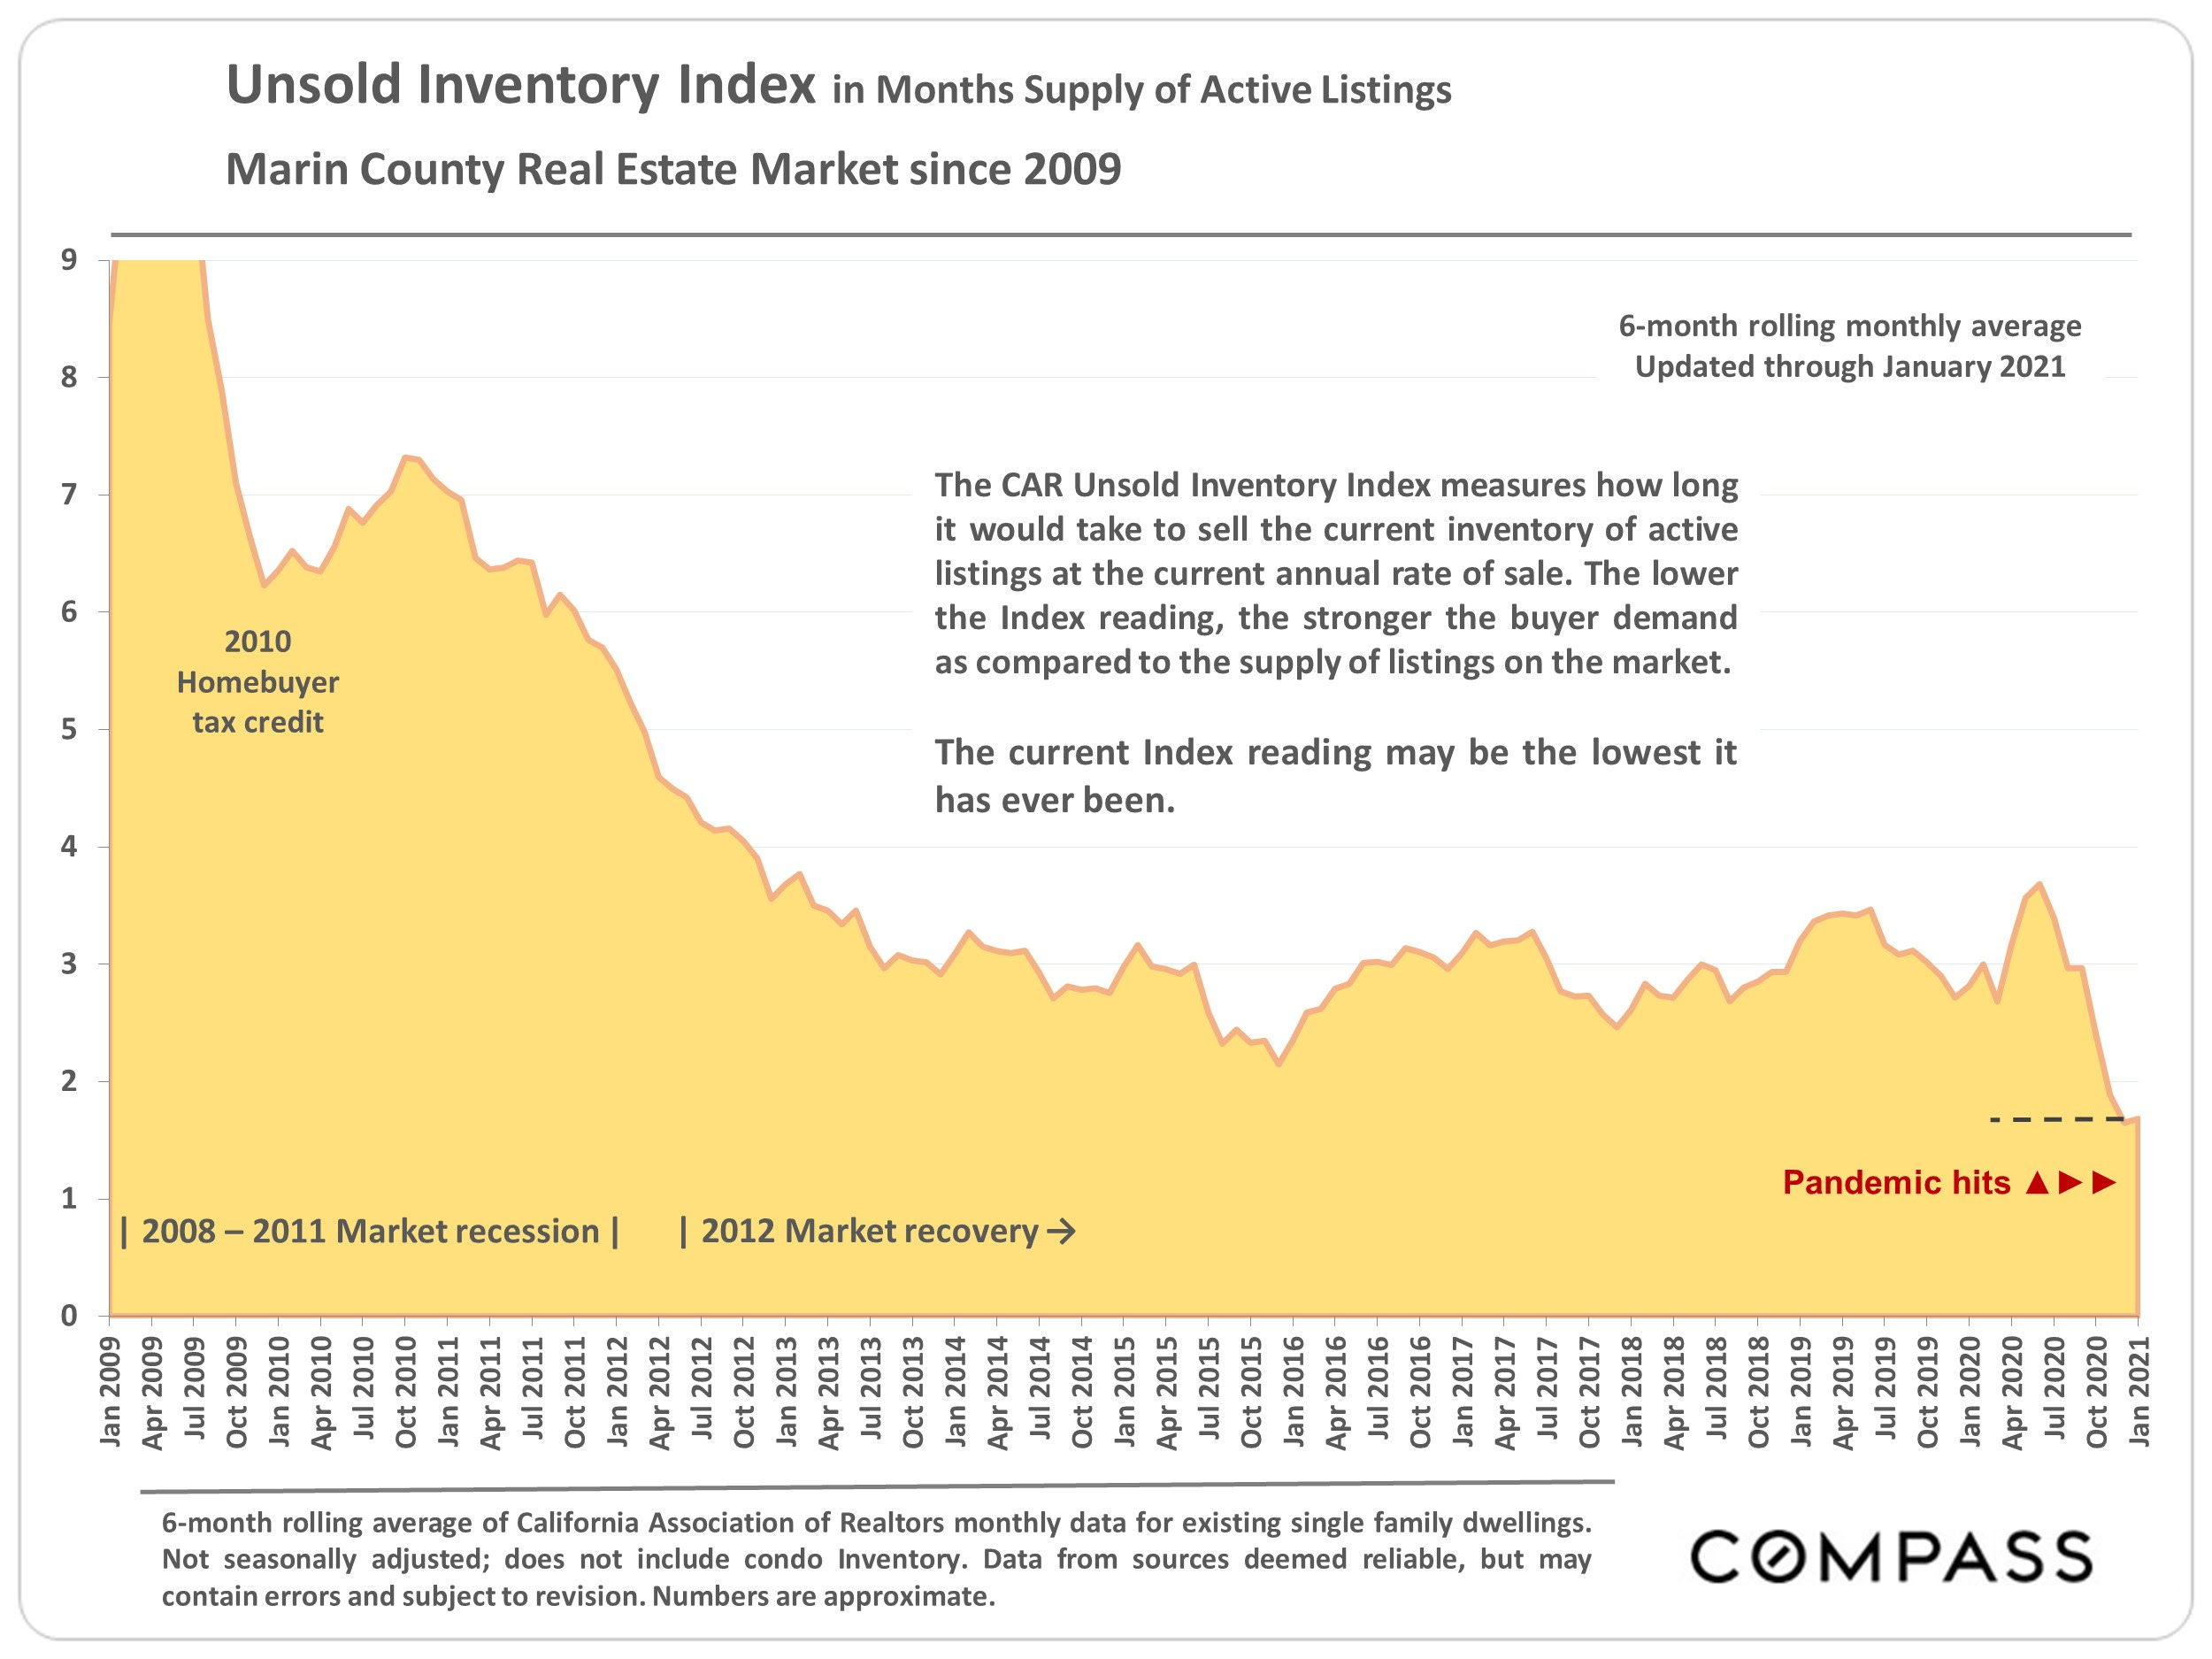
Marin County unsold inventory chart, showing months of active listings falling to under two in January 2021.
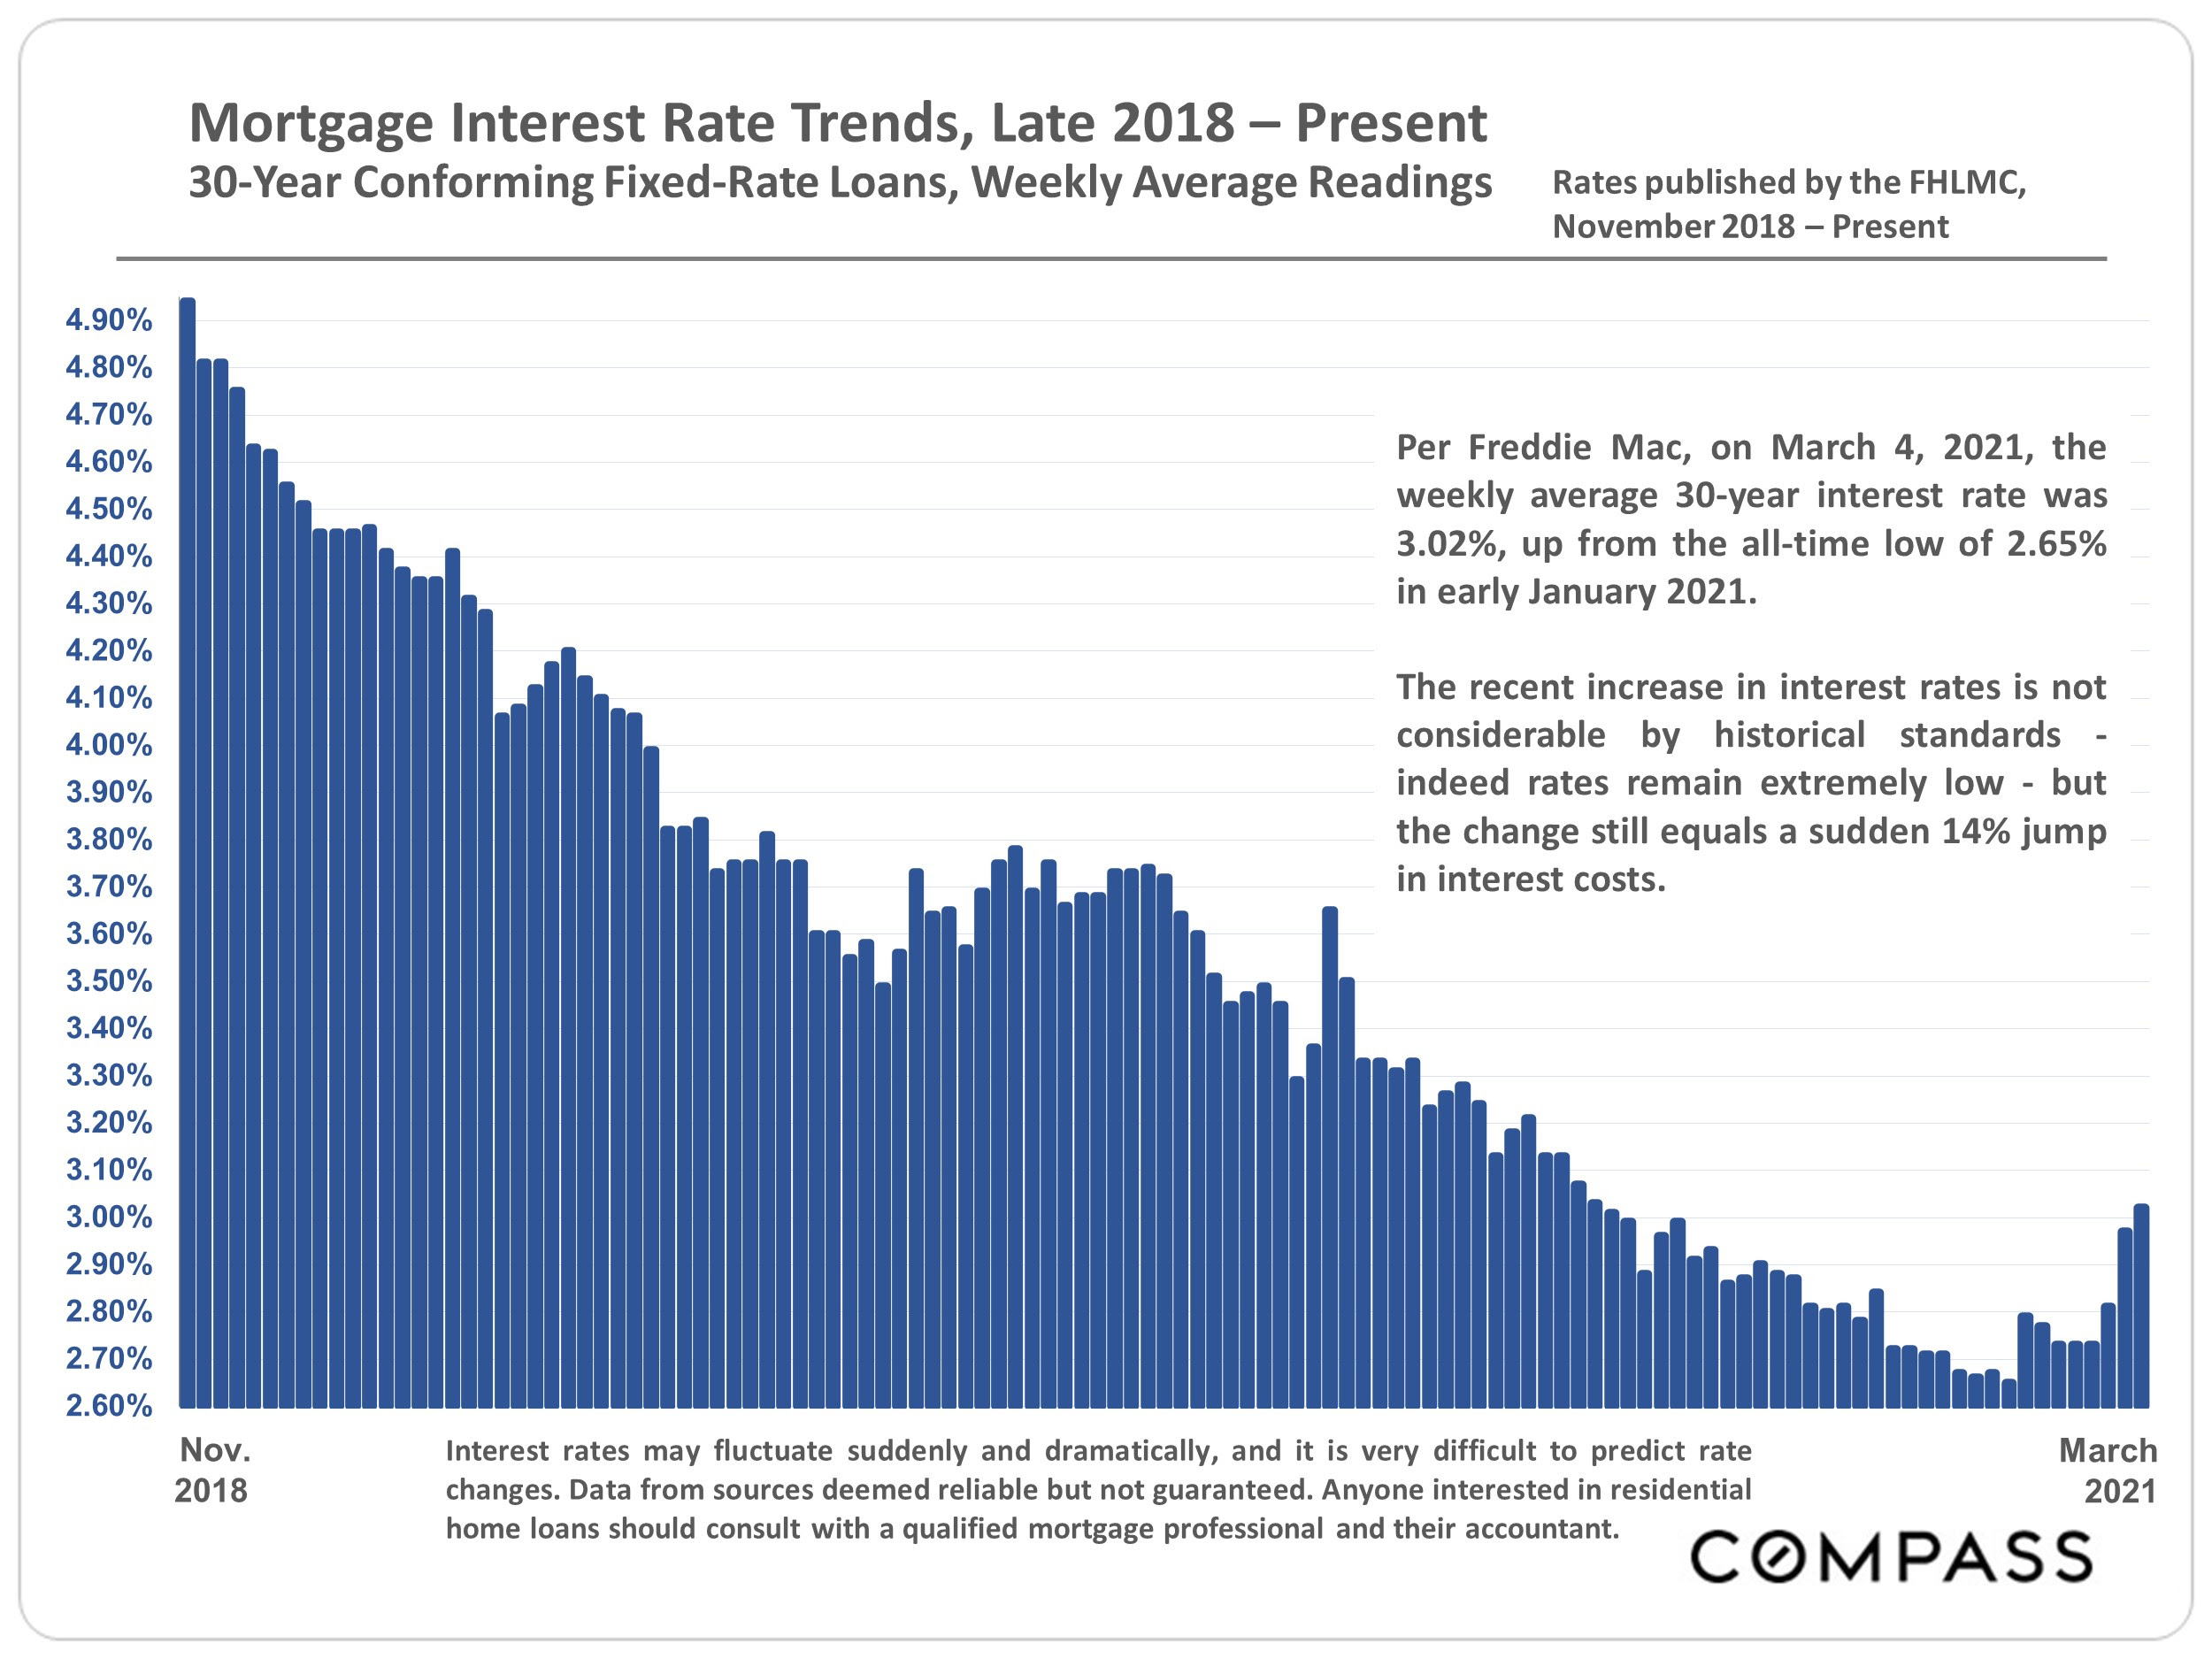
Chart of weekly 30-year fixed mortgage rates, declining from late 2018 lows before rising in early 2021.
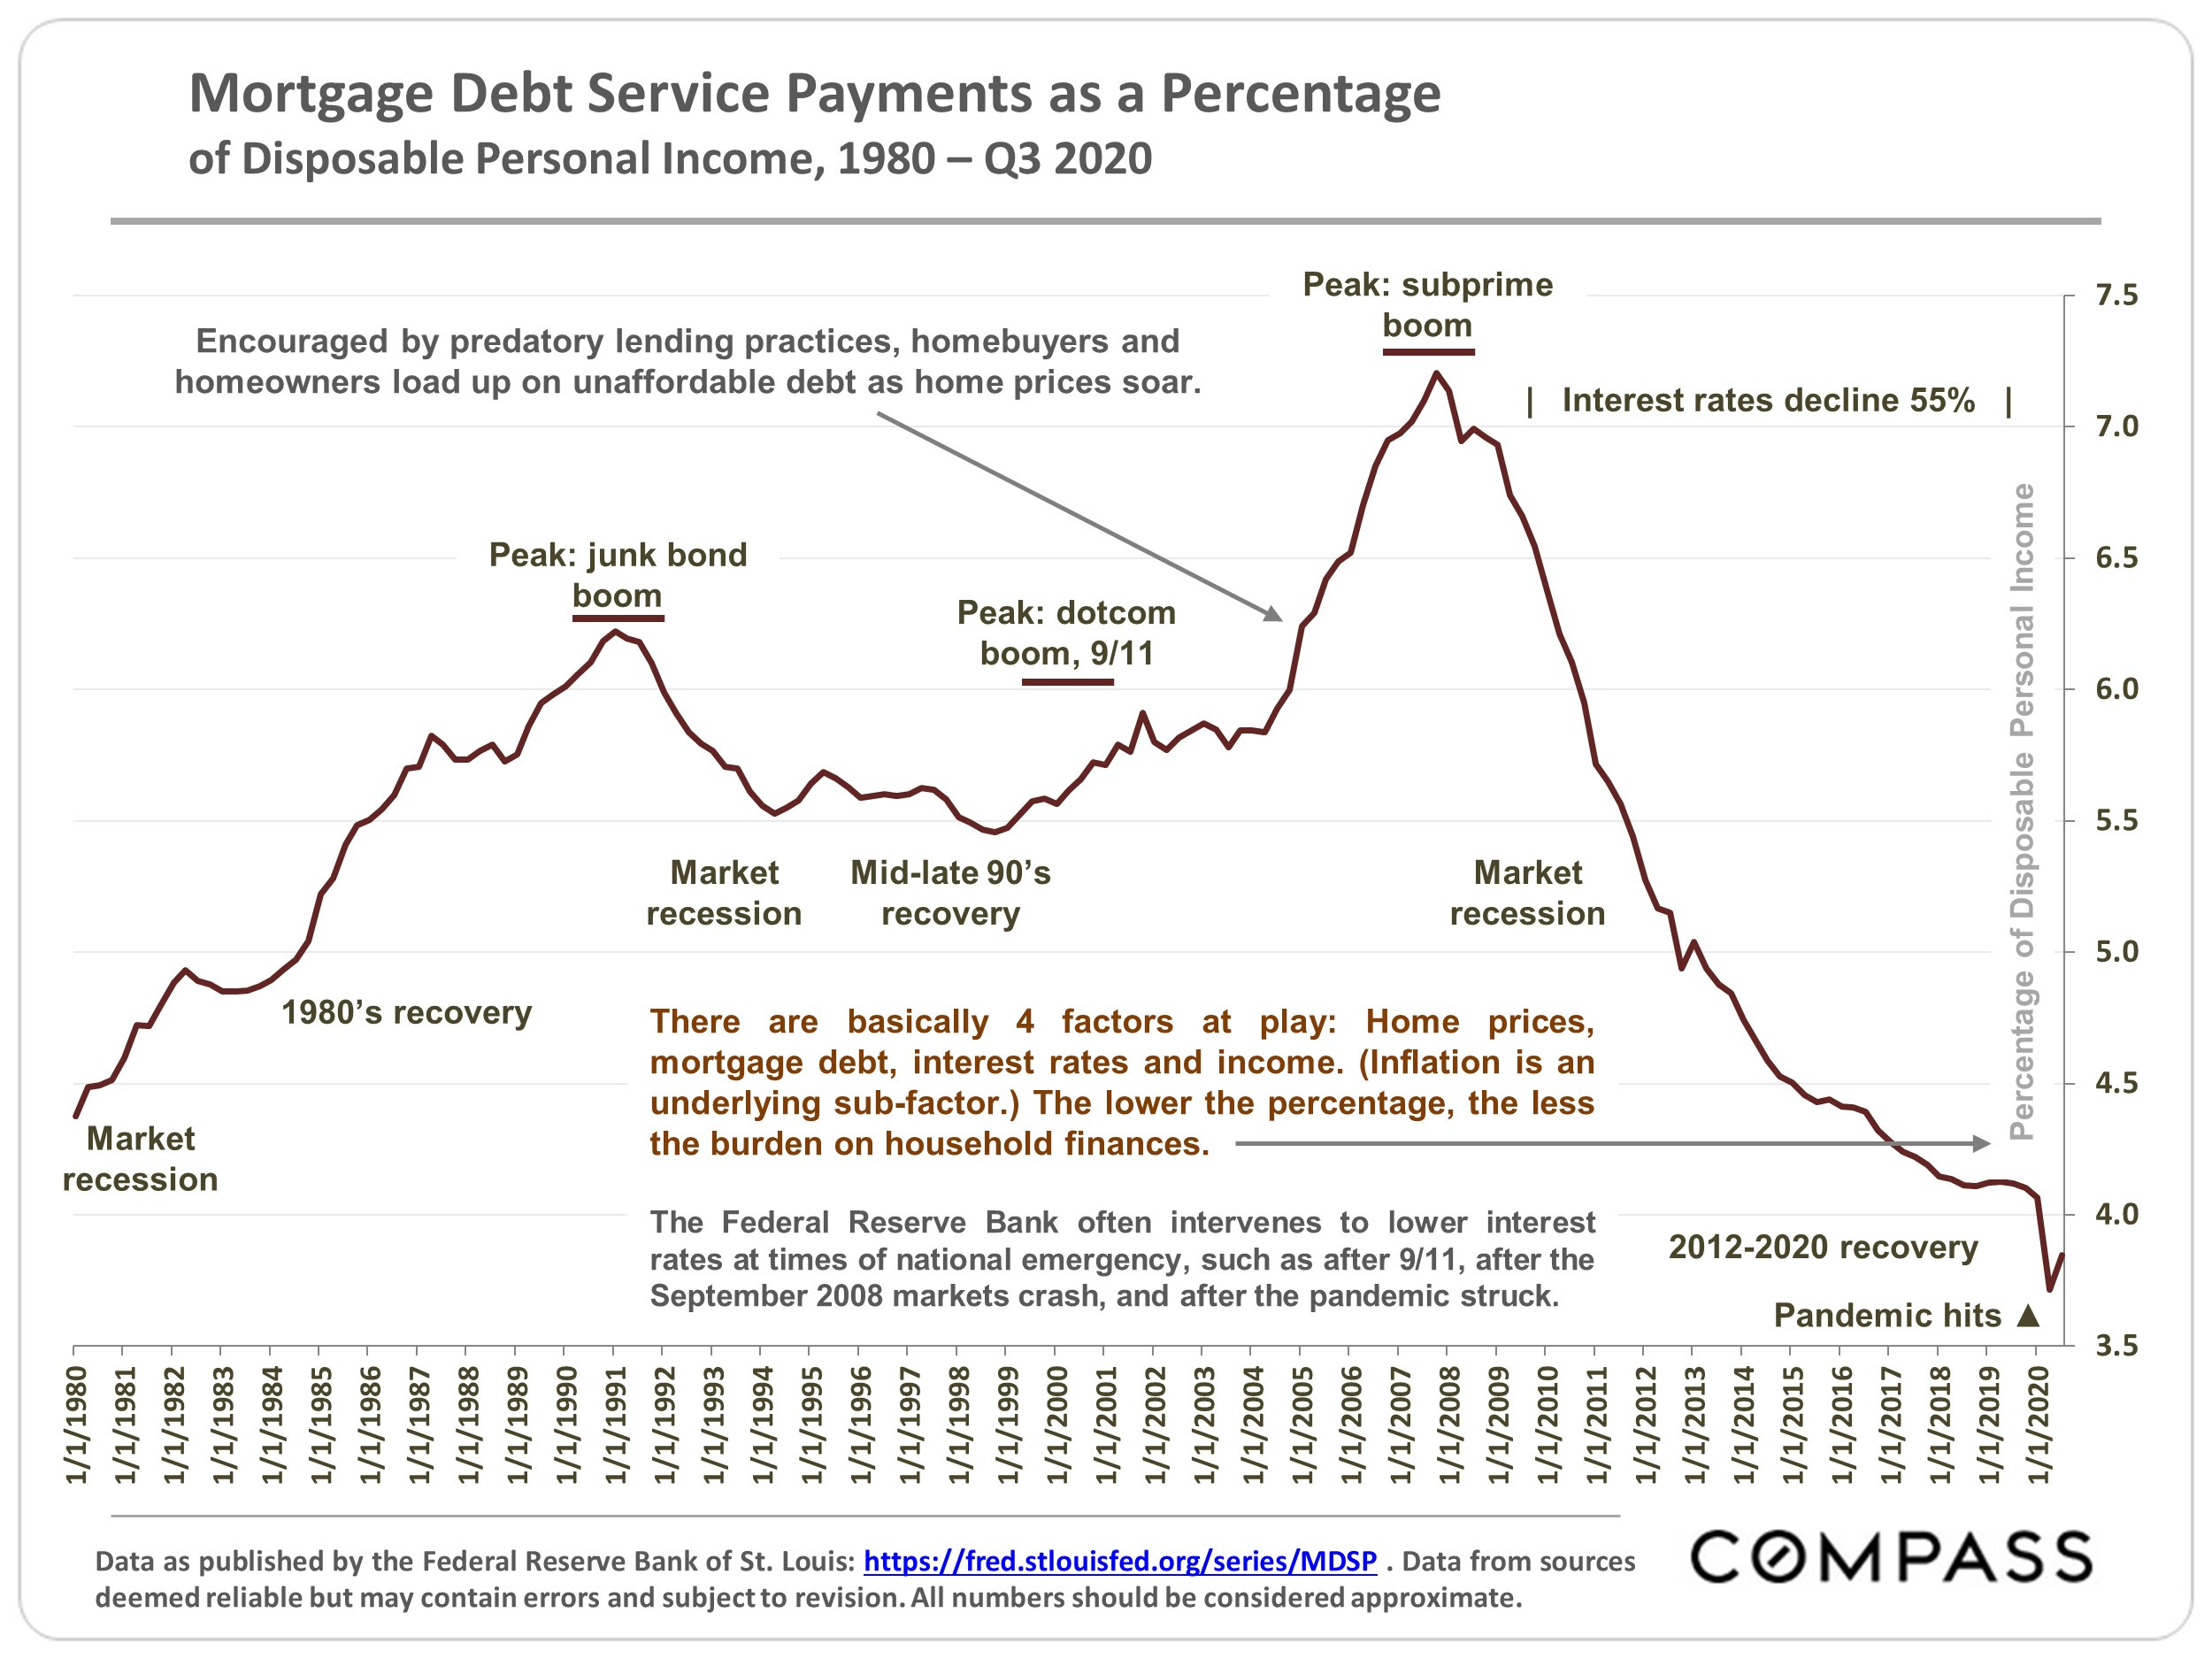
Chart of mortgage debt payments relative to income from 1980 to 2020, peaking during the subprime boom before declining.

Follow Us On Instagram