Max Armour
Green hillside framed by trees, with wooded mountains beyond under a clear blue sky.

Marin January

2020 Marin County Market Review
 
 
Grassy Marin hillside trail and rocks overlooking the bay and distant hills.


Marin County Real Estate in 2020

January 2021 Report


Pandemic, shelter in place, mass unemployment, terrible financial hardships for many residents and small businesses, new ways of working, office buildings empty out, people move, dreadful fires, an anxious presidential election, interest rates drop to historic low, IPO mania breaks out again, stock markets reach new highs, vaccines begin to arrive – and, after an initial crash in activity, the real estate market went into hyper-drive, with median home sales prices hitting new peaks. The luxury home market in particular was extremely strong.


2020: a year of social, political, economic and environmental extremes. Let us give thanks to those who worked so hard and sometimes risked their lives to help others. 


The analyses in this review were designed to be self-explanatory, but please don't hesitate to contact us with any questions. 


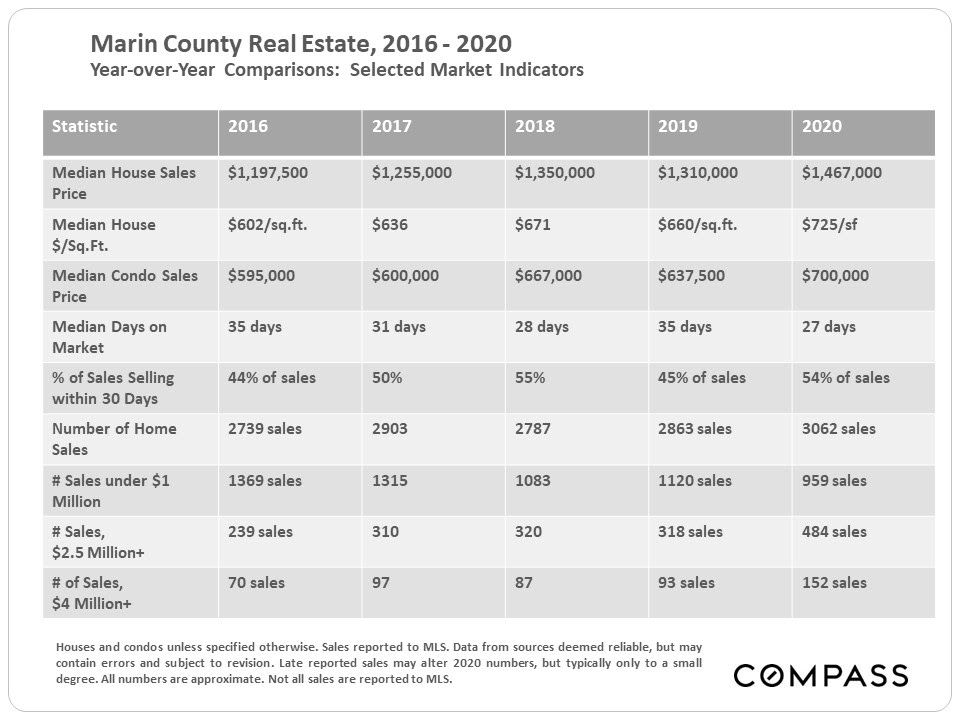
Marin County real estate market comparison table for 2016–2020, with sale prices, market times, and sales counts.
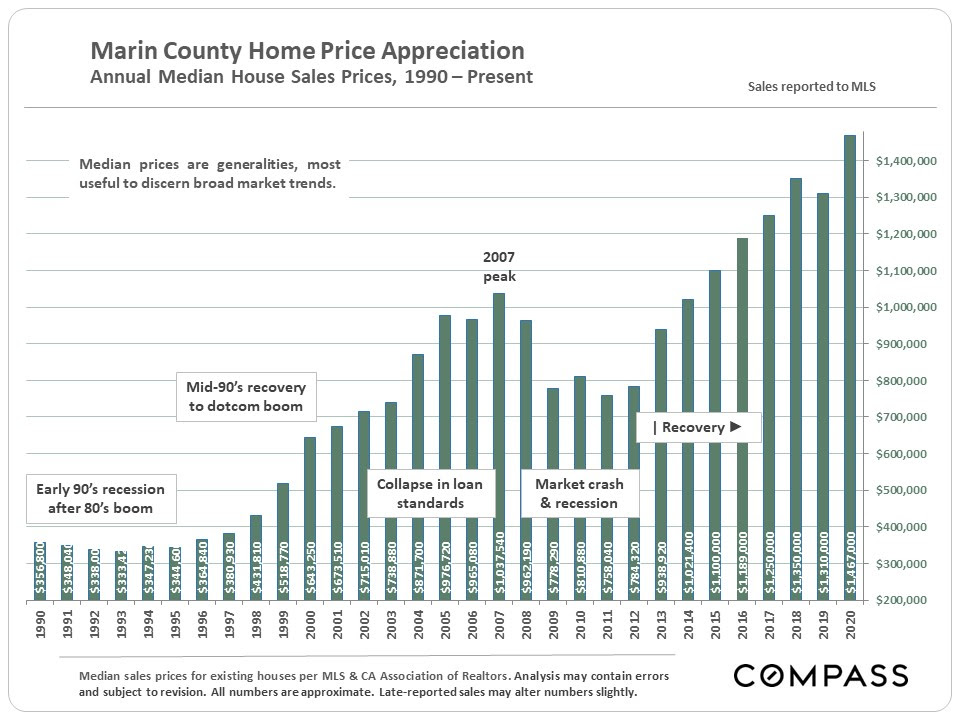
Bar chart of Marin County median home prices, rising to nearly $1.47 million in 2020 after a 2007 peak and recession.
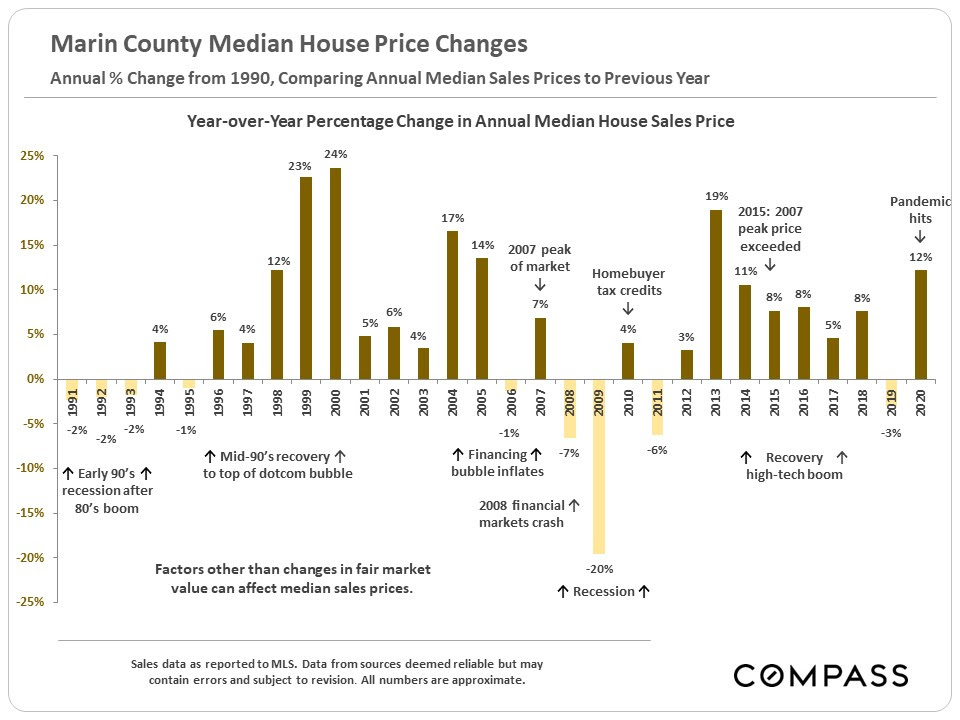
Chart of Marin County annual median house price changes, 1991–2020, with historical market annotations.
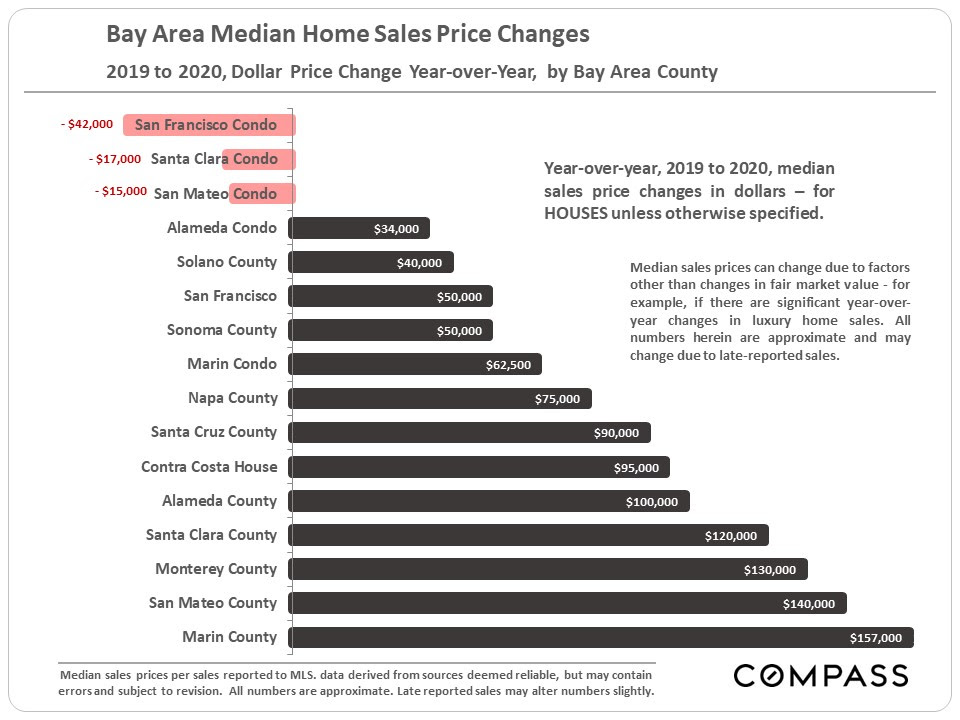
Bar chart of 2019–2020 Bay Area home price changes, led by Marin County’s $157,000 increase and three condo declines.
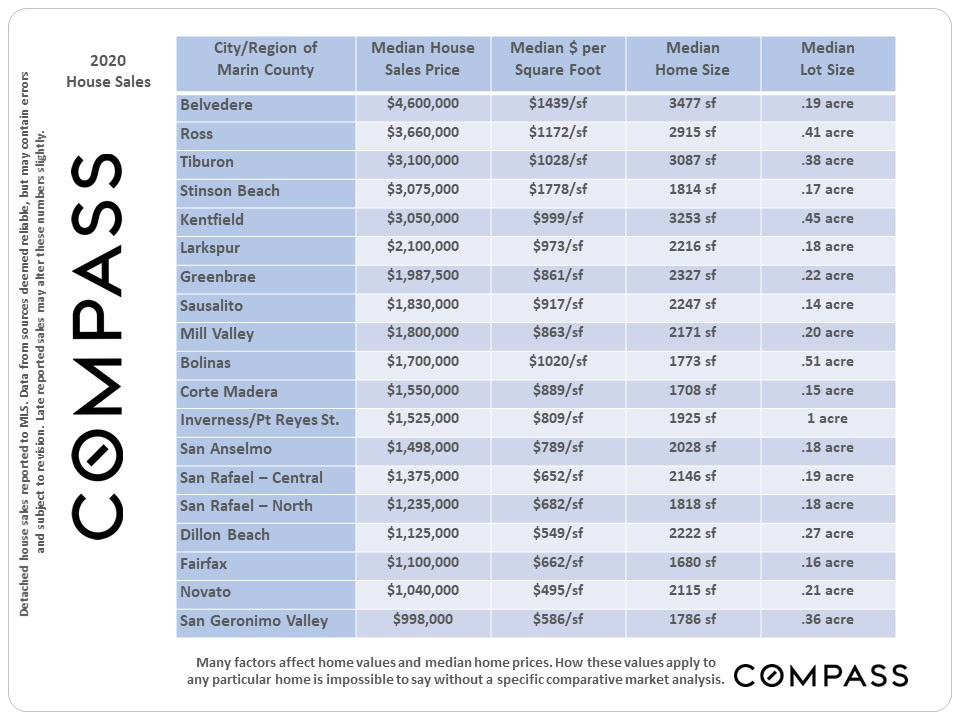
2020 Marin County home sales table comparing city, median price, home size, and lot size.
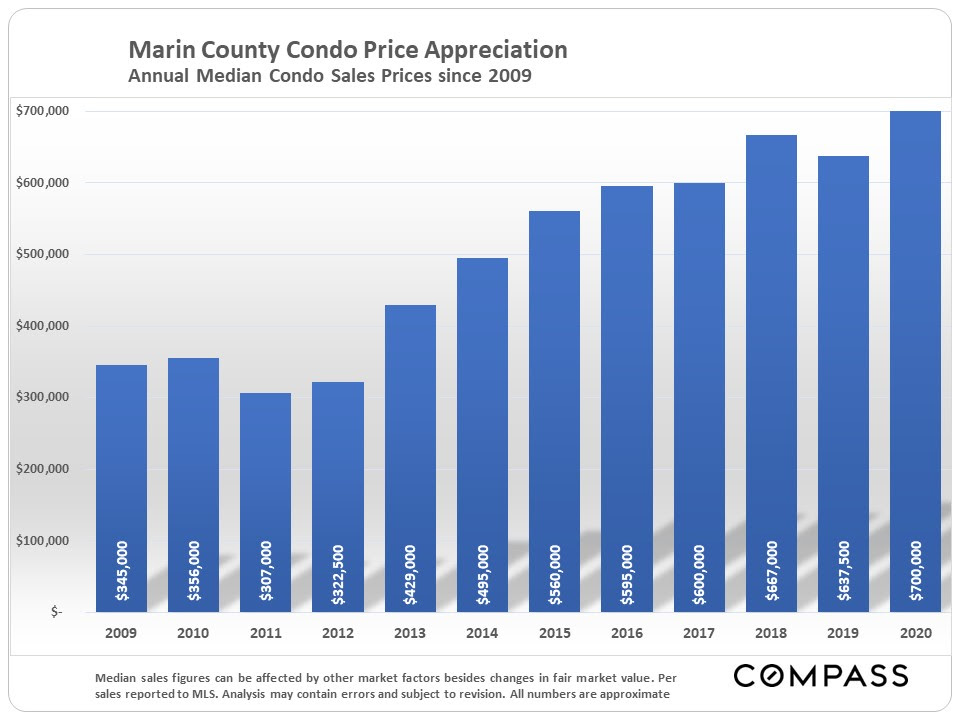
Bar chart of Marin County median condo prices from 2009 to 2020, rising overall from $345,000 to $700,000.
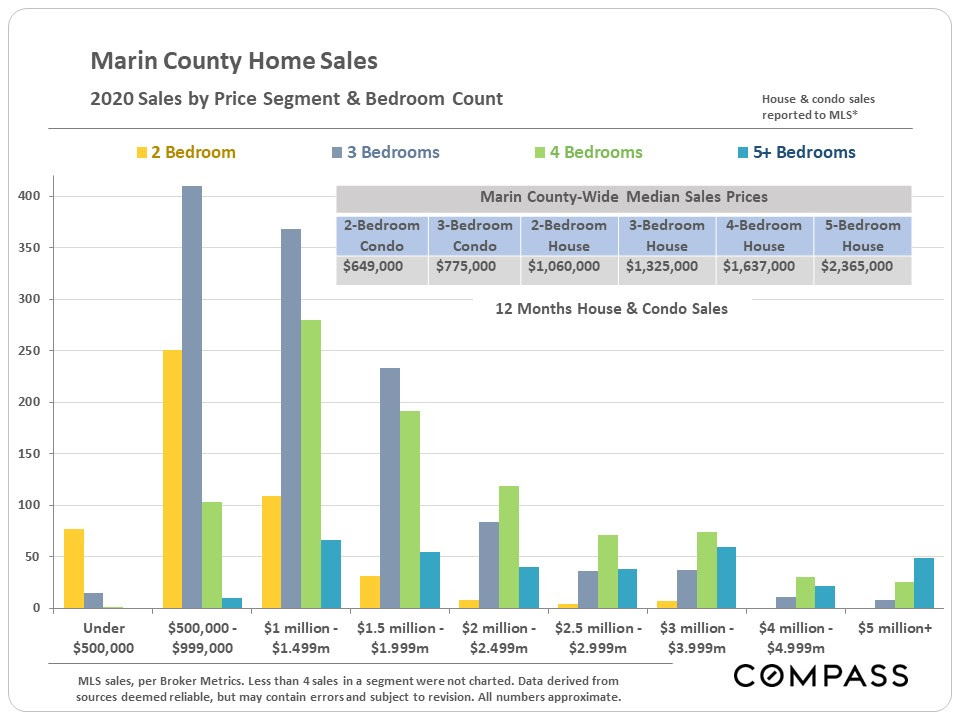
Chart comparing Marin County 2020 home sales by price range and bedroom count, with median sale prices.
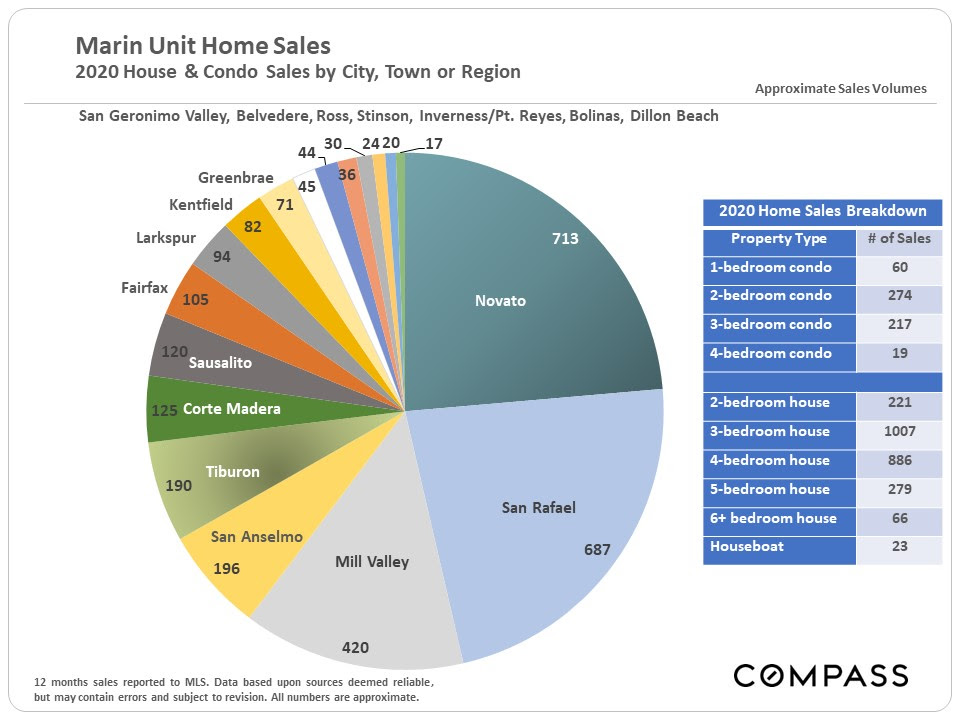
Chart of approximate 2020 Marin home sales by city and property type, with Novato and San Rafael leading.
Bar chart of Marin luxury home sales over $2.5 million by month, showing a sharp summer 2020 surge.
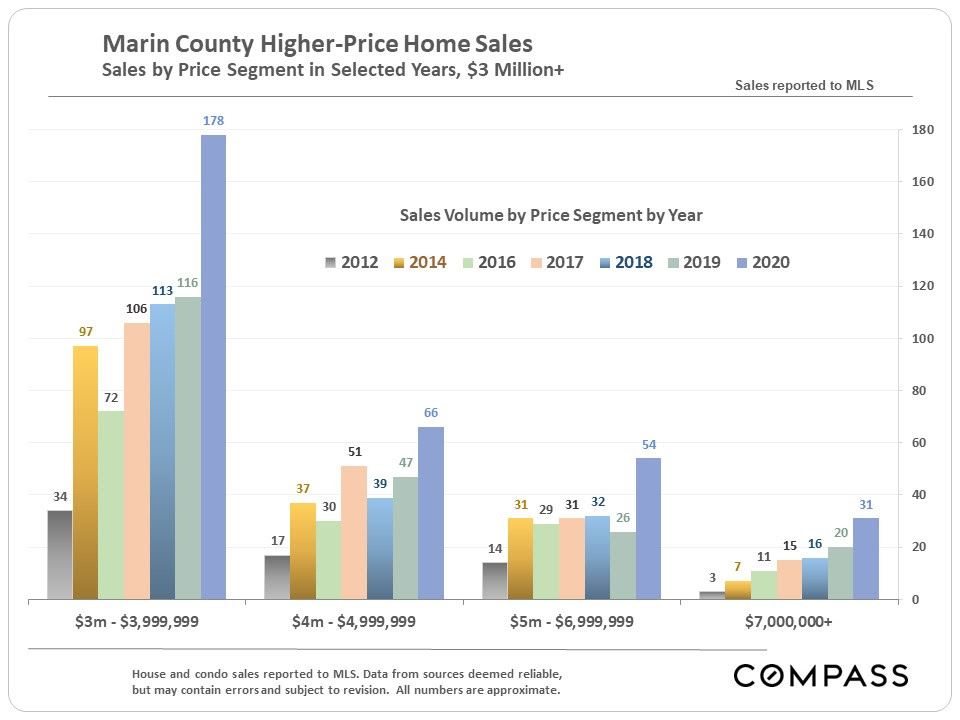
Bar chart comparing Marin County home sales over $3 million by price segment and year.
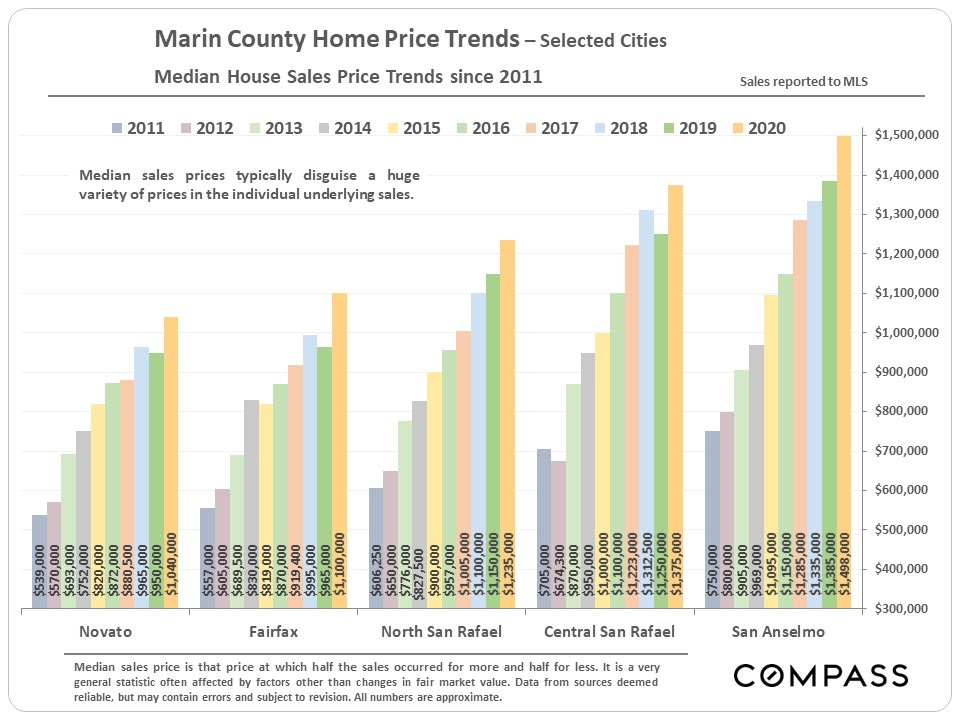
Bar chart comparing 2011–2020 median home prices in five Marin County cities; San Anselmo reaches about $1.5 million in 2020.
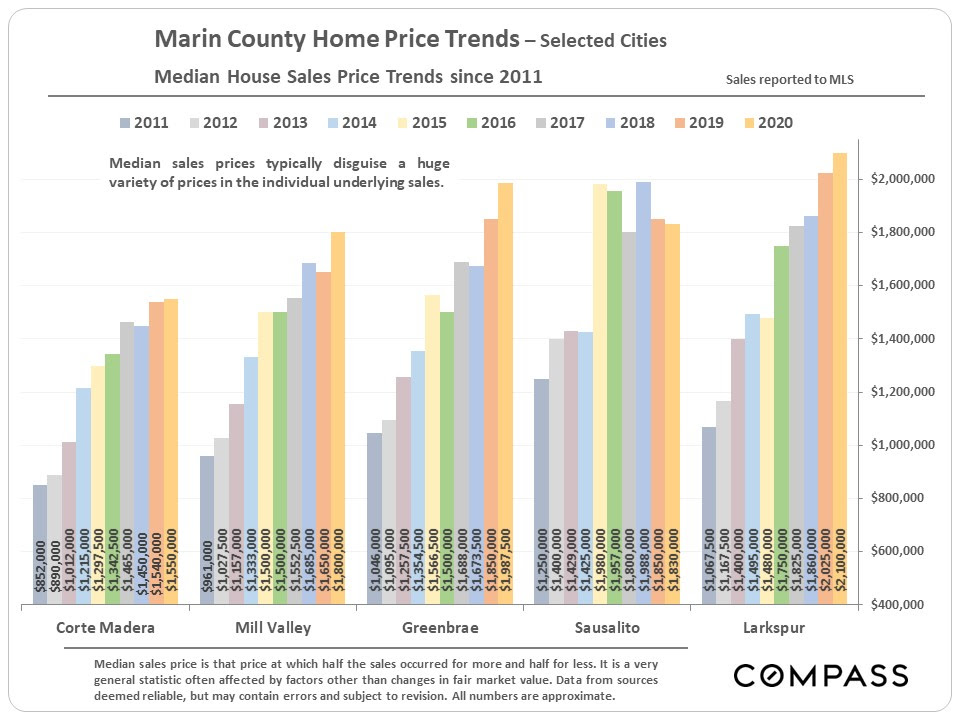
Bar chart comparing median home sale prices from 2011–2020 across five Marin County cities.
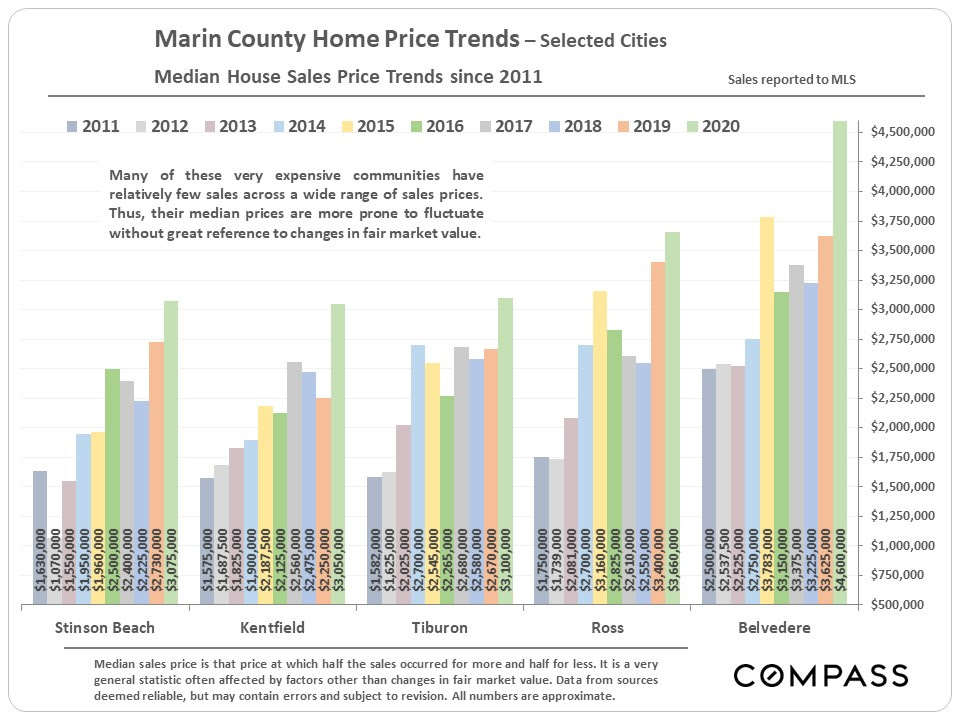
Chart comparing median home sale prices from 2011 to 2020 in five Marin County communities.
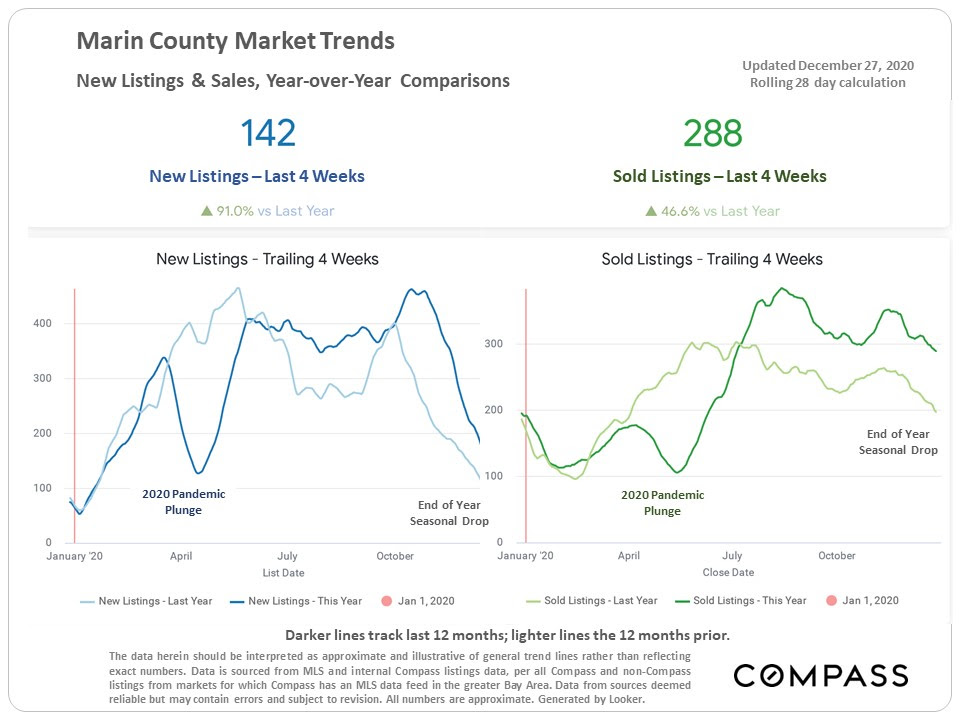
Marin County market trends chart comparing new listings and sales year over year.
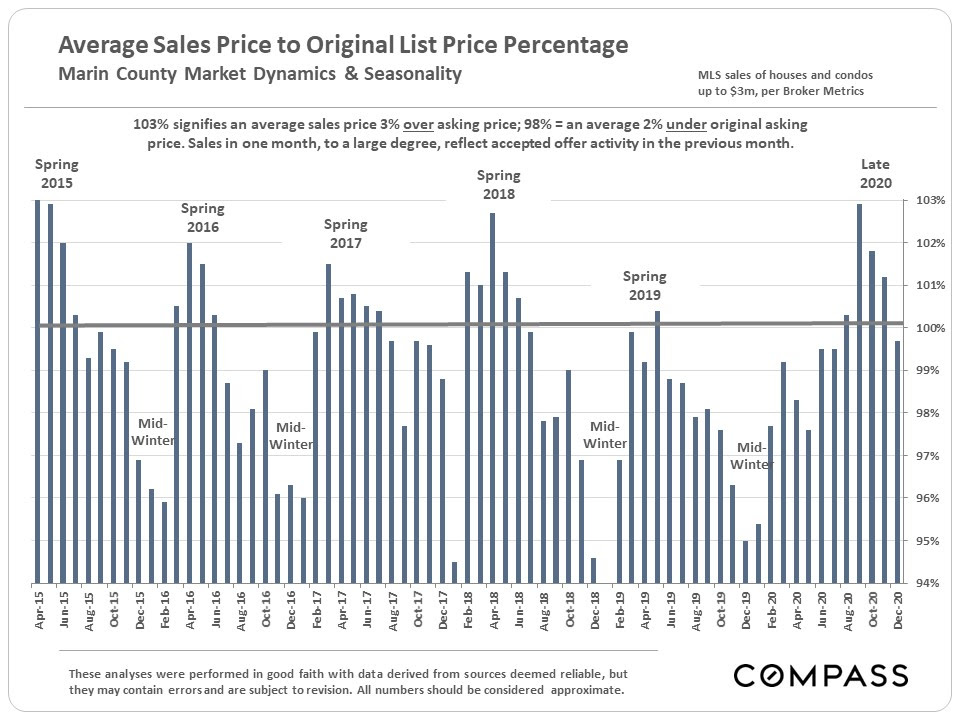
Chart of Marin County sale prices versus original list prices, April 2015 to December 2020.

Follow Us On Instagram