Max Armour
Green parkland and a sunlit lawn beneath wooded mountains and a clear blue sky.

Marin County Real Estate September Report

Home Prices, Market Conditions & Trends Report
 
September 2022 Marin County real estate report cover over a mountain, forest, and meadow landscape.
Marin County market update featuring broker Max Armour and commentary on buying, selling, and housing inventory.
Marin County home prices and market trends report by Compass Chief Market Analyst Patrick Carlisle.
 
Marin County monthly median home price chart, with blue bars peaking in April 2022 at $2,218,500.
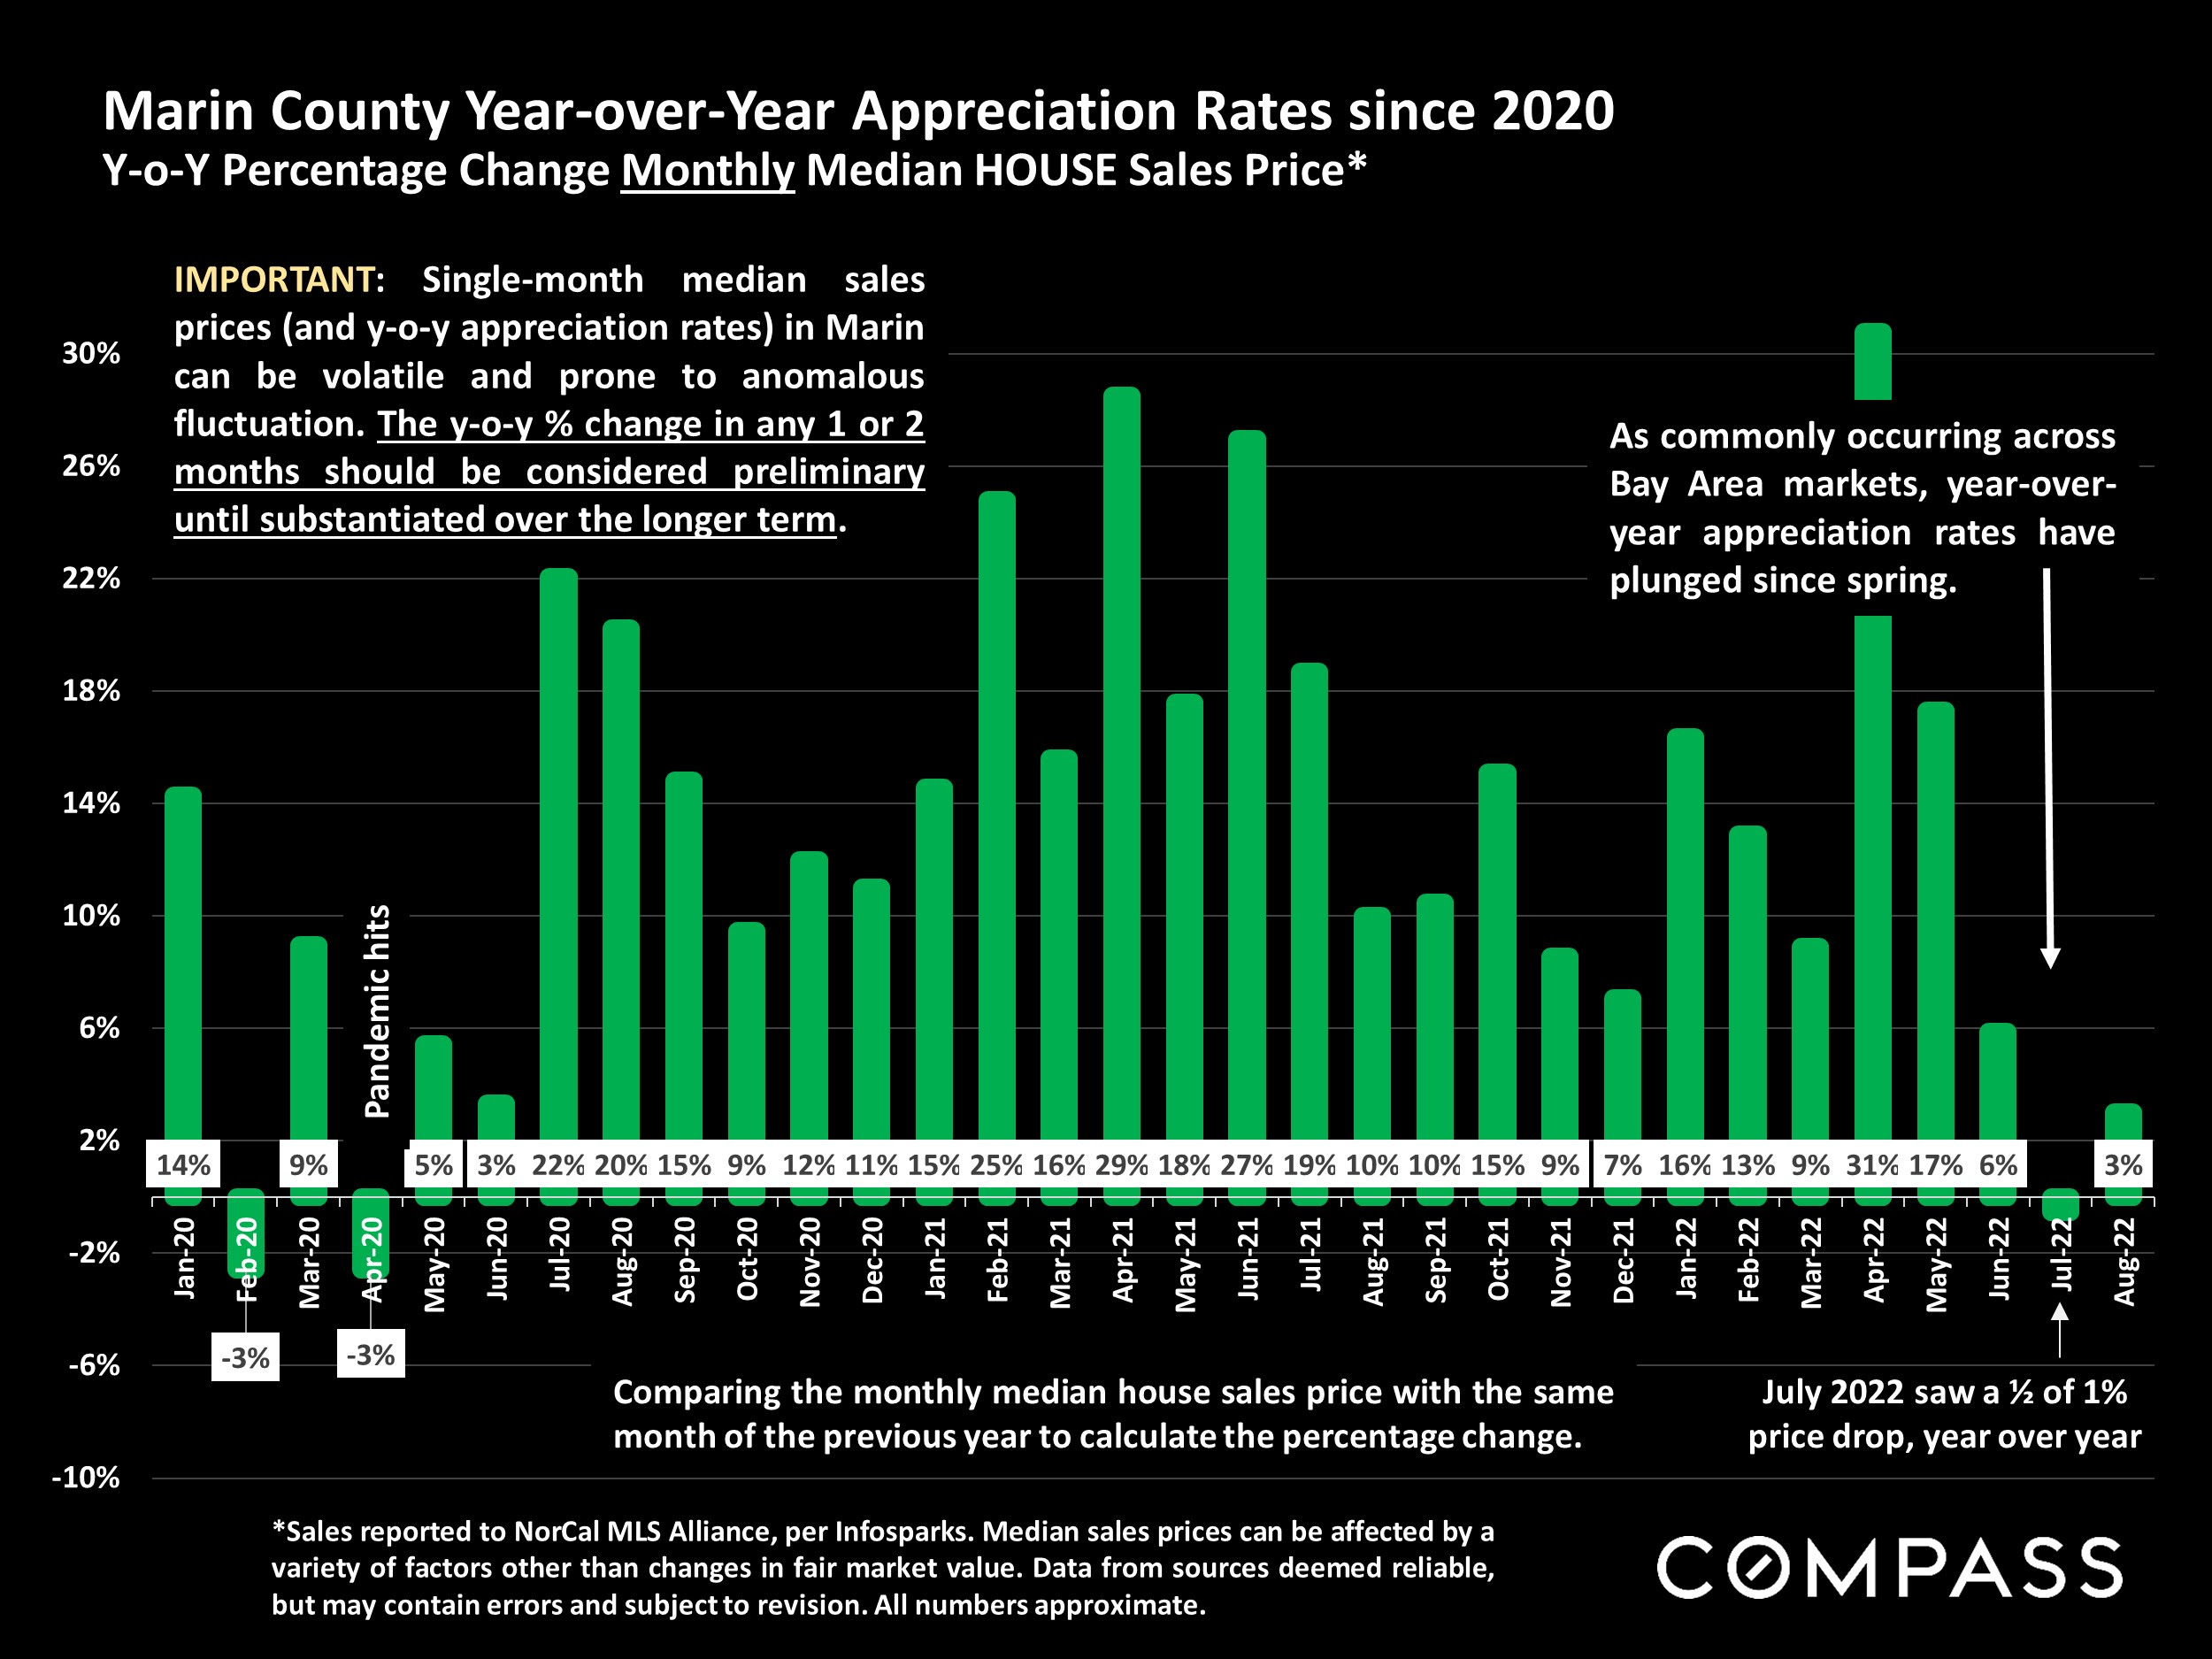
Chart of Marin County home price appreciation, with monthly year-over-year changes from January 2020 to August 2022.
Line chart compares Marin County home sales in 2021 and 2022; August sales fell from 327 to 245, down about 25%.
Chart of Marin County home sales closing over list price from 2018 to August 2022, ending at 45%.
Marin County sale-to-list price chart, with monthly bars from 2018 to 2022 and a dashed 100% reference line.
Marin County average days on market chart, with monthly bars from 2019 to August 2022 and seasonal annotations.
Chart comparing 2021 and 2022 Marin County new listings, with August 2022 down about 21% year over year.
Line chart comparing Marin County active listings in 2021 and 2022, with 2022 peaking at 366 in July.
Marin County active listings bar chart, January 2017–August 2022, with a marked June 2019 peak.
Chart of Marin County listing price reductions, January 2018–August 2022, with seasonal peaks and a pandemic marker.
Marin County chart compares 2021 and 2022 listings going into contract, with 2022 falling to 35% by August.
Bar chart of Marin monthly home sales, January 2018–August 2022, with seasonal peaks and a June 2021 high.
Bar chart of monthly Marin County home sales over $3 million, January 2018 to August 2022.
Bay Area 2022 large-home sales table by county, with the Marin County row highlighted.

Let's connect!


Follow Us On Instagram