
|
San Francisco Real Estate |
|
A Strange & Challenging Year Begins Winding Down December 2020 Report
|
|
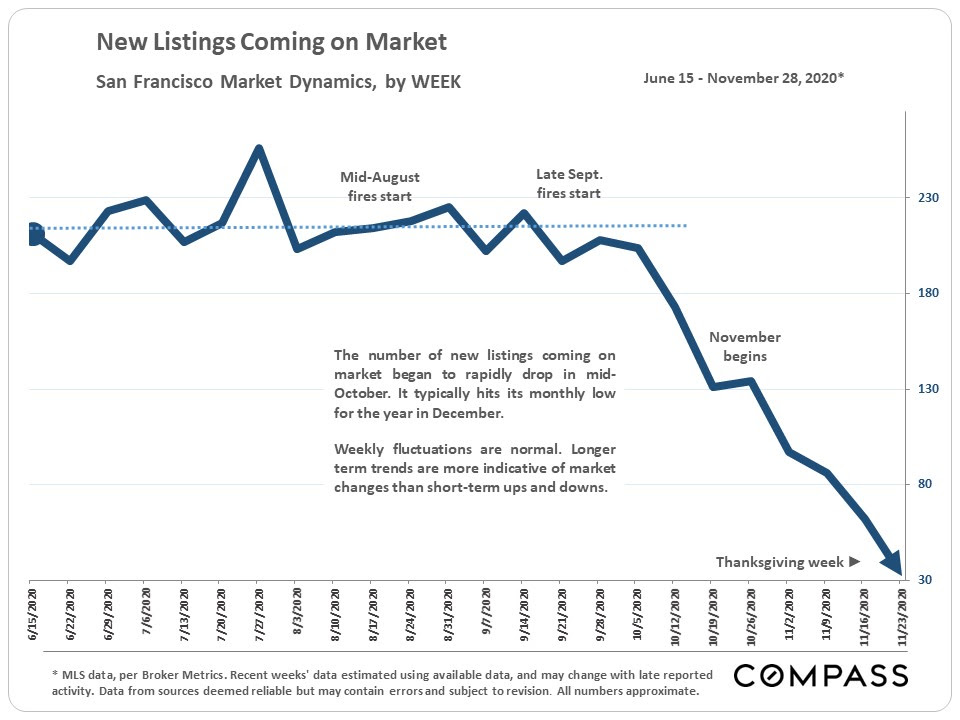
Though the pandemic upended many normal seasonal trends this year, the market did begin its typical “holiday season” slowdown in November - however activity remained well above levels of last year. It is unknown how the latest Covid-19 circumstances may affect the market in December, which is usually by far the slowest month of the year. More importantly, we hope you and your loved ones stay safe and well during this holiday season. ------------------------------ As is typical, the number of new listings plunged in November. In the first week of December - not illustrated on this chart - new listing activity ticked back up from the short Thanksgiving week, but remained well below pre-November numbers. December is usually the month with the lowest number of new listings coming on market. |
 |
|
Year-over-year median sales prices for condos of various sizes, and for houses, in September through November of 2018, 2019 and 2020. A big increase in supply since the pandemic struck has led to declines in condo median sales prices. |
 |
|
Market activity as measured by the number of listings going into contract is significantly higher on a year-over-year basis: over 40% higher than in November 2019. |
 |
|
The below chart measures demand as compared to the supply of listings available to buy. By this metric, the house market has been significantly stronger than the market for condos since the pandemic struck. |
 |
|
4 charts and tables looking at the luxury home markets of San Francisco and those within the larger region. The luxury home market is fiercely seasonal in nature, but the pandemic upended some of the typical trends. |
 |
 |
|
The Bay Area counties which have seen the largest percentage increases in the sales of luxury homes since May have been Sonoma and Santa Cruz (despite the fires), and Monterey. Not shown on this chart: Lake Tahoe saw a incredible 187% jump in luxury home sales. |
 |
|
This next table looks highest priced listings on the market in early November, and the highest priced sales in the May-October period. Since it was compiled, a higher sale closed in San Francisco, in the Sea Cliff neighborhood, at $24,000,000. |
 |
|
This last chart tracks percentage changes in median house sales price since 1990. It is based upon the Q1 2000 price being indexed to 100: A reading of 50 signifies a median price half that in Q1 2000; 200 means the price has doubled since then. In early 1990, the SF median house price was about $300,000; it is currently running about $1,650,000. |
 |
 |
 |
As we approach the end of the year and the holiday season, I would like to express my deepest gratitude to you. Your continued trust in me and my team means everything to us.
As always, please contact me with any real estate questions. Wishing you a safe and enjoyable holiday season!
All the best,
Max
|