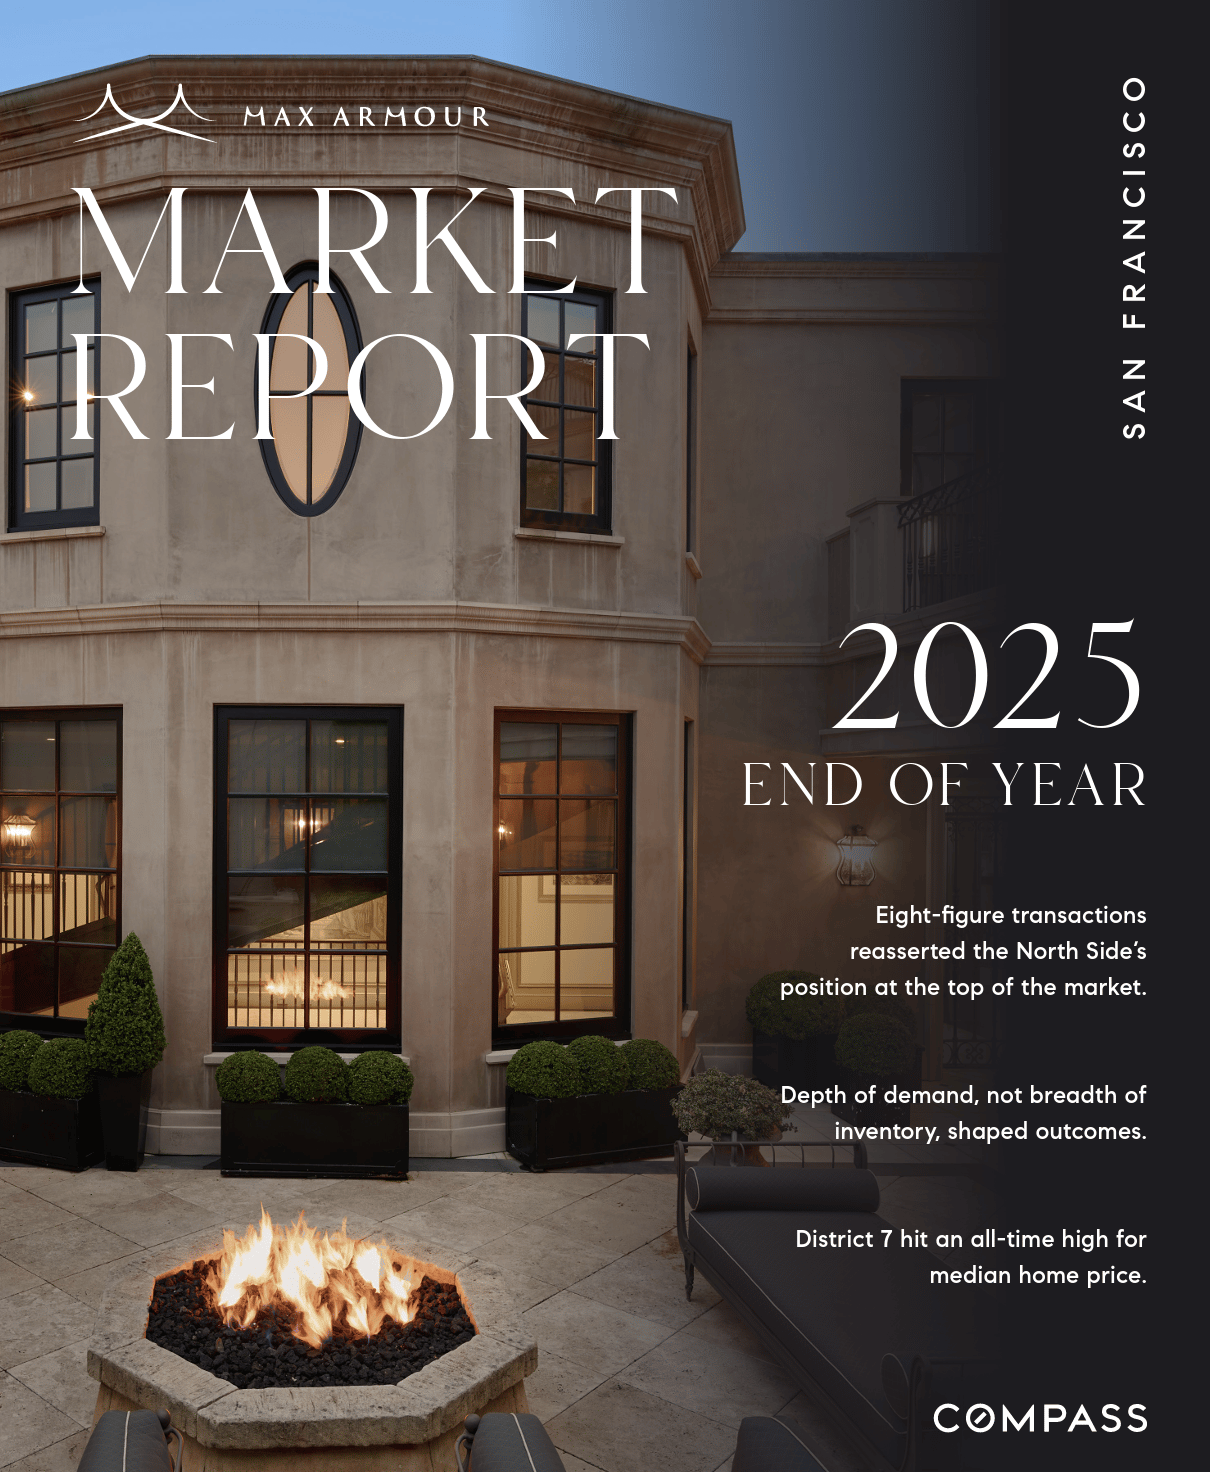
Market Report · April 2026
Shrugging Off War,
the SF Market Only Gets More Heated
San Francisco Real Estate · Data through March 2026 · Max Armour, Compass
The San Francisco market has entered spring 2026 with a ferocity we have not seen since April 2022. House prices have broken their all-time record. Competition is at a four-year high. Luxury sales are setting monthly records. And through it all — geopolitical uncertainty, tariff shocks, an Iran war and ceasefire — buyers and sellers in San Francisco have barely blinked.
— Max Armour, Luxury Real Estate Advisor · Compass SF & Marin
Market Snapshot
|
Median house price
$2.15M
+18% year over year
New all-time high
|
Median condo price
$1.36M
+27% year over year
2nd highest ever
|
Houses over list
85%
Avg 23% over ask
Tied 2022 record
|
|
Avg days on market
29
Fastest since spring 2022
|
Active listings
835
−28% year over year
As of April 1
|
Price reductions
−39%
Vs. March 2025
|
5 Key Observations
House prices just broke the 2022 record
The citywide median house sales price reached $2,150,000 in March — an 18% gain year over year and the highest monthly figure ever recorded, edging past the previous peak of $2,050,000 from April 2022. Condo prices are close behind at $1,357,500, up 27% YoY and the second-highest reading in history. The AI industry boom and extreme scarcity of listings are the primary forces driving this surge.
North SF is where the city's most extraordinary values live
If your focus is the north side of the city, the numbers are striking. Presidio Heights leads all neighborhoods at an $8.09M median, with Pacific Heights at nearly $7M, Cow Hollow at $6.45M, Sea Cliff at $4.64M, and the Marina at $4.1M. Even entry-level north SF neighborhoods like Inner Richmond and Lone Mountain sit well above $2M. These neighborhoods also command the highest dollars per square foot in the city — $1,377–$1,649/sq.ft.
Competition is the fiercest it's been since spring 2022
Across all SF homes, 71% of sales closed above list price in March — the highest rate since the spring 2022 frenzy. For houses specifically, that figure is 85%, with buyers paying an average of 23% over asking. Homes are also moving fast: average days on market dropped to just 29 days citywide, and just 20 days for houses alone. If your buyers are hesitating, the data suggests waiting is costly.
Inventory is critically low — especially for houses
Total active listings are down 28% year over year, and house listings in particular are at an extreme low. With demand surging and supply shrinking, buyers are competing furiously for a very small pool of available homes. Price reductions — a gauge of seller distress — have fallen 39% from a year ago. The supply-demand imbalance shows no signs of resolving in the near term.
The luxury market is setting all-time records
In March, 22 houses sold for $5M or more — the highest monthly count ever recorded — and 24 condos sold for $3M or more, also an all-time record and up 380% year over year. Pacific Heights logged a $42M sale (off-MLS) in the past 12 months, with a $26.5M MLS-reported sale as well. This level of luxury activity reflects both the concentrated wealth of San Francisco's tech sector and growing high-net-worth buyer confidence.
"85% of house sales sold over list price — tied with April 2022 for the highest overbid percentage ever recorded in San Francisco."
Each bar represents the approximate % of sales closing over list price. Wider = more competitive.
| Jan 2022 |
|
55% |
| Apr 2022 |
|
75% ▲ Peak |
| Jul 2022 |
|
62% |
| Oct 2022 |
|
50% |
| Jan 2023 |
|
43% |
| Apr 2023 |
|
55% |
| Jan 2024 |
|
40% |
| Apr 2024 |
|
62% |
| Oct 2024 |
|
58% |
| Apr 2025 |
|
60% |
| Oct 2025 |
|
64% |
| Mar 2026 |
|
71% ▲ |
Source: NorCal MLS Alliance via Infosparks. March 2026 reading of 71% is the highest since spring 2022. For houses alone: 85%. For condos: 62%.
North SF Neighborhood Prices
12-month median house sales prices, through mid-March 2026.
| Neighborhood | Median price | $/sq.ft. | |
|---|---|---|---|
| Presidio Heights | $8,091,000 | $1,649 | |
| Pacific Heights | $6,997,500 | $1,647 | |
| Cow Hollow | $6,450,000 | $1,642 | |
| Sea Cliff | $4,644,000 | $1,377 | |
| Marina | $4,100,000 | $1,425 | |
| Russian Hill | $3,900,000 | — | |
| Lake St. / Jordan Park | $3,675,000 | $1,330 | |
| Inner Richmond | $2,650,000 | $1,133 | |
| Lone Mountain | $2,346,000 | — |
Bar width scaled to max price of $2.05M (Q2 2022 peak). Gold bar = Q1 2026.
| Q1 2019 |
|
$1.35M |
| Q2 2019 |
|
$1.50M |
| Q3 2019 |
|
$1.44M |
| Q4 2019 |
|
$1.36M |
| Q1 2020 |
|
$1.50M |
| Q2 2020 |
|
$1.61M |
| Q3 2020 |
|
$1.55M |
| Q4 2020 |
|
$1.51M |
| Q1 2021 |
|
$1.55M |
| Q2 2021 |
|
$1.88M |
| Q3 2021 |
|
$1.81M |
| Q4 2021 |
|
$1.82M |
| Q1 2022 |
|
$1.86M |
| Q2 2022 ▲ |
|
$2.05M Peak |
| Q3 2022 |
|
$1.65M |
| Q4 2022 |
|
$1.56M |
| Q1 2023 |
|
$1.53M |
| Q2 2023 |
|
$1.60M |
| Q3 2023 |
|
$1.55M |
| Q4 2023 |
|
$1.55M |
| Q1 2024 |
|
$1.65M |
| Q2 2024 |
|
$1.79M |
| Q3 2024 |
|
$1.70M |
| Q4 2024 |
|
$1.57M |
| Q1 2025 |
|
$1.60M |
| Q2 2025 |
|
$1.62M |
| Q3 2025 |
|
$1.75M |
| Q4 2025 |
|
$1.63M |
| Q1 2026 ★ |
|
$1.98M ▲ |
Source: NorCal MLS Alliance via Infosparks. Q1 2026 was the highest Q1 price ever recorded, just below the all-time Q2 2022 peak. March 2026 alone hit $2,150,000 — a new monthly record.
The Bigger Picture
Mortgage rates ticked up to 6.46% in early April, partly due to the Iran war that began in late February. A ceasefire was announced on April 7th and may put downward pressure on rates in the weeks ahead. Stock markets (S&P 500, Nasdaq) remain well above January 2025 levels, supporting buyer confidence and purchasing power — particularly in San Francisco's affluent neighborhoods. Economic policy uncertainty, while elevated by historical standards, has not deterred the city's high-net-worth buyers.
San Francisco's population has been slowly recovering since pandemic lows, reaching approximately 826,000 in 2025. Net foreign immigration has slowed significantly (down 64% in the latest 12-month period), but the city's AI and tech-driven economy continues to draw high-earning residents and sustain extraordinary housing demand.
Thinking about buying or selling?
Whether you're looking to trade up in this market, sell at the right moment, or understand what your home is worth today — let's talk.
Schedule a Conversation
FULL REPORTS
─────────────────────────────────────────────
For complete neighborhood-by-neighborhood data, price trend charts, and supply/demand analysis, access the full Compass market reports below:
Max Armour
Luxury Real Estate Advisor · Compass
(415) 290-6058
maxarmour.com
891 Beach St, San Francisco CA 94109
Over $2.5 Billion in Sales · Top 1% of SF Agents · CA DRE# 01446122
Max Armour is a real estate agent affiliated with Compass. Compass is a licensed California real estate broker (CA DRE# 01527235). All material is intended for informational purposes only and compiled from sources deemed reliable but not verified. If your property is currently listed, this is not a solicitation.
Data from Compass / NorCal MLS Alliance through March 2026. Report created in good faith from sources deemed reliable but may contain errors and is subject to revision. Last period figures are preliminary estimates. All numbers approximate and may change with late-reported activity. Median sales price is that price at which half the sales occurred for more and half for less. Max Armour, CA DRE# 01446122. Compass California II, Inc., CA DRE# 01527235. Equal Housing Opportunity. Not intended as financial or legal advice.