
San Francisco Real Estate and the Coronavirus
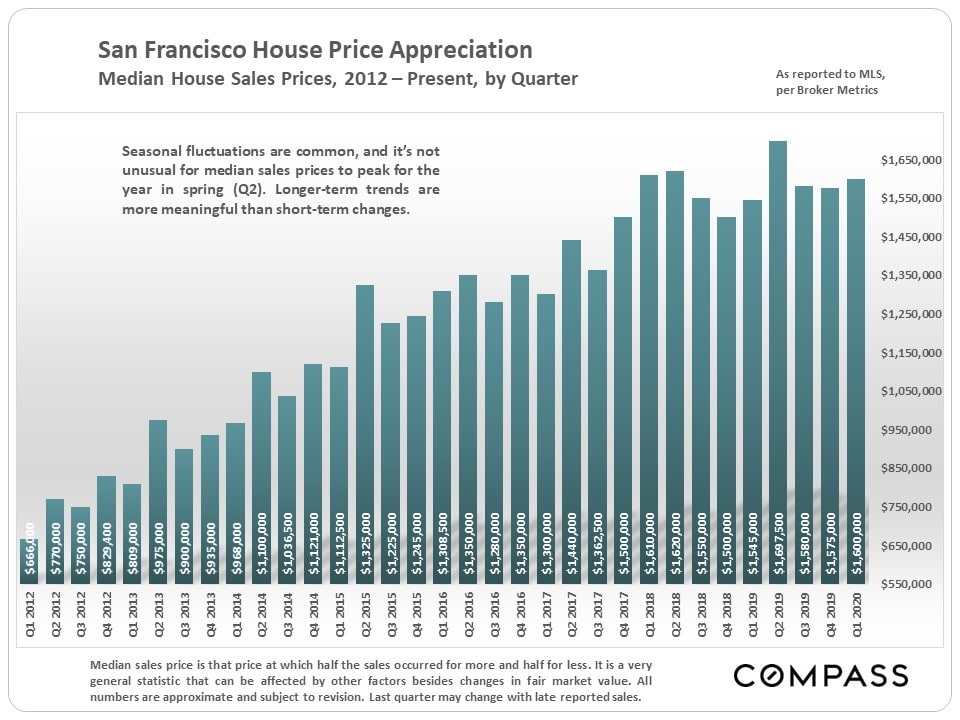
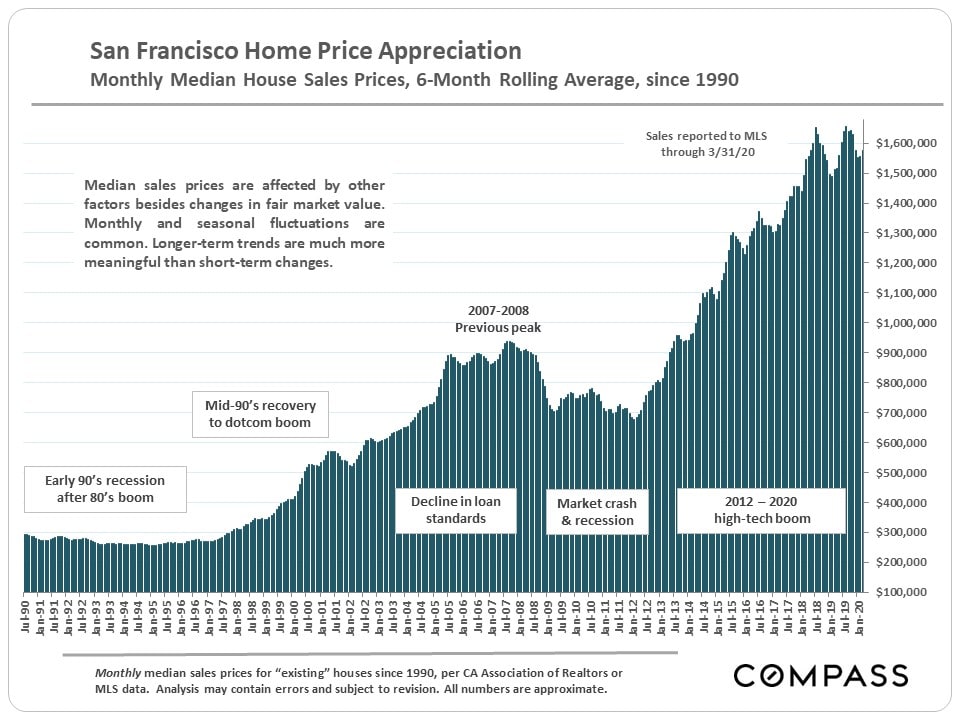
The first thing to remember is that there is a time lag - usually 3 to 6 plus weeks - between a new listing coming on market, an offer being negotiated and accepted, and when the transaction actually closes sale. This means that almost all of the sales price data we have, as of the first week of April, still reflects the market BEFORE the shelter-in-place rules went into effect. In virtually all Bay Area counties, first quarter and March median sales prices were quite strong.
This report will look at the effect of the crisis on supply and demand by reviewing week by week statistics, at sales price trends reflecting the market before the crisis, and longer-term trend data to give context to how the market typically performs at this time of year. Spring is usually the most active selling season and often sees the highest median sales prices of the calendar year, due to both the level of buyer demand and the seasonal surge in the luxury home market. (A higher percentage of luxury home sales pulls up the overall median sales price).
We do not know how the crisis will ultimately play out, depending as it does on so many, rapidly changing, socio-economic factors.
Median Sales Price Trends
These firs two charts review median sales price trends in the medium and long-term. March and first quarter prices generally reflect the pre-crisis market.
Link to our San Francisco home price map
Link to our Bay Area home price map
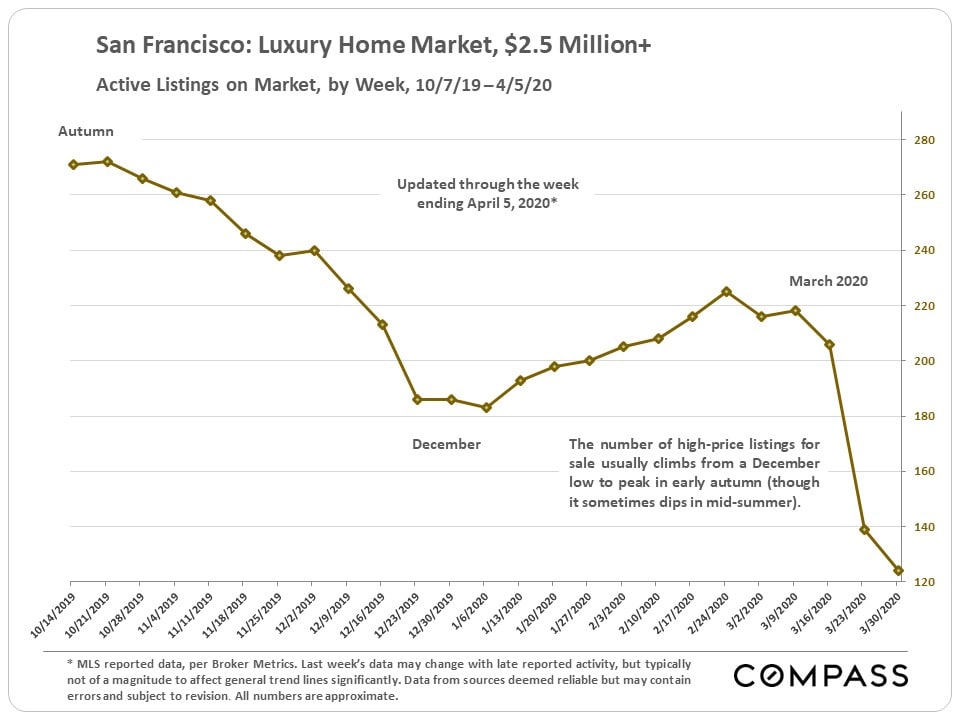
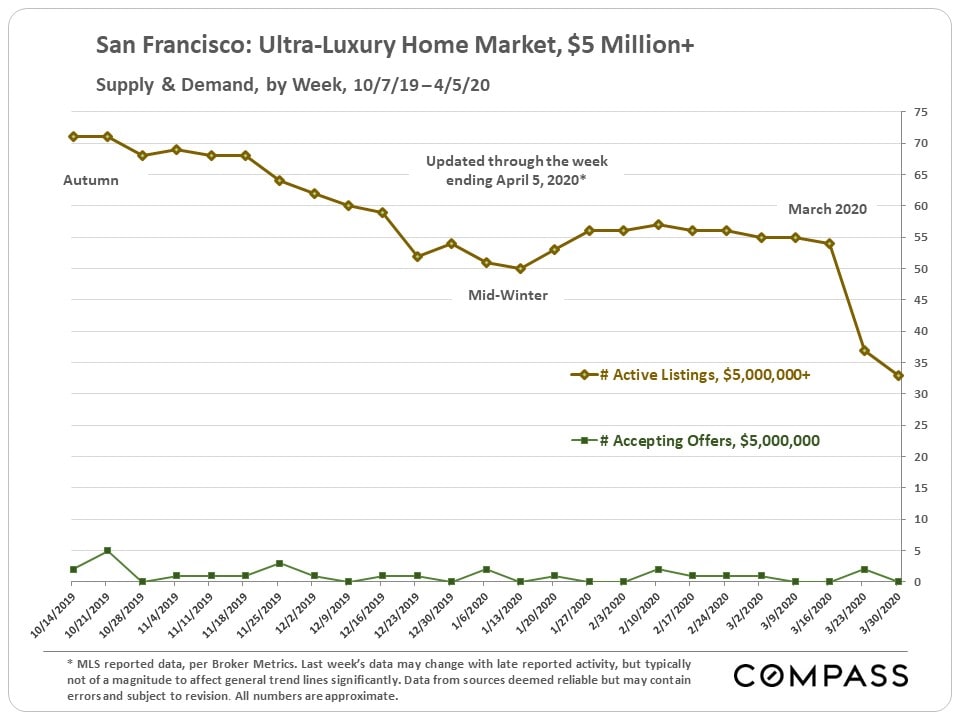
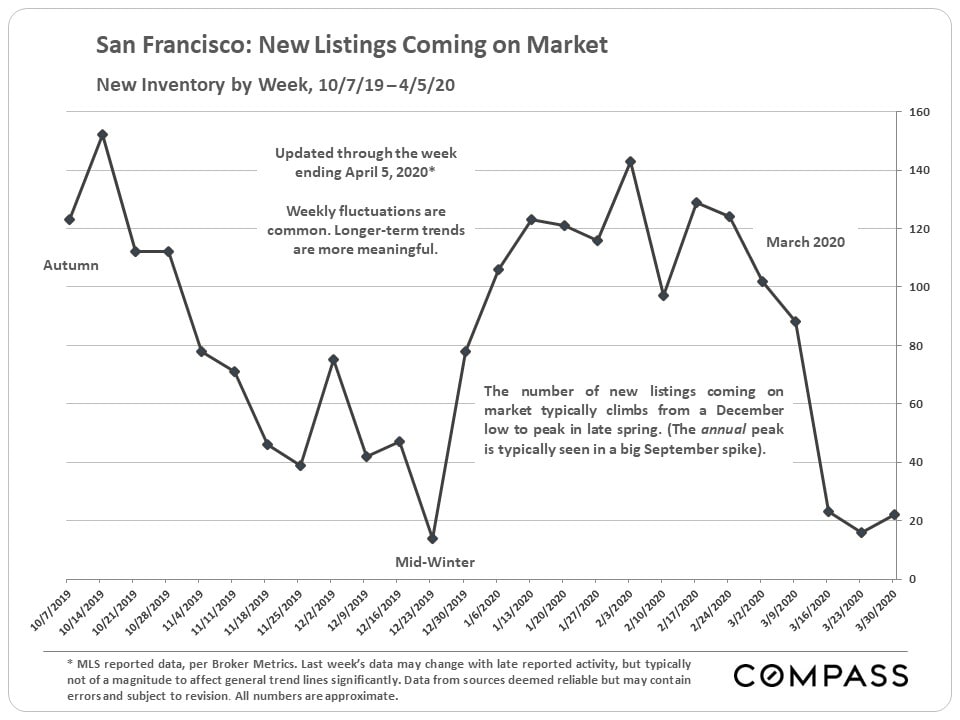
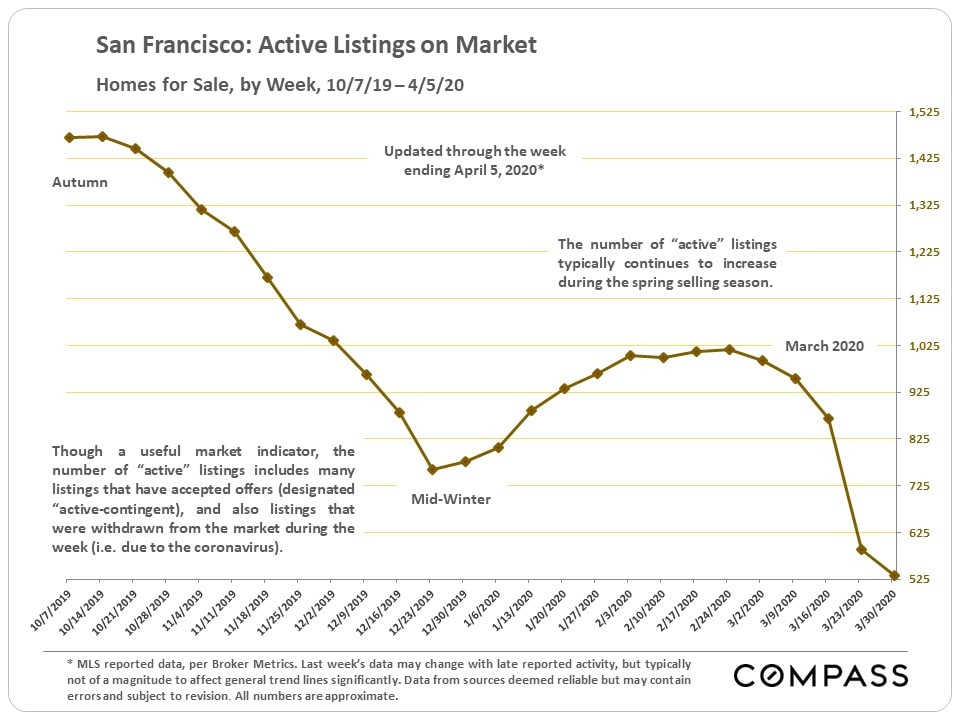
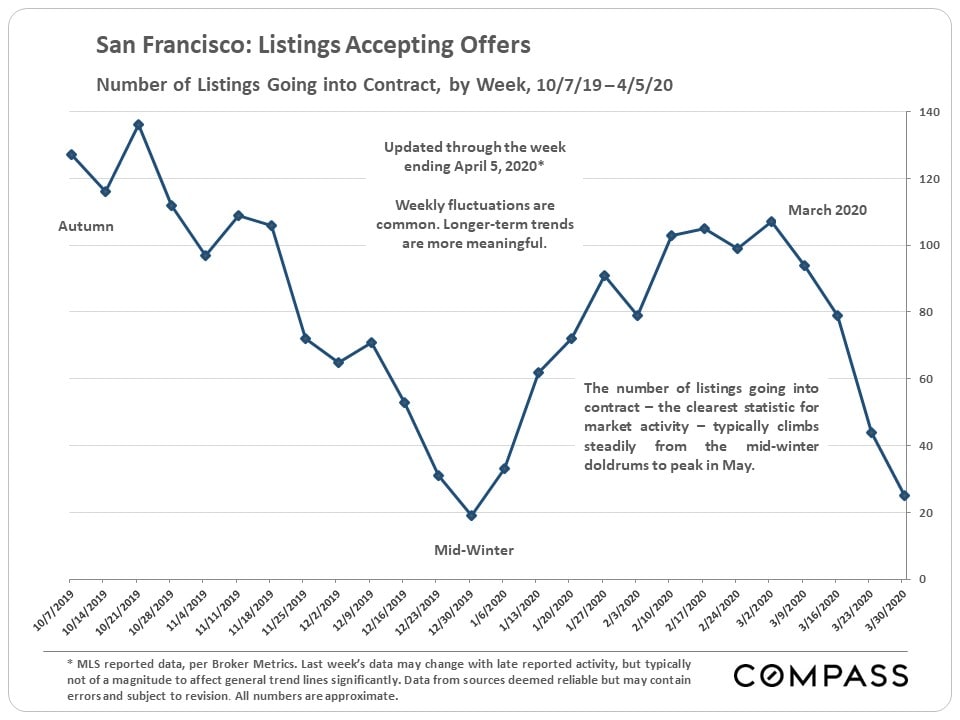
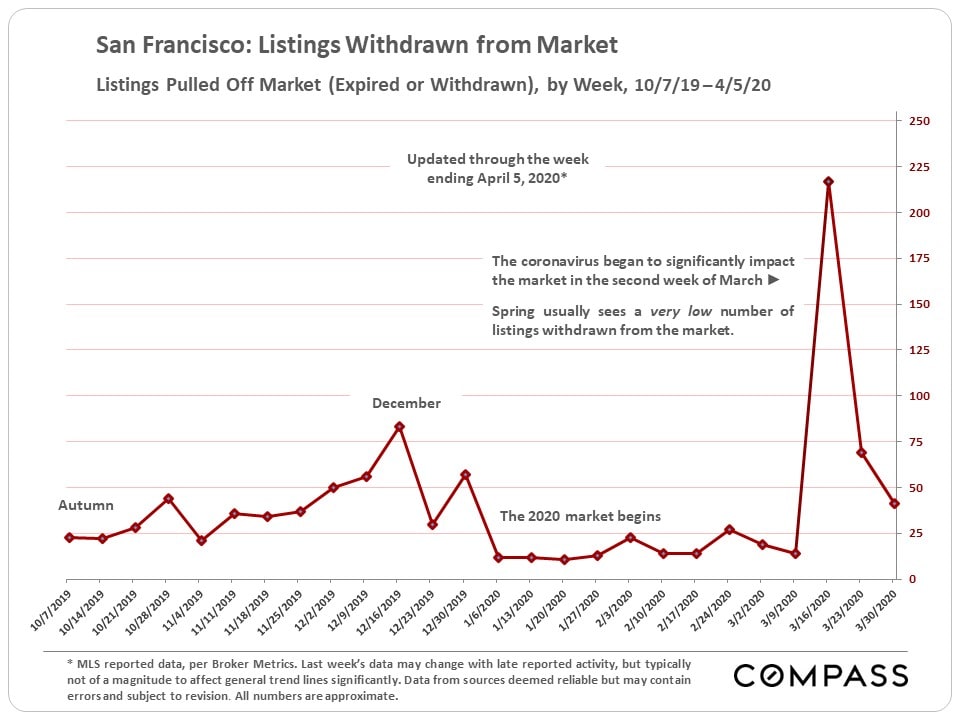
Shelter-in-Place Effect on Inventory and Deals - by Week
The following 4 charts detail the plunge in listing and accepted-offer activity, and the surge in listings being pulled off the market by sellers, over the past 4 weeks. Typically, at this time of year, the first 3 charts would be seeing steady climbs over February numbers, and the 4th chart would have a very low, flat trend line.
Though the numbers are way down, some listings have still been going into contract.
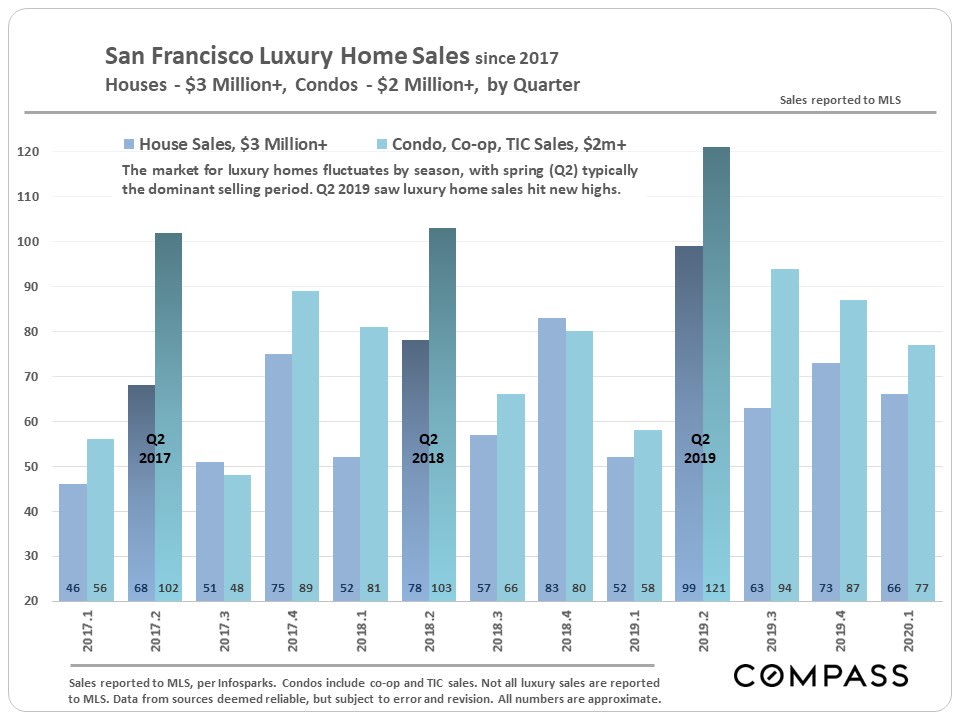
The Luxury Home Market
The luxury market is fiercely seasonal, and typically spring (Q2) sees the peak in annual sales volumes. Higher-price home sales are often more deeply affected by financial-market crises since affluent households tend to have more wealth tied up in the markets, and watch their movements more closely.
These next 2 charts look at weekly trends in the markets for homes of $2.5 million plus and of $5m plus.